
ArcGIS layers
Draw content from ArcGIS Online or ArcGIS Enterprise as context for your data: a feature layer, a map, image or vector tile service, or a whole web map. Layers can keep the symbology, labels and pop-ups they have in ArcGIS. You can have up to five ArcGIS reference layers.
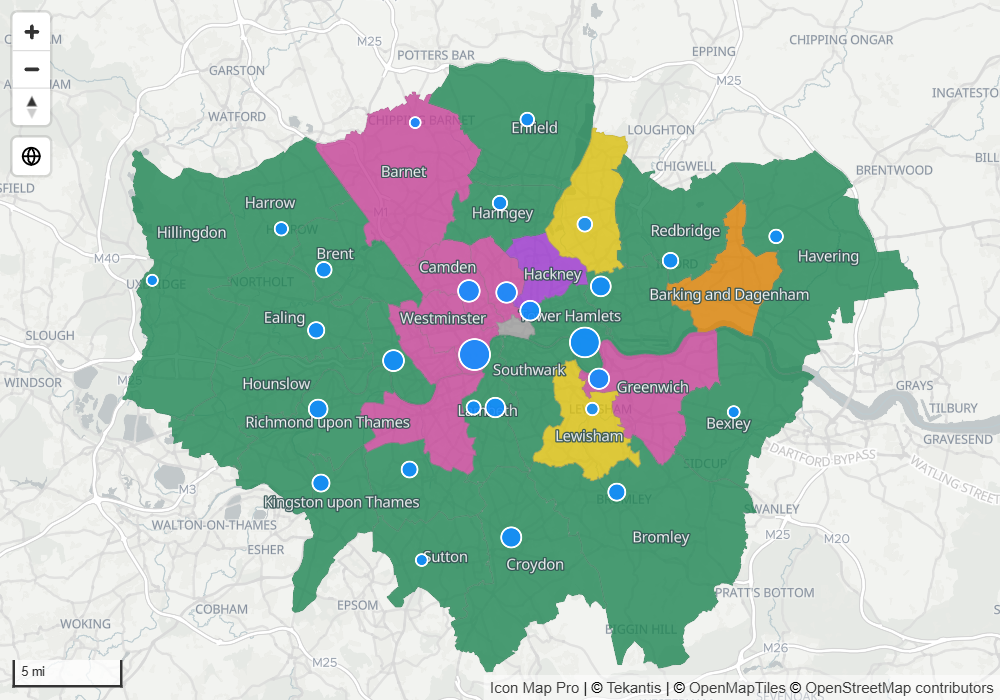
An ArcGIS reference layer is not joined to your data. To color ArcGIS features by a measure and cross-filter the report when they are clicked, see ArcGIS layers bound to data.
Before you start
Public ArcGIS content and Living Atlas layers need no setup. For anything that is private to you or your organization, choose how the map signs in first. See Connect to ArcGIS.
Add a layer with Browse ArcGIS
- In the Format pane, open the Layer Manager card and switch on Open Layer Manager.
- Select Add a layer, then Reference layer, then the ArcGIS tile.
- Choose Browse ArcGIS, then select the Browse ArcGIS button. The Layer Manager saves your pending changes and the Browse ArcGIS window opens.
- Search, or pick a tab, and select an item to preview it.
- Select Use this layer. The layer is added and saved, and the Layer Manager comes back.
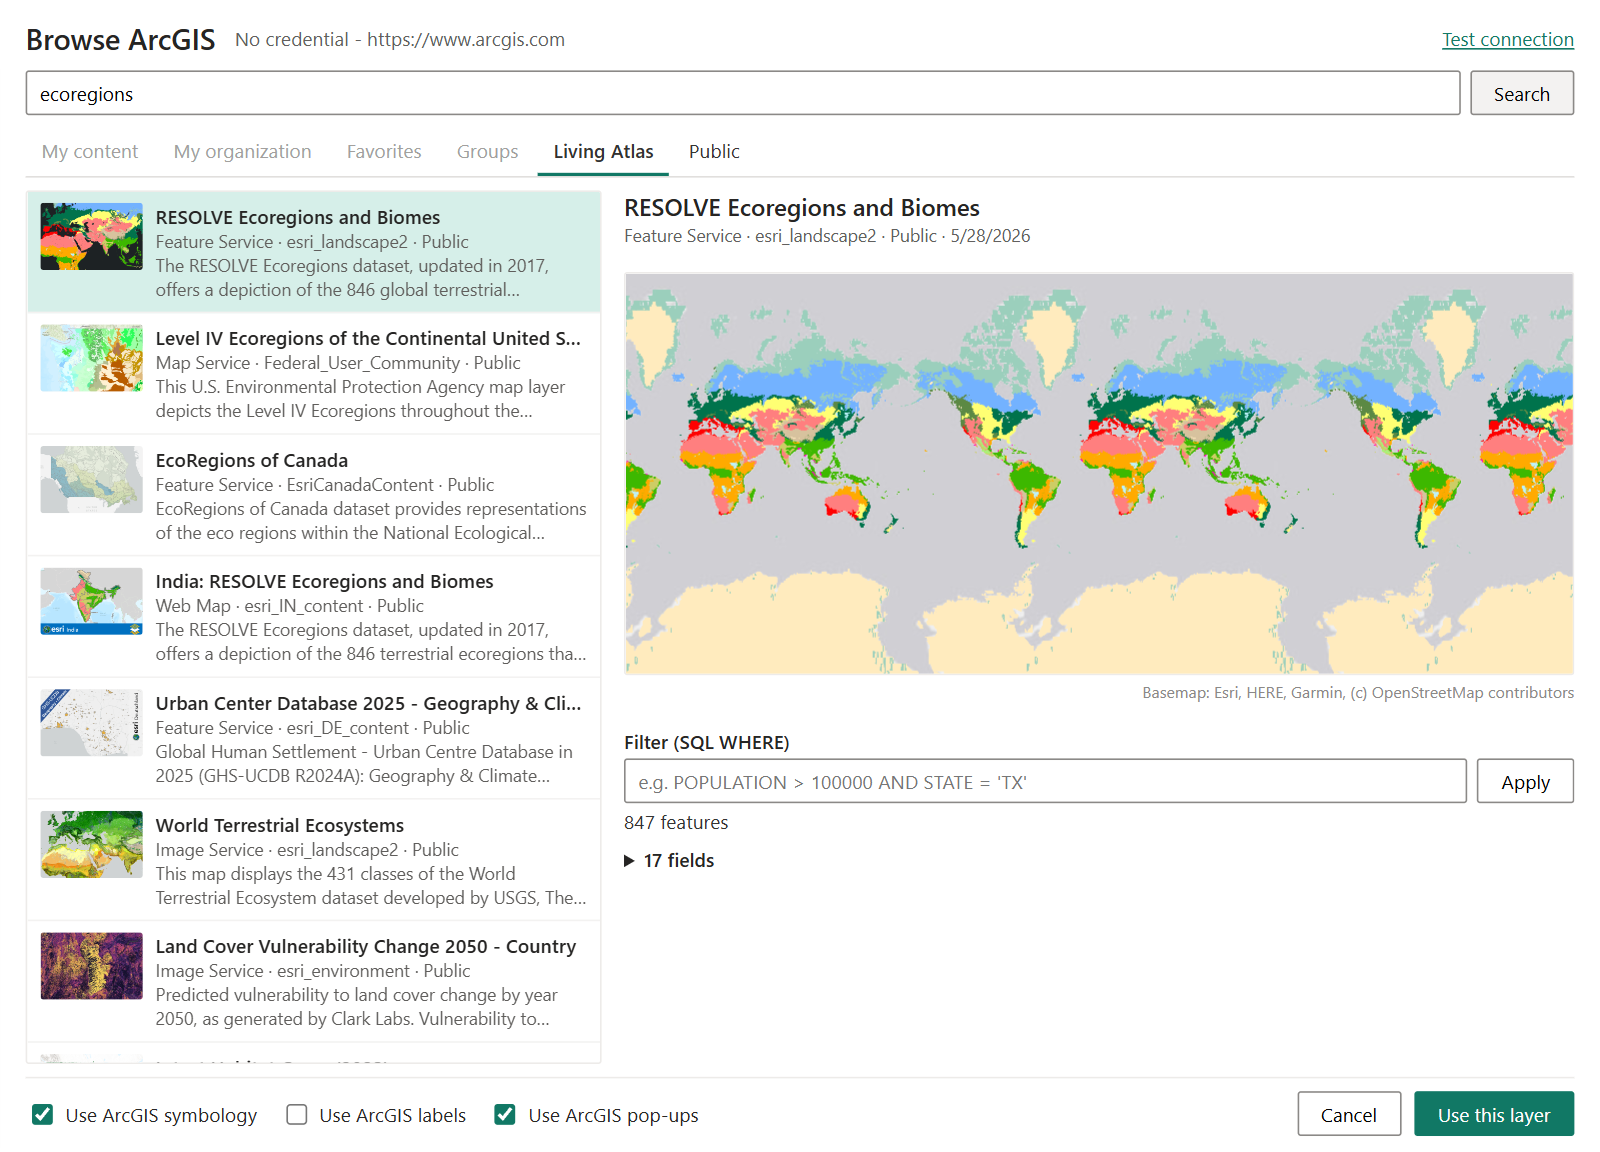
You can also open Browse ArcGIS from the Format pane: switch on Reference Layers > Layer Selection > ArcGIS Layer, then switch on Browse ArcGIS in the layer's group. The switch turns itself off again.
Add a layer from a link
If you already have the link, paste it. In the Layer Manager choose Paste a link in the ArcGIS wizard. In the Format pane paste it into ArcGIS Layer URL. Any of these work:
- An item page address from ArcGIS Online or your portal
- An item id (32 letters and digits)
- A service address, ending
FeatureServer,MapServer,ImageServerorVectorTileServer - A layer address, such as
.../FeatureServer/2
You can paste the same things into the search box of Browse ArcGIS to open the item directly.
ArcGIS Layer URL takes conditional formatting (fx), so a measure can choose the layer.
What you can add
| ArcGIS content | How it is drawn |
|---|---|
| Feature layer | As features, in the colors you set or with its ArcGIS symbology. Supports labels, tooltips, pop-ups, a filter and a legend |
| Map service | As published: raster tiles for a cached service, map images otherwise |
| Image service | As published: imagery |
| Vector tile service | As published: vector tiles in the service's own style. Web Mercator only |
| Web map | Each layer you choose, with the styling, pop-ups, labels, filters and visibility ranges saved in the web map |
Scene layers are not supported.
For a service that holds several layers, a Layer list lets you pick the one to draw. For a map service the list starts with Whole map service (as published).
For content that is drawn as published, the styling comes from the service. The color and tooltip settings in the Format pane do not apply and are hidden.
Find content in Browse ArcGIS
| Tab | Shows | Needs |
|---|---|---|
| My content | Items you own | A signed-in ArcGIS user |
| My organization | Items shared with your organization | A credential that belongs to an organization |
| Favorites | Items you marked as favorites in ArcGIS | A signed-in ArcGIS user |
| Groups | Items in a group you belong to. Pick the group from the list | A signed-in ArcGIS user |
| Living Atlas | Esri's curated collection | Nothing |
| Public | Everything shared publicly | Nothing |
A tab that your authentication type cannot use is disabled. An API key or an app credential has no user, so it cannot show My content, Favorites or Groups. Choose Sign in with ArcGIS to use those tabs.
The header shows who the map is signed in as. Test connection checks the portal, the credential and every ArcGIS layer in the map. See Connect to ArcGIS.
Each result is checked in the background:
- Items you do not have access to are removed from the list. A note says how many were hidden.
- Items you can open but the map cannot draw stay in the list, grayed, with the reason after "Not available:". Select one to read the full reason.
The preview
Select a result to preview it before you add it.
- Feature layers are previewed with up to 2,000 features, with a count of the features and a list of the fields. Type a filter in Filter (SQL WHERE) and select Apply to see its effect and the number of matching features. The filter is saved with the layer.
- Map, image and vector tile services are previewed as published.
- Web maps are previewed with their basemap and a list of their layers.
Choose the layers of a web map
A web map lists its layers with a check box each. Tick the ones to draw. Layers that are hidden in the saved web map are marked "(hidden in the web map)", and layers that cannot be drawn are listed as not supported.
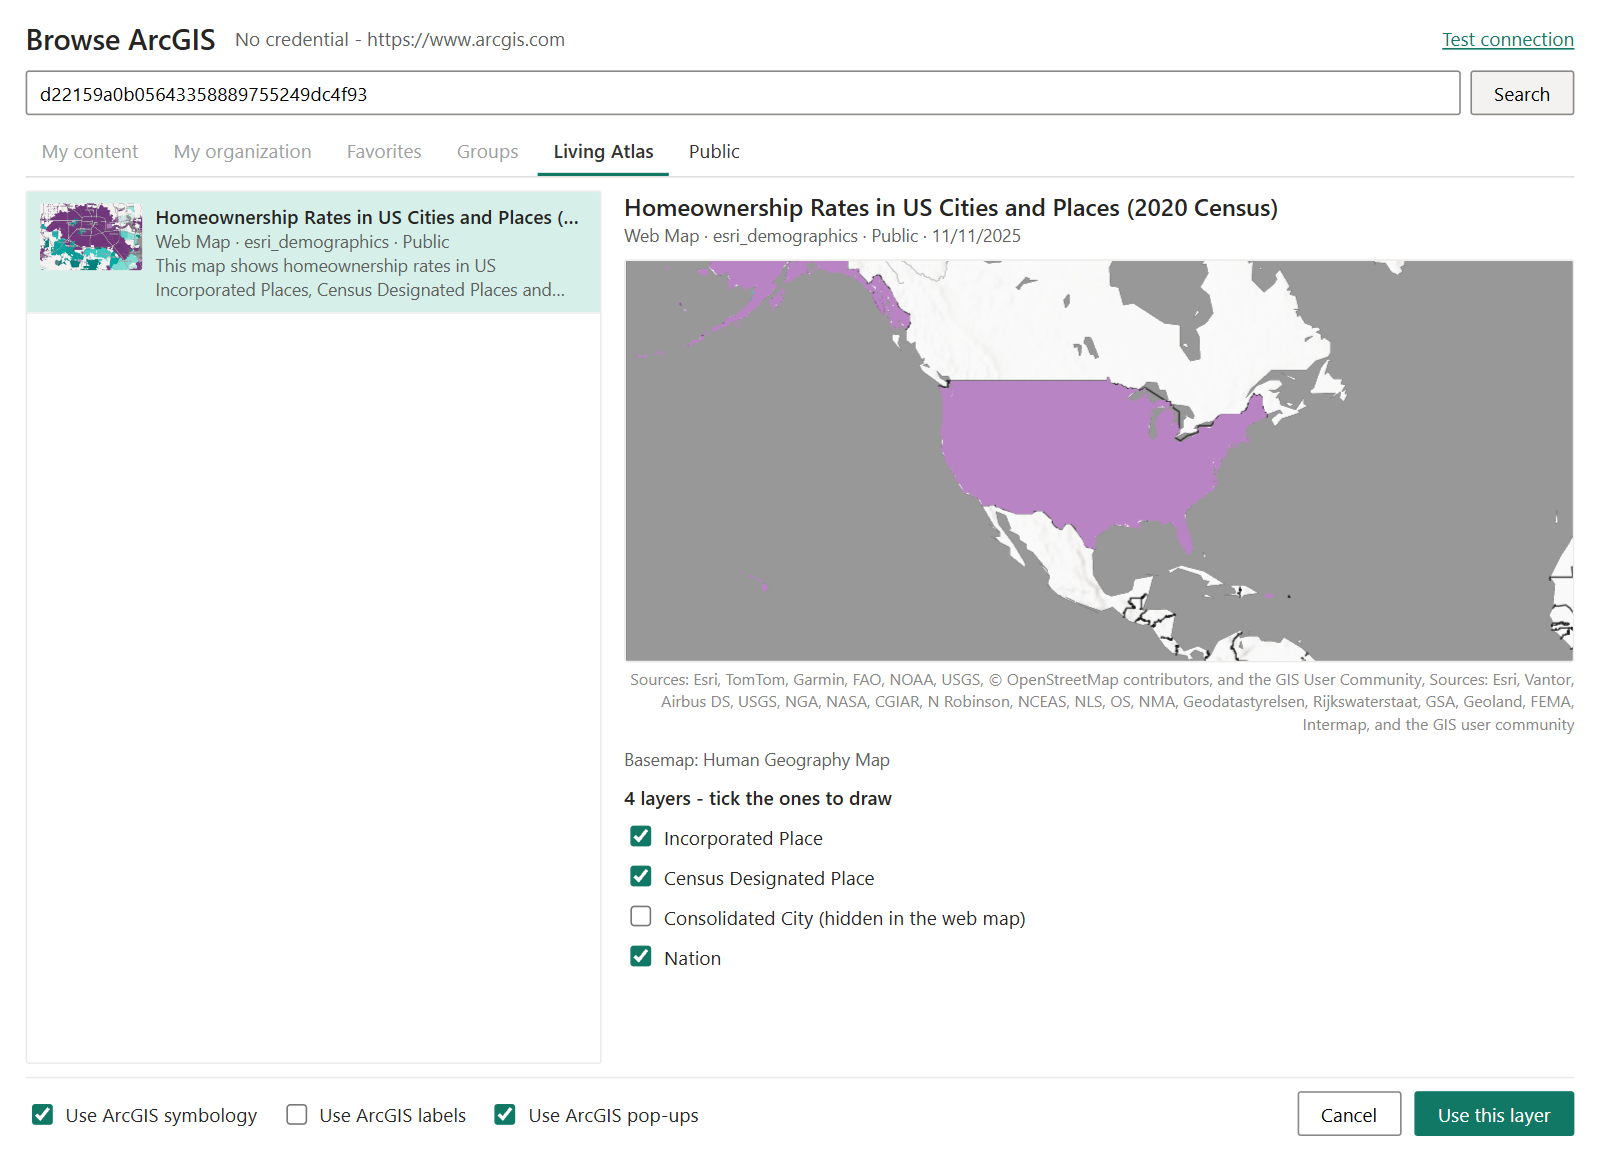
Your choice is stored in the Web Map Layers setting:
| Web Map Layers | Draws |
|---|---|
| As saved in ArcGIS | The layers that are switched on in the saved web map |
| All layers | Every layer that can be drawn |
| Chosen in Browse ArcGIS | The layers you ticked. Open Browse ArcGIS again to change them |
A web map added as a reference layer draws its layers but not its basemap. To use a web map's basemap, see Other basemap providers.
In a web map, these layer types are drawn: feature layers, map, image, tile and vector tile layers, feature collections stored in the web map, CSV, GeoJSON, KML and WFS layers, and web tile and WMTS layers in Web Mercator. Group layers are flattened. WMS layers, Bing layers and scene layers are not drawn.
Symbology, labels and pop-ups
Three check boxes at the foot of Browse ArcGIS decide how much of the ArcGIS definition the layer keeps. They match three switches in the Format pane.
| Check box | Format pane switch | What it does |
|---|---|---|
| Use ArcGIS symbology | Use ArcGIS Symbology | Draws a feature layer with its ArcGIS styling instead of the colors in the Format pane. Ticked for a new layer |
| Use ArcGIS labels | Use ArcGIS Labels | Draws the labels defined on the layer in ArcGIS, with their fonts, colors and visible zoom range |
| Use ArcGIS pop-ups | Use ArcGIS Pop-ups | Tooltips show the fields of the layer's ArcGIS pop-up, in its order, with its field names, number and date formats and coded values. Ticked for a new layer |
How ArcGIS styling is used
Symbology
With Use ArcGIS Symbology on, a feature layer is drawn from the definition you see in the ArcGIS Map Viewer:
- Single symbol, unique value, class breaks and heatmap renderers
- Fill, line, marker and picture marker symbols
- Size, color, opacity and rotation that vary with a field
- The layer's transparency and visible scale range
A layer whose renderer is not supported is drawn in the Format pane colors instead.
With the switch off, the layer is drawn with Fill Color, Outline Color and the other color settings in the Format pane, and points are drawn as circles sized by Circle Size.
Labels
With Use ArcGIS Labels on, each label class of the layer is drawn, including label expressions, label filters and placement. The labels appear in the zoom range that is common to the label class and the layer's Min Zoom and Max Zoom.
Tooltips and pop-ups
There are three ways to show information about a feature.
| You want | Set |
|---|---|
| A Power BI tooltip with every attribute, or one attribute | Include Tooltips on, and optionally Tooltip Field and Tooltip Title |
| A Power BI tooltip with the fields of the ArcGIS pop-up | Use ArcGIS Pop-ups on |
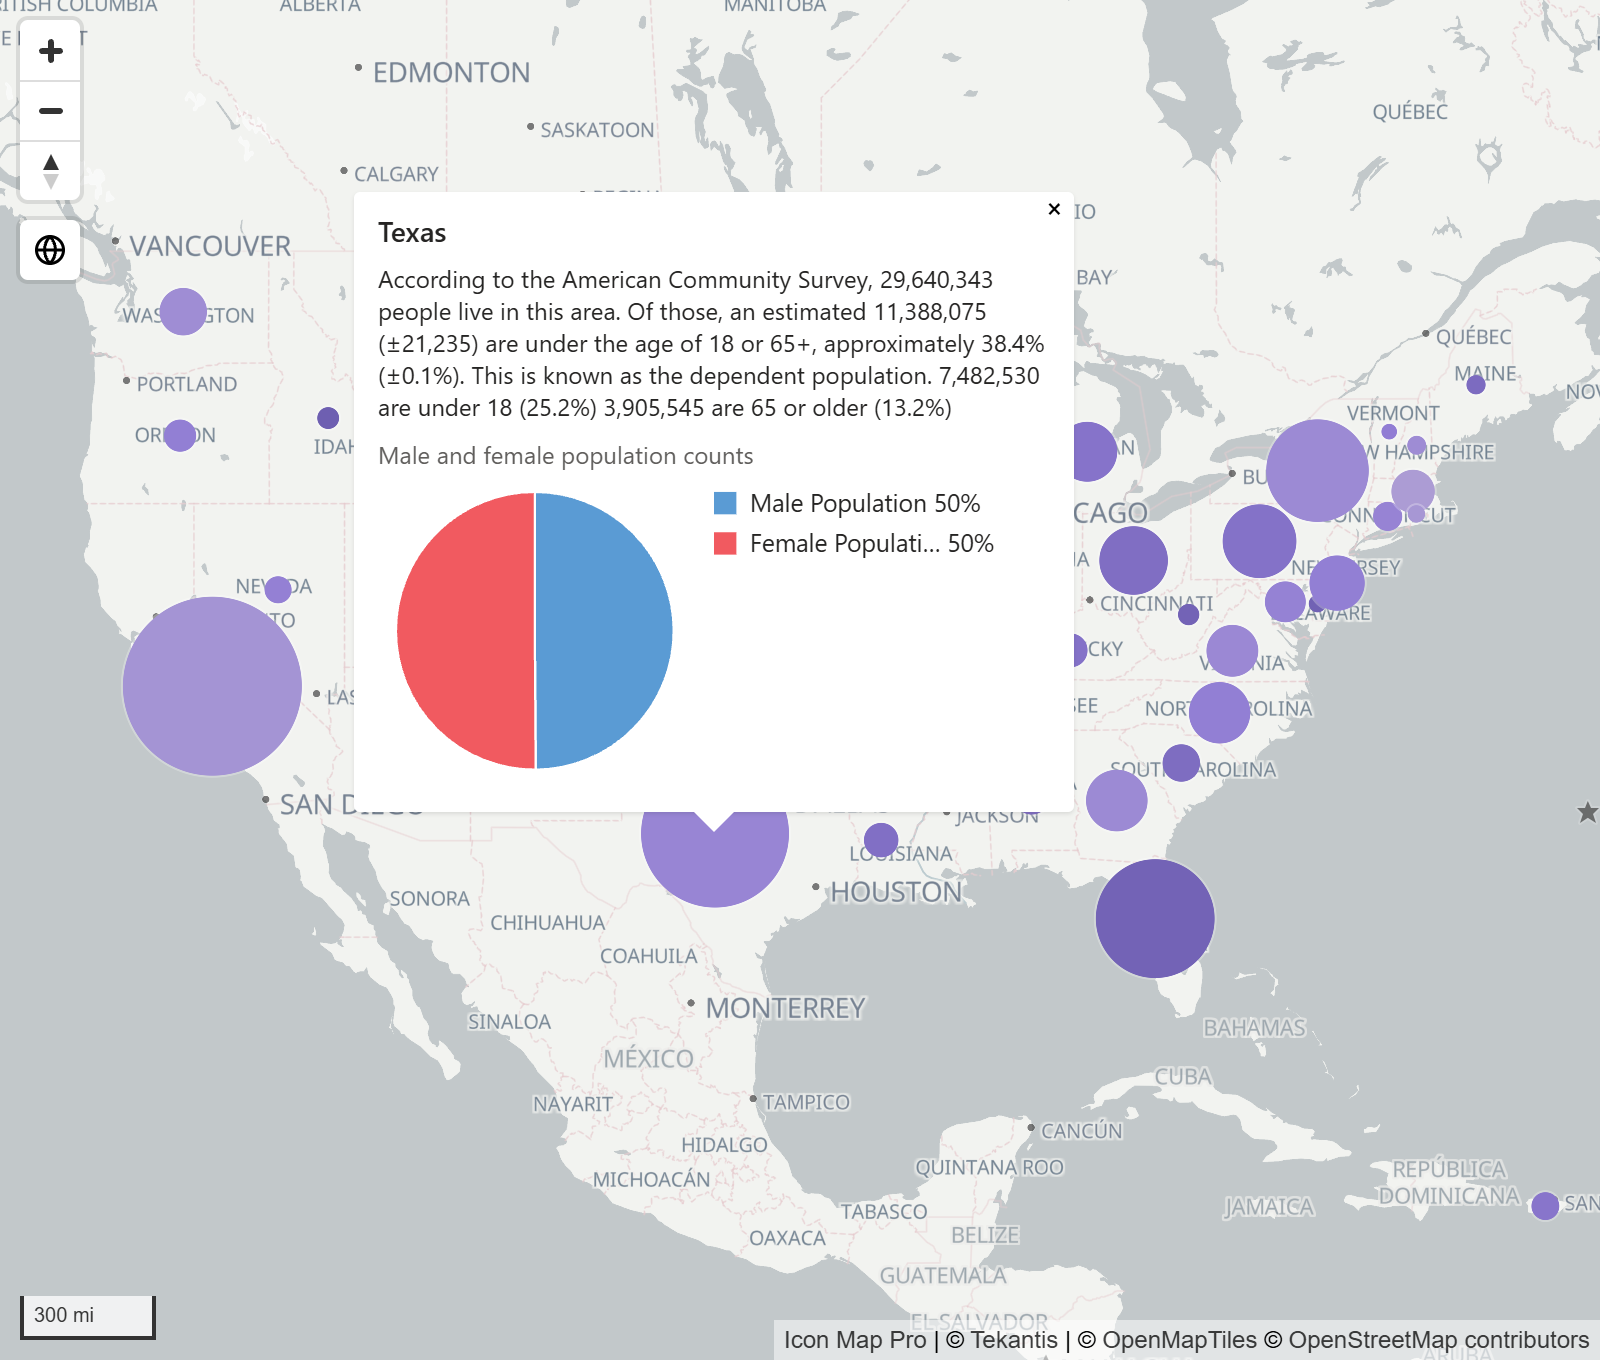
| The full ArcGIS pop-up when the reader clicks a feature | Pop-up on Click on |
Power BI tooltips are text only. With Use ArcGIS Pop-ups, the tooltip takes its title, fields, field names and number and date formats from the pop-up, and long text is shortened. A layer with no pop-up shows every attribute.
Pop-up on Click opens a pop-up on the map at the clicked feature, with the parts of the ArcGIS pop-up in order: text, fields, images, charts, attachments and related records.
Legend
Each ArcGIS reference layer can have an entry in the legend. A feature layer's entry comes from its symbology, a map or image service's entry comes from the legend the server publishes, and a web map gets a section for each of its layers. Vector tile services have no legend entry.
Switch the legend on in the Legend card, then use ArcGIS Layer {n} in legend and ArcGIS Layer {n} title under Legend labels. See Legend.
Filter a feature layer by your data
SQL WHERE Clause sends a filter to ArcGIS so that only matching features are drawn, for example STATE = 'TX'. It takes conditional formatting (fx), so a measure can build the clause from the current slicer selection.
Keep a layer up to date
Refresh Interval (seconds) reloads the layer from ArcGIS on a timer, for layers that change while the report is open. 0 turns it off. The minimum is 10 seconds. The timer pauses while the report tab is hidden.
Settings
ArcGIS Layer - Setup
Format pane > Reference Layers > ArcGIS Layer - Setup
| Setting | What it does | Default |
|---|---|---|
| Number of Layers | How many ArcGIS reference layers the map has, 1 to 5 | 1 |
| Apply settings to | The layer whose settings the group below shows. Loaded layers show their ArcGIS title | Layer 1 |
Feature layers
The group is named ArcGIS Layer, the layer number and the title of the layer.
| Setting | What it does | Default |
|---|---|---|
| ArcGIS Layer URL | An item page, item id, service or layer link. Takes conditional formatting (fx) | Empty |
| Browse ArcGIS | Opens Browse ArcGIS for this layer | Off |
| Layer | The layer of the service to draw. Shown when the service has more than one | |
| Use ArcGIS Symbology | Draws the layer with its own ArcGIS styling instead of the colors below | Off |
| Use ArcGIS Labels | Draws the labels defined on the layer in ArcGIS | Off |
| Use ArcGIS Pop-ups | Tooltips show the layer's ArcGIS pop-up fields | Off |
| Pop-up on Click | Clicking a feature opens its ArcGIS pop-up on the map | Off |
| Refresh Interval (seconds) | Reloads the layer on a timer. 0 turns it off. The minimum is 10 seconds | 0 |
| Visible | Shows or hides the layer. Takes conditional formatting (fx) | Yes |
| Circle Size | Size of points, 1 to 100. Shown for a point layer when Use ArcGIS Symbology is off | 5 |
| Outline Color | Color of outlines and lines. Shown when Use ArcGIS Symbology is off | #000000 |
| Outline Transparency | 0 is solid, 100 is invisible | 20 |
| Outline Width | Width of outlines and lines, 0 to 100 | 1 |
| Outline Dash Array | Space-separated dash and gap lengths, for example 4 4. Empty draws a solid line |
Empty |
| Fill Color | Fill color of polygons | #555555 |
| Fill Transparency | 0 is solid, 100 is invisible | 70 |
| Include Tooltips | Shows a tooltip with the feature's attributes. Shown when Use ArcGIS Pop-ups is off | Off |
| Tooltip Field | One attribute to show in the tooltip. Empty shows every attribute | Empty |
| Tooltip Title | Text to show in place of the attribute name | Empty |
| SQL WHERE Clause | A filter sent to ArcGIS. Takes conditional formatting (fx) | Empty |
| Include in Auto Zoom | Includes the layer when the map zooms to fit its content | On |
| Simplification Factor | How much shapes are simplified when a large layer is loaded in tiles, 0 to 100. Shown only for a server that cannot simplify the tiles itself | 10 |
| Decimal Precision | Decimal places ArcGIS returns for each coordinate, 0 to 15. Shown only for a server that sends features as JSON and does not simplify them itself | 5 |
| Min Zoom | The layer is hidden when the map is zoomed out past this level | 0 |
| Max Zoom | The layer is hidden when the map is zoomed in past this level | 24 |
| Z-Index | Drawing order, 0 to 1000. Higher is nearer the viewer | 345 |
Browse ArcGIS ticks Use ArcGIS symbology and Use ArcGIS pop-ups for a new layer, so a layer added there starts with both on.
Simplification Factor and Decimal Precision only matter for some servers. Layers hosted in ArcGIS Online send features in a compact binary format and simplify each tile for the zoom level themselves, so neither setting is shown for them. Both are shown until the map has read the layer, and a value you set is kept.
Services and web maps
For a map, image or vector tile service or a web map, the group shows a note saying how the content is drawn, then these settings.
| Setting | What it does | Default |
|---|---|---|
| ArcGIS Layer URL, Browse ArcGIS | As for feature layers | |
| Visible | Shows or hides the layer. Takes conditional formatting (fx) | Yes |
| Transparency | 0 is solid, 100 is invisible | 0 |
| Web Map Layers | Which layers of a web map to draw. Web maps only | As saved in ArcGIS |
| Use ArcGIS Labels, Use ArcGIS Pop-ups, Pop-up on Click | Apply to the feature layers of a web map. Web maps only | Off |
| Include in Auto Zoom | Includes the extent of the web map when the map zooms to fit its content. Web maps only | On |
| Min Zoom, Max Zoom | The zoom range in which the layer is drawn | 0, 24 |
| Z-Index | Drawing order, 0 to 1000 | 345 |
In the Layer Manager
Select an ArcGIS layer in the Layer Manager to change Visible, Transparency, Visible at zoom, Use ArcGIS symbology, Use ArcGIS labels, Use ArcGIS pop-ups and Pop-up on click. Open Browse ArcGIS lets you choose a different item or change which layers of a web map are drawn. Colors, the tooltip fields and the WHERE clause are in the Format pane.
Tips and limits
- Reference features cannot be selected. With Pop-up on Click a click opens the pop-up. It does not cross-filter the report.
- A feature layer with up to 5,000 features is loaded whole. A larger layer is loaded in tiles as the reader pans and zooms, with shapes simplified to suit the zoom level.
- Vector tile services must be in Web Mercator.
- Pop-up content that depends on other layers of the map, or on geometry calculations, is left out.
- If a server blocks requests from Power BI, Browse ArcGIS offers to read it through the Icon Map proxy. See Connect to ArcGIS.
- If the Browse ArcGIS window cannot open, paste the link into ArcGIS Layer URL instead.
- If a web map draws nothing, set Web Map Layers to All layers, or choose layers in Browse ArcGIS.
- If a layer disappears as you zoom, check its visible range in ArcGIS. With Use ArcGIS Symbology on, the layer's own ArcGIS range is honored, as in the ArcGIS Map Viewer, so the layer is hidden past it whatever Min Zoom and Max Zoom say. Turn off Use ArcGIS Symbology to show the layer at every zoom.