
Circles
The Circles layer draws a circle at each longitude and latitude, sized by a number in your data. Use it for stores, sites, customers, incidents or anything else that is a point with a value.
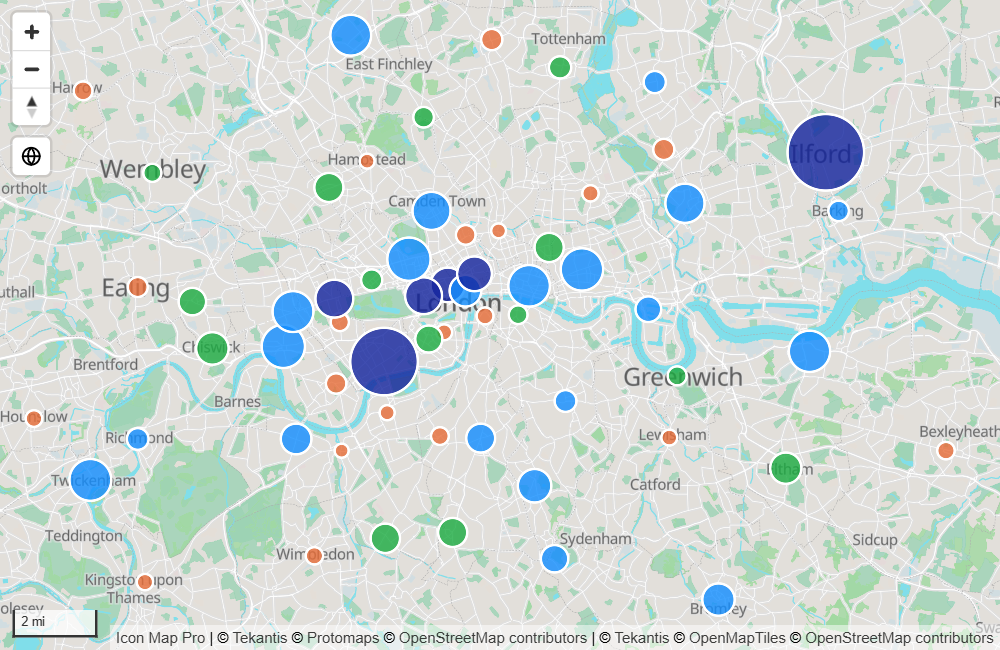
What you need
Add these fields to the visual in the Build pane:
| Field well | What to put in it |
|---|---|
| * ID (required) | A unique value for each row, such as a store name or code |
| Longitude (X) | Longitude in decimal degrees, summarized as Average |
| Latitude (Y) | Latitude in decimal degrees, summarized as Average |
| Circle Size | A number that sets each circle's size |
A row is only drawn as a circle when all four have a value. Circle Size is required: a row with no size value is not drawn. If you want every circle the same size, add any measure that returns the same number for every row.
These fields must be empty on a circle's rows, because they mark a row as belonging to another layer: Destination Longitude, Destination Latitude, Image / WKT / GeoJSON, Feature Reference, Heatmap Weight, Cell (H3/S2/A5/Geohash) Weight and Column Height. If your map only uses circles, leave those field wells empty.
Add circles to the map
On a new map the Circles layer is already turned on, so circles appear as soon as the four fields are in place.
- Add Icon Map Pro to the report page and add a field to * ID (required).
- Add your coordinates to Longitude (X) and Latitude (Y). Set each to Average.
- Add a number to Circle Size.
If no circles appear and the panel What kind of map are you making? is showing, select the Circles tile. It lists any field that is still missing and turns the layer on.
Style the circles in the Layer Manager
- In the Format pane, expand Layer Manager and switch on Open Layer Manager.
- Select the Circles row in the list on the left. If Circles is not in the list, select Add a layer, then Data layer, then Circles.
- Change the size, fill, outline and zoom range.
- Select Apply changes.
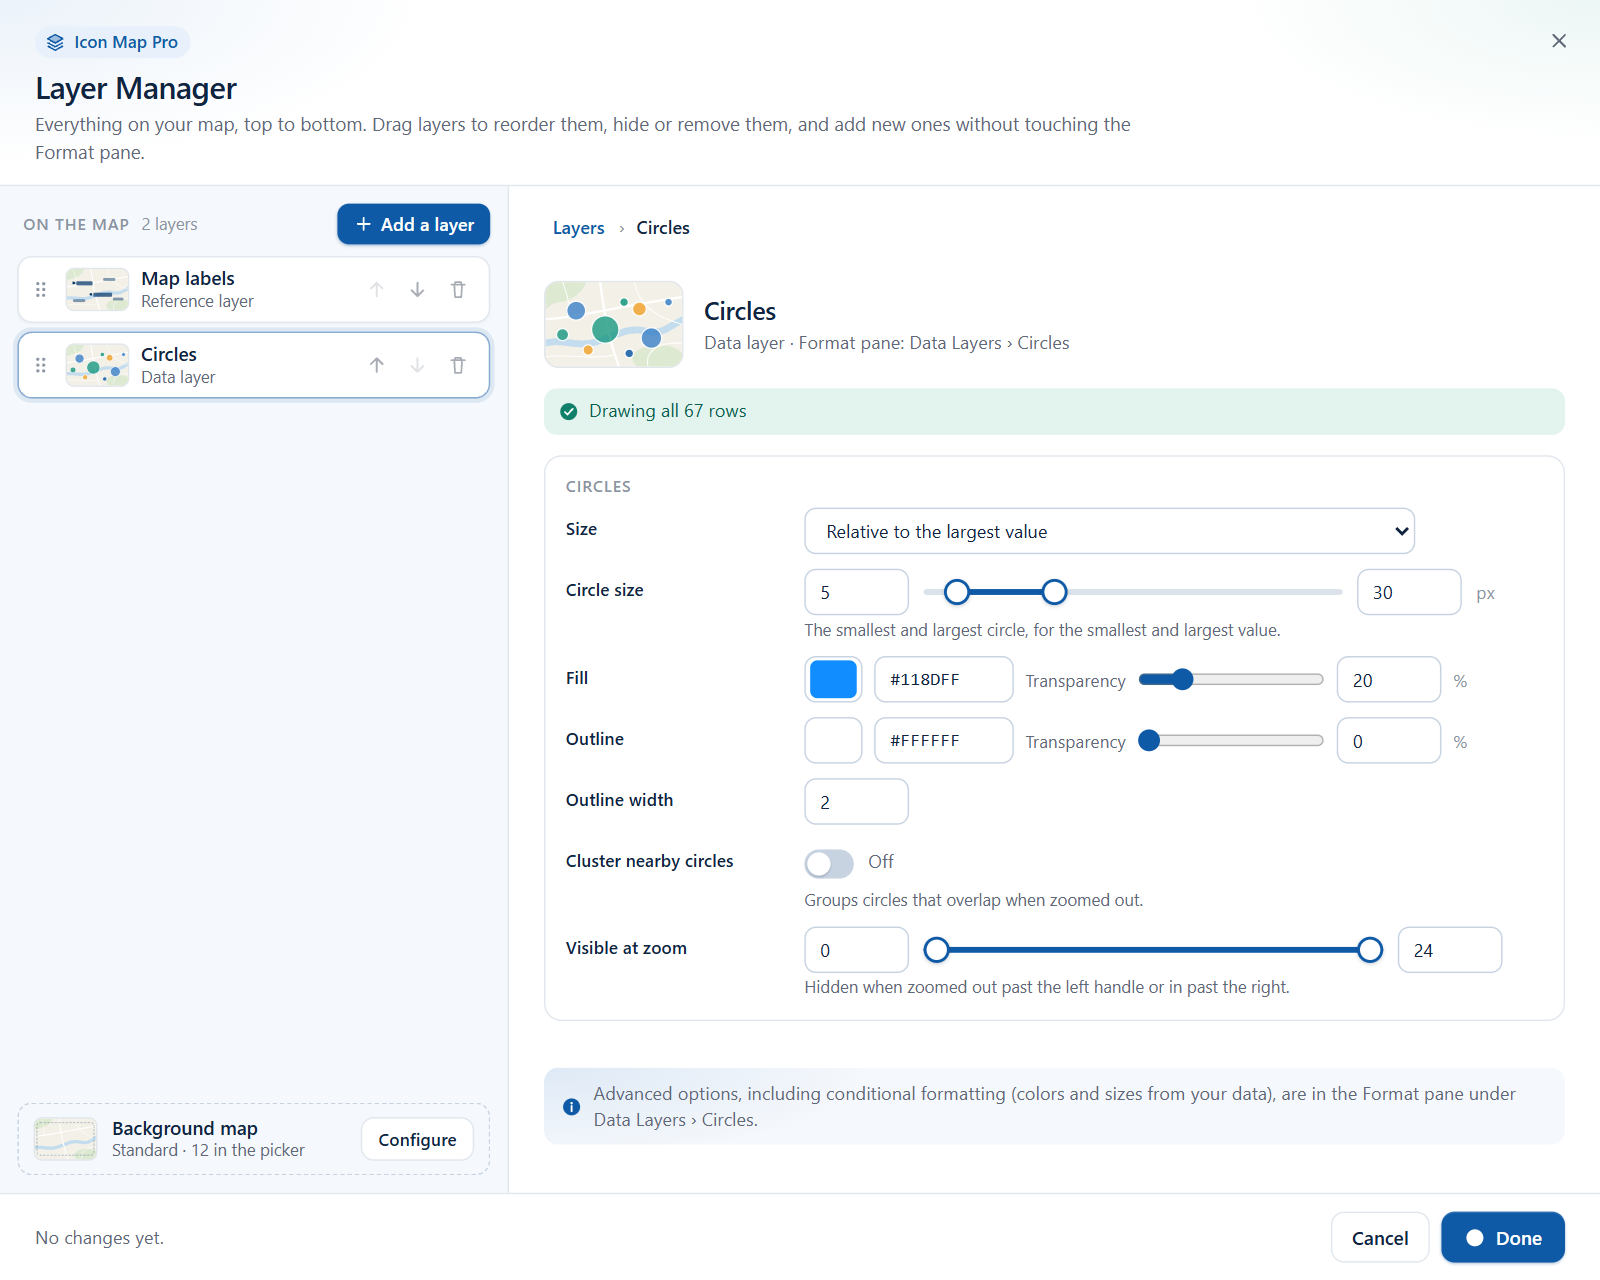
The Layer Manager offers these settings:
| Layer Manager setting | Same as, in the Format pane |
|---|---|
| Size | Size Behavior |
| Circle size | Minimum Size and Maximum Size |
| Fill | Fill Color and Fill Transparency |
| Outline | Outline Color and Outline Transparency |
| Outline width | Outline Width |
| Cluster nearby circles | Cluster circles |
| Visible at zoom | Minimum Zoom and Maximum Zoom |
Everything else, including conditional formatting (fx), is in Format pane > Data Layers. The two always agree, because they change the same settings. See Edit, reorder and remove layers.
How circles are sized
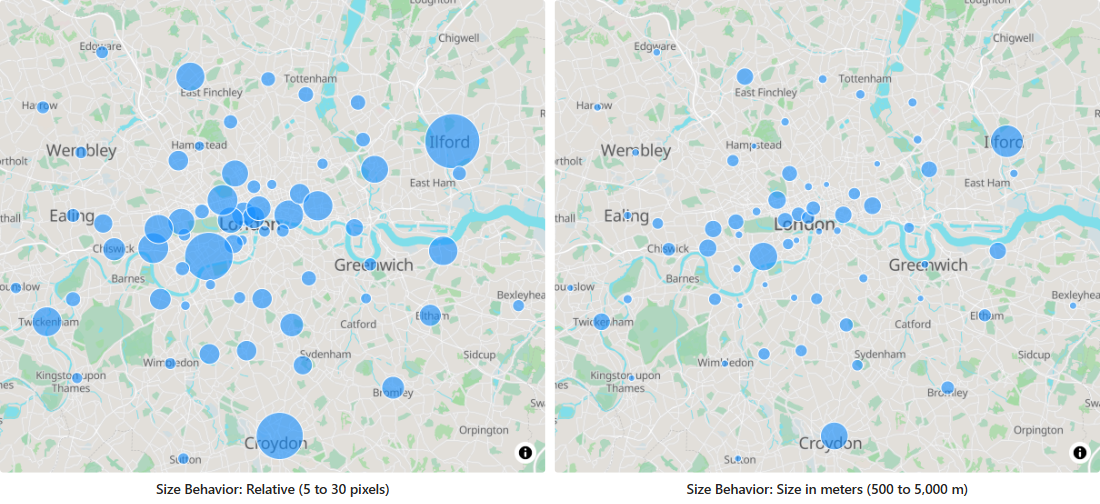
Size Behavior decides how the Circle Size value becomes a size on screen.
| Size Behavior | What it does |
|---|---|
| Relative | The smallest value in your data gets Minimum Size, the largest gets Maximum Size, and the rest are scaled in between. If every value is the same, every circle gets Minimum Size. |
| Size in pixels | The value is the circle's radius in pixels. A value of 10 draws a circle 20 pixels across. |
| Size in meters | The value is the circle's radius in meters on the ground. Circles grow and shrink as you zoom, like a real area on the map. |
Minimum Size and Maximum Size are also radii in pixels.
Color circles from your data
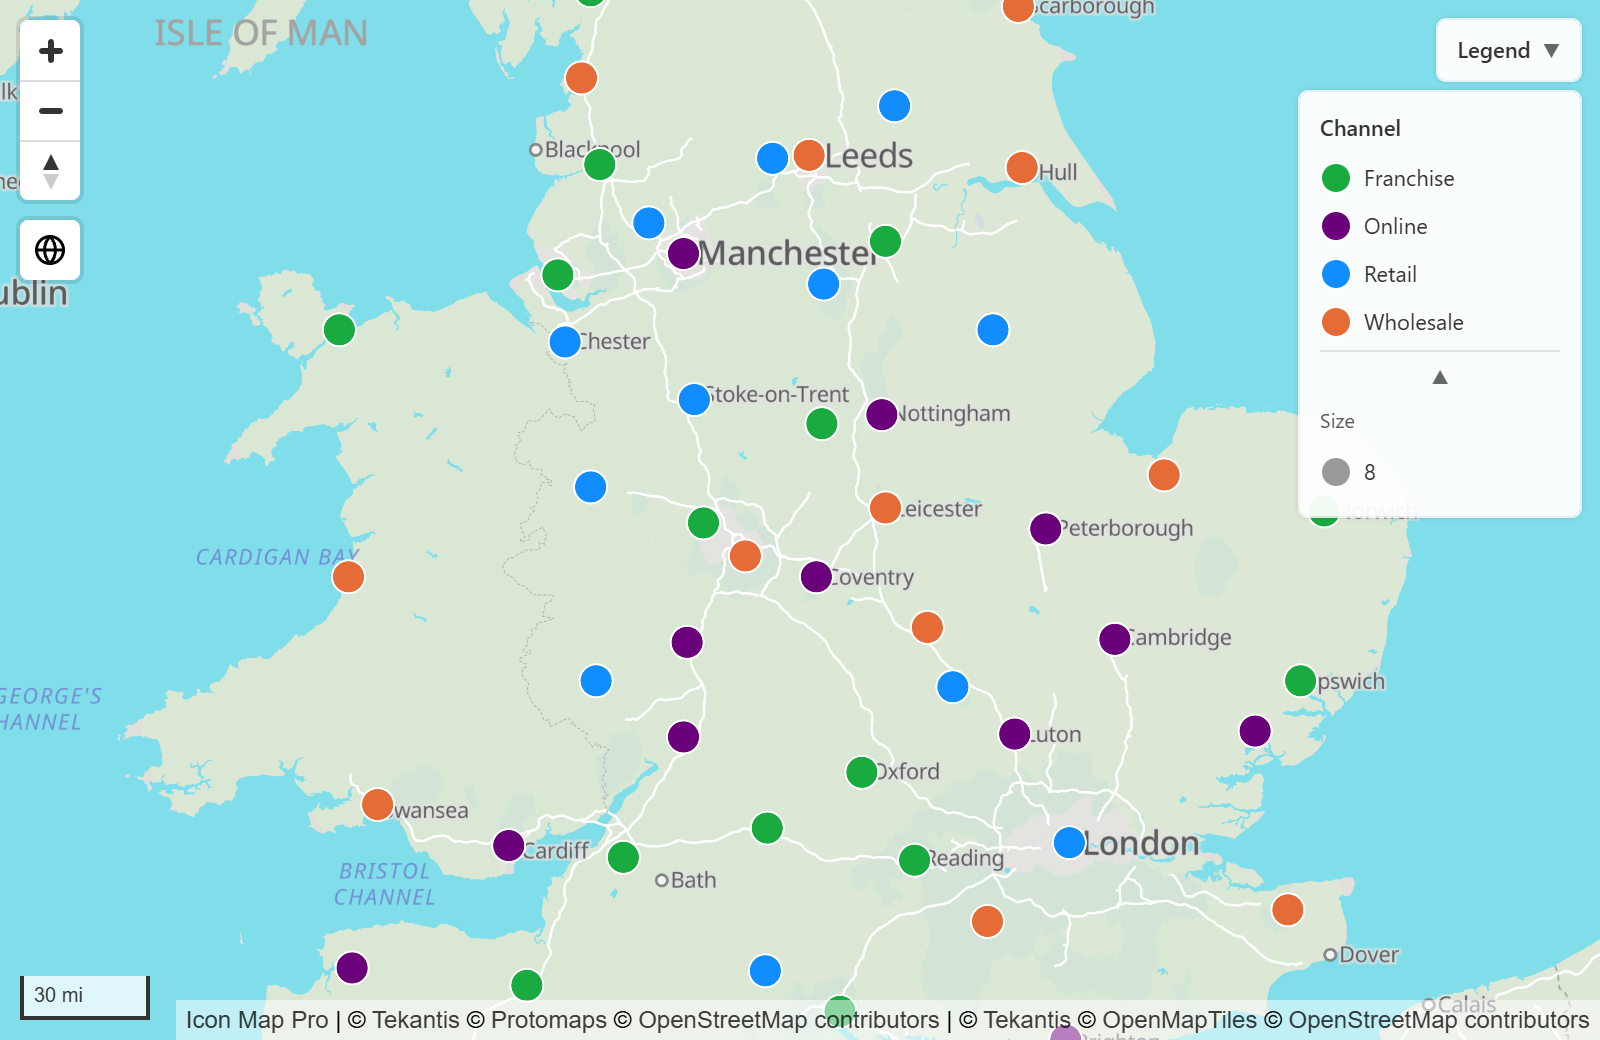
Fill Color, Outline Color and the other formatting settings each have an fx button. Select it next to Fill Color to color circles by a rule, a color scale on a measure, or a field that holds a color. Each row gets its own result. See Conditional formatting.
Settings
All of these are in Format pane > Data Layers. The groups appear when the Circles switch is on. The fx column shows which settings take conditional formatting.
Circles - Configuration
| Setting | What it does | Default | fx |
|---|---|---|---|
| Size Behavior | How the size value is used: Relative, Size in pixels or Size in meters. See above. | Relative | |
| Minimum Size | Radius in pixels of the smallest circle. Shown for Relative. 0 to 100. | 5 | |
| Maximum Size | Radius in pixels of the largest circle. Shown for Relative. 0 to 100. | 30 | |
| Cluster circles | Groups nearby circles into one cluster. See Clusters. | Off | |
| Pitch Alignment | How circles sit when the map is tilted. Map lays them flat on the map. Viewport keeps them upright, facing you. | Viewport | |
| Pitch Scale | How circles are sized when the map is tilted. Map makes distant circles smaller. Viewport keeps them all the same size. | Map | |
| Include in Auto Zoom | Whether a circle counts toward the area the map zooms to. | Yes | Yes |
| Include Tooltip | Whether a circle shows a tooltip. | Yes | Yes |
| Selectable | Whether a circle can be selected. | Yes | Yes |
| Z Index | Drawing order among the layers. Higher draws on top. 0 to 1000. | 405 | |
| Minimum Zoom | Circles are hidden when the map is zoomed out past this level. | 0 | |
| Maximum Zoom | Circles are hidden when the map is zoomed in past this level. | 24 | |
| EPSG | Coordinate system of your longitude and latitude. Change it if your coordinates are not decimal degrees. | 4326 |
Circles - Formatting
| Setting | What it does | Default | fx |
|---|---|---|---|
| Outline Color | Color of the circle's outline. | Theme color | Yes |
| Outline Transparency | 0 is solid, 100 is invisible. | 0 | Yes |
| Outline Width | Width of the outline in pixels. 0 removes it. | 2 | Yes |
| Fill Color set by cluster | Shown when Cluster circles is on. Circles that are not in a cluster take the color of their Cluster Group value instead of Fill Color. | On | |
| Fill Color | Color of the circle. | Theme color | Yes |
| Fill Transparency | 0 is solid, 100 is invisible. | 20 | Yes |
| Blur | Softens the circle's edge. 0 is a crisp edge, 100 fades the whole circle out from its center. | 0 | Yes |
Selection, tooltips and labels
- Selection. Select a circle to cross-filter or cross-highlight the rest of the report page. Hold Ctrl to select several. The circles you did not select fade, using the transparency values in the Interactivity card. See Selection, cross-filtering and highlighting.
- Tooltips. With no fields in Tooltips, the tooltip shows the ID and the Circle Size value. As soon as you add fields to Tooltips, the tooltip shows only those fields. See Tooltips.
- Labels. Circles can carry data labels, placed at the center, above, below, left or right of the circle. See Data labels.
- Legend. Circles can have their own entry in the legend. When Fill Color is set with conditional formatting (fx), the legend shows the colors, but it names the categories only when Circles description in Format pane > Legend > Legend labels is also set with fx. See Legend.
Set Include Tooltip or Selectable to No, or use fx to set them per row, for circles that are only there for context.
Tips and limits
- A row with a value in both Circle Size and Column Height is not drawn by either layer. Use one or the other on each row.
- A row with destination coordinates is a line, not a circle. The Lines layer can draw circles at the ends of its lines. See Lines.
- Circles and images each have their own position in the drawing order: circles at the Circles Z Index (405), images at the Images Z Index (410).
- With many overlapping circles, raise Fill Transparency, turn on Cluster circles, or consider a Heatmap or Cells.
- The visual loads 30,000 rows by default. See Data rows and limits to load more.
- Dashed outlines and hatched fills are part of the Legacy engine, see the documentation for 1.1.0.9 and earlier.