Why Icon Map for Consumer‑Packaged Goods?

Icon Map helps CPG teams bring together retail, trade, supply, and sustainability data in spatial context to drive growth, optimise execution, and strengthen resilience.

Route‑to‑Market & Trade Performance

Fuse distributor, retailer, and trade‑spend data in spatial context to sharpen execution, reduce leakage, and accelerate profitable growth.

Distributor coverage analytics

Reveal distribution gaps and overlaps across regions. Optimise territories and visit plans to balance reach, efficiency, and cost‑to‑serve.

Trade promotion ROI

Compare uplift to baseline sales by retailer and region. Prioritise spend on the most effective campaigns and reduce waste in underperforming markets.

Price‑pack architecture

Map price corridors and elasticity across micro‑markets. Align pack sizes and price points to consumer purchasing power and competitive dynamics.

New product launch tracking

Monitor distribution build, availability, and early out‑of‑stocks by region or cluster. Rapidly identify lagging territories and reallocate support.

Cost‑to‑serve

Allocate logistics, handling, and trade costs by SKU, lane, and customer. Expose unprofitable combinations and enable better channel and assortment decisions.

Retail execution benchmarking

Track store‑level compliance, shelf availability, and display coverage. Benchmark performance across regions to ensure consistent market presence.

Manufacturing & Supply Excellence

Combine production, inventory, and distribution data in spatial context to optimise service levels, cut stock‑outs, and improve profitable growth.

Demand‑driven production & inventory positioning

Plan production and inventory allocation by retailer distribution centre (DC) catchment. Anticipate demand surges and rebalance stock to minimise shortages and costly changeovers.

OTIF & case‑fill performance

Track On‑Time In‑Full and case‑fill metrics by lane, DC, and customer. Drill through to root causes such as transport bottlenecks, plant delays, or co‑packer shortfalls.

Co‑packer & plant performance maps

Surface hotspots for yield loss, waste, downtime, and excess energy use across multiple plants or partner co‑packers. Prioritise improvements where they have the highest financial and service impact.

Cold‑chain & shelf‑life risk

Monitor temperature compliance and freshness exposure across routes. Identify risk points in chilled or frozen supply chains to safeguard quality and reduce returns.

Recall & traceability

Follow production lots from plant to DC to retail region. Rapidly pinpoint exposure in the event of safety issues, supporting regulatory compliance and consumer trust.

Sustainability & resilience overlays

Overlay emissions, packaging waste, and energy intensity by plant, lane, or region. Strengthen ESG reporting while building resilience against climate or supply shocks.

Category Insight & Growth

Bring consumer, retail, and sustainability data into spatial context to drive stronger category roles, targeted investment, and long‑term brand growth.

Assortment localisation

Tailor product ranges by retailer cluster or micro‑market. Match local consumer preferences to lift on‑shelf availability, increase basket size, and reduce unnecessary SKUs.

Joint business planning

Enable portfolio‑level maps with instant drill‑down to category roles, shelf‑space benchmarks, and performance by retailer. Support stronger collaboration with key accounts.

Consumer demand sensing

Blend point‑of‑sale, weather, seasonal, and event data to predict near‑term demand lift by area. Anticipate spikes and allocate stock more accurately.

Share‑of‑shelf & compliance

Map image‑recognition or audit findings to detect shelf gaps, pricing errors, and planogram violations. Target repeat offenders to improve execution discipline.

Sustainability & ESG

Quantify transport emissions, packaging waste, and recovery rates down to H3 grid cells. Support corporate ESG reporting and identify hotspots for improvement.

Category whitespace & innovation mapping

Identify underserved regions, missed product segments, or channel gaps. Prioritise new product launches and category expansion where growth potential is highest.
Customer Success Stories

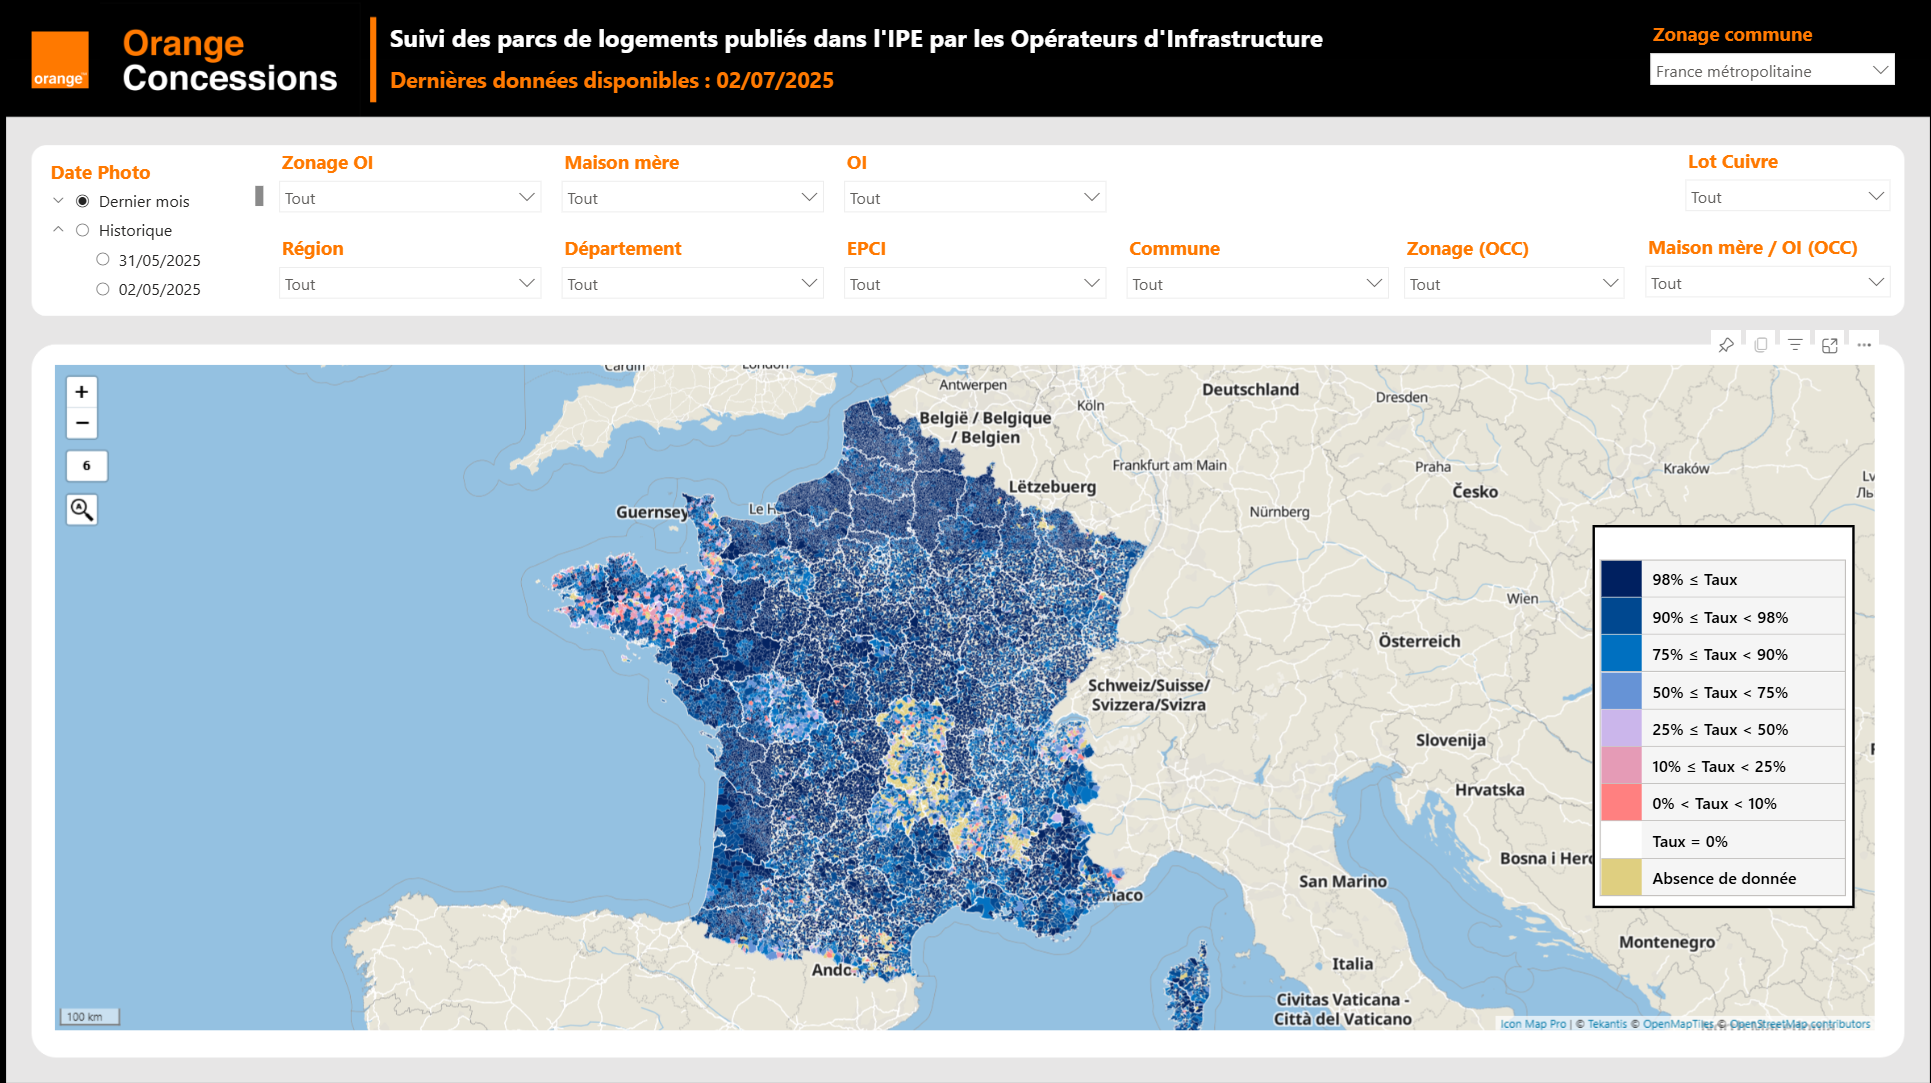
Orange Concessions case study screenshot

Orange Concessions, Fibre Deployment and Commercialisation

Orange Concessions, France’s leading rural fibre operator, accelerated deployment, improved commercial targeting, and is targeting a single trusted platform for fibre operations using Icon Map Pro.

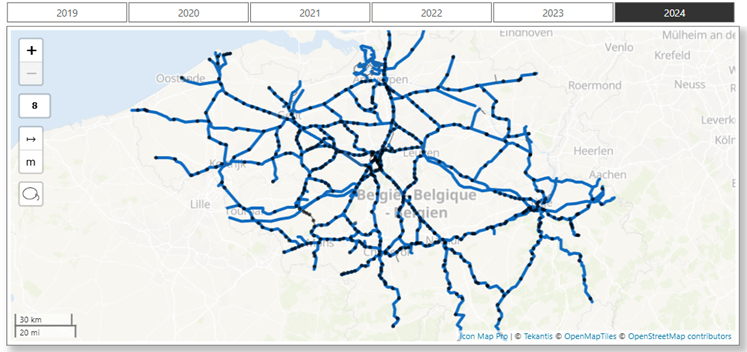
SNCB case study screenshot

Transforming Rail Safety: The Power of Location Intelligence in Action at SNCB

Safety is a cornerstone of SNCB’s operational strategy. As Belgium’s national railway operator, SNCB places significant emphasis on the safety and security of both passengers and staff.