Why Icon Map for Property, Construction & Engineering?

Icon Map unlocks location-aware insight directly inside Power BI or Microsoft Fabric, turning routine construction and engineering data into actionable intelligence for efficient delivery, safer sites, and sustainable infrastructure.

Project Delivery & Site Operations

Harness live, map-based insight inside Power BI and Microsoft Fabric to keep complex schemes on time, on budget, and safe.

Site-progress & schedule compliance mapping

Overlay 4D-BIM states on live site data, spot slippage early, and protect the critical path.

Health, safety & incident hotspots

Visualise accidents, near-misses, and safety inspections, directing mitigation to high-risk zones.

Plant, fleet & material tracking

Integrate GPS telematics, RFID tags, and delivery manifests to display real-time positions of cranes, MEWPs, lorries, and high-value materials across multiple sites, cutting idle waiting, preventing theft, and providing accurate cost allocation.

Traffic, logistics & access management

Combine GPS feeds with haul-route maps to optimise deliveries and evidence Construction Logistics Plans.

Quality assurance & snagging visualisation

Plot defects, inspections, and sign-offs on interactive plans, accelerating close-out and hand-over.

Environmental monitoring dashboards

Map noise, dust, vibration, and air-quality sensors against consent thresholds for rapid intervention.
Asset Portfolio & Strategic Planning

Turn disparate asset, risk, and sustainability data into intuitive maps that drive smarter investment decisions.

Asset condition & maintenance mapping

Display inspection grades and defect density to prioritise interventions and forecast life-cycle cost.

Carbon & sustainability dashboards

Track embodied and operational carbon by project, asset, or geography, supporting PAS 2080 reporting.

Stakeholder & planning engagement

Present alignments, impact zones, and land-take visually for clearer consultation and smoother approvals.

Risk & constraint mapping

Combine geotechnical, flood, utilities, and land-ownership layers to de-risk early-stage design.

Portfolio performance & pipeline view

Map current schemes, future opportunities, and KPIs to balance workload, resources, and revenue.

Climate resilience & adaptation modelling

Overlay future climate scenarios to prioritise upgrades and safeguard long-term asset performance.

Customer Success Stories

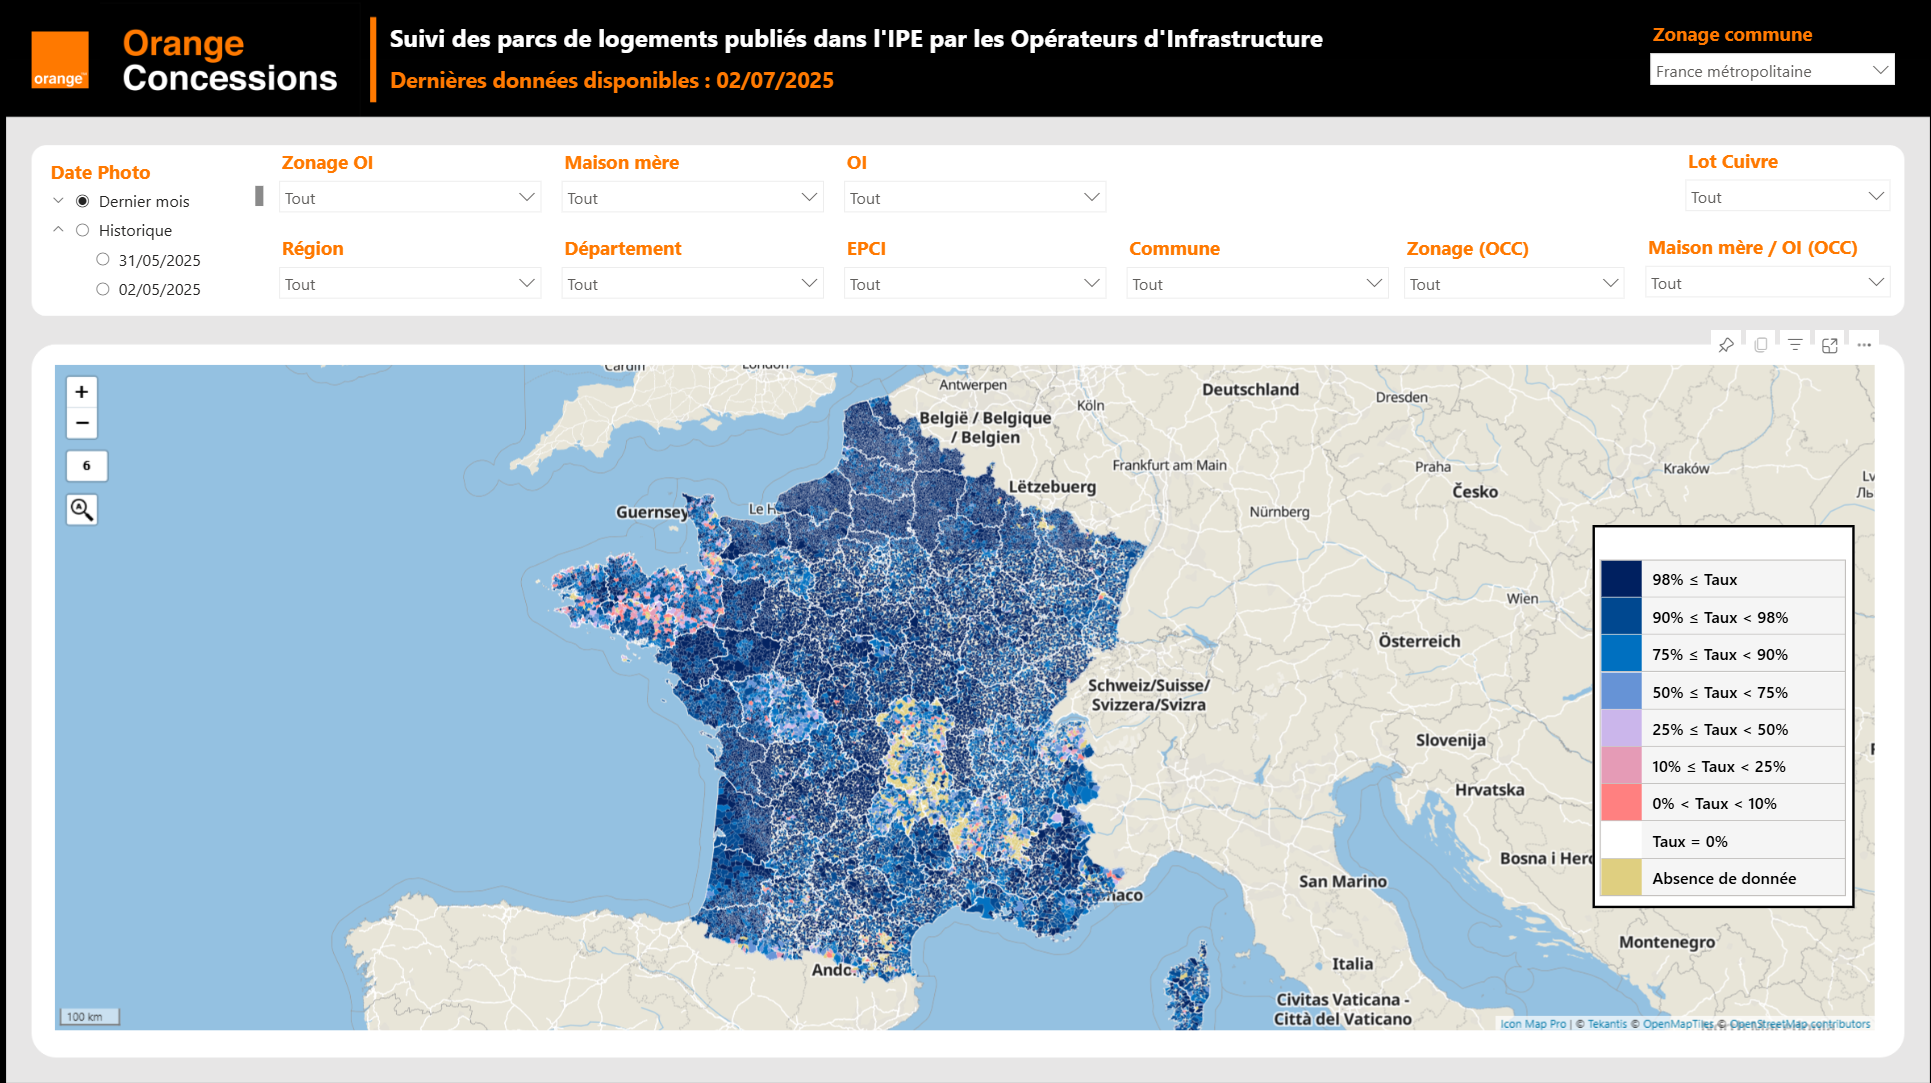
Orange Concessions case study screenshot

Orange Concessions, Fibre Deployment and Commercialisation

Orange Concessions, France’s leading rural fibre operator, accelerated deployment, improved commercial targeting, and is targeting a single trusted platform for fibre operations using Icon Map Pro.

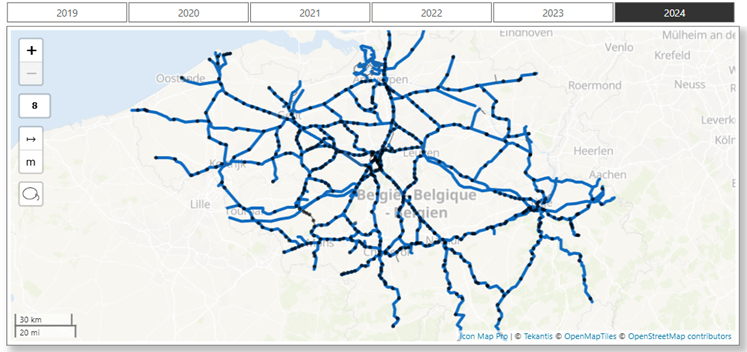
SNCB case study screenshot

Transforming Rail Safety: The Power of Location Intelligence in Action at SNCB

Safety is a cornerstone of SNCB’s operational strategy. As Belgium’s national railway operator, SNCB places significant emphasis on the safety and security of both passengers and staff.