

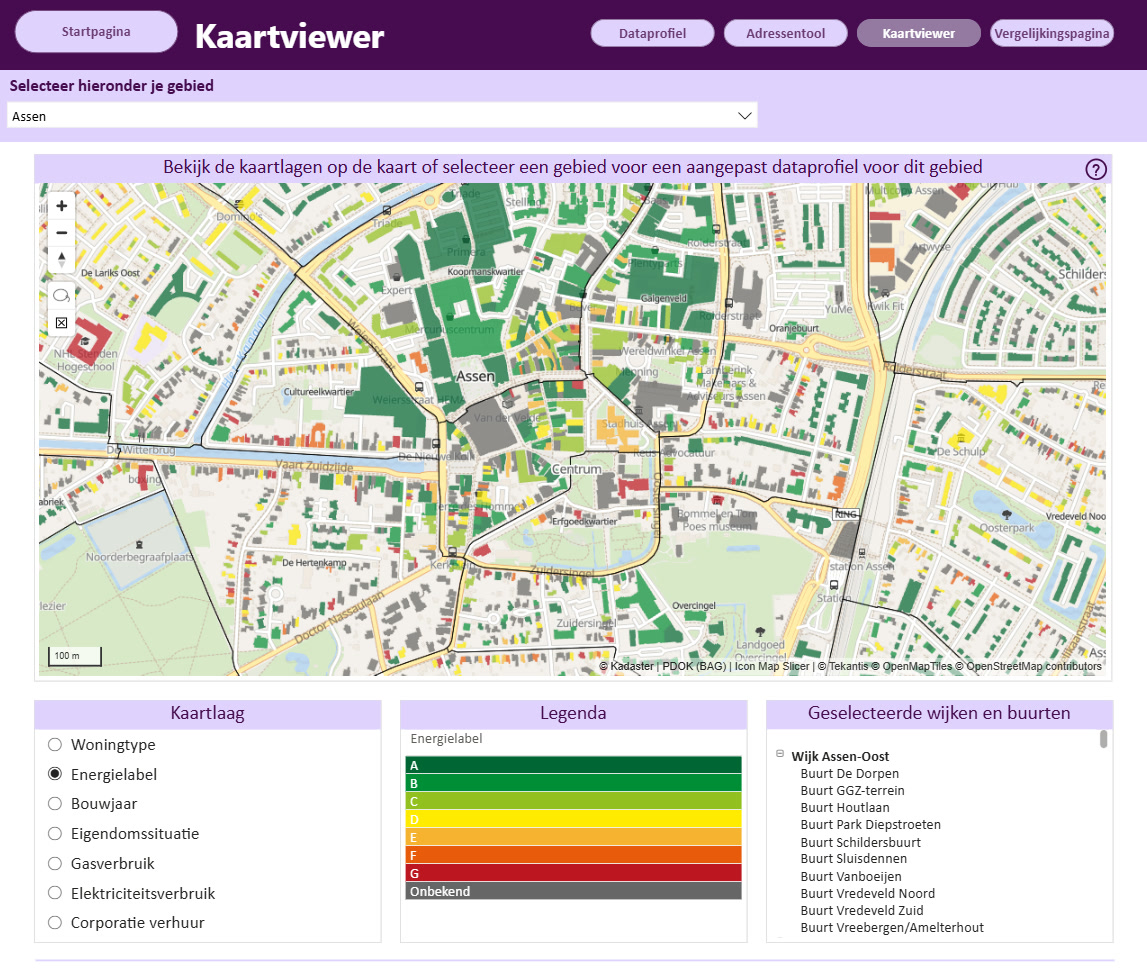
Turning Every Building in Drenthe Into a Filterable Energy Map
For the Province of Drenthe, seeing energy data building by building opens up a much clearer picture of what is happening on the ground.

Icon Map unlocks location-aware insight directly inside Power BI or Microsoft Fabric, turning routine NHS data into actionable intelligence for safer, leaner, and more equitable care.
Leverage advanced geospatial visualization to streamline clinical operations, shorten waiting times, and proactively manage hospital environments. Real-time and historic spatial analytics will enhance patient safety, bed availability, and service responsiveness.
Visualize live ambulance handovers and emergency-department arrivals to manage congestion, staffing, and four-hour breaches.
Monitor real-time bed status across sites, accelerate admissions and discharge planning, and reduce out-of-area placements.
Map operating theaters, imaging suites, and equipment availability to maximize throughput and cut cancellations.
Detect spatial clusters of HCAIs, target cleaning teams, and contain outbreaks swiftly.
Track maintenance tasks and medical-equipment faults spatially, minimizing downtime and improving compliance.
Monitor energy consumption and waste streams across estates, supporting NHS Net Zero and ESG objectives.
Real Icon Map renders of three healthcare questions - response coverage, access to care, and patient flows - built from plain tables. Everything runs client-side in Power BI or Microsoft Fabric: patient-level locations are among the most sensitive data an organization holds, and with Icon Map they never leave your tenant - no geocoding or routing API in the path.


The same machinery drives estates planning, community-team territories, and deprivation-vs-outcome analysis. Icon Map for Microsoft Fabric is in private preview - join the wait list to run these analyses on your own data.Icon Map for Microsoft Fabric is generally available - start a free 30-day trial from inside Fabric or buy a plan to run these analyses on your own data. The same map, chart, and cross-filter machinery is available today in Icon Map Pro for Power BI.
All locations and incidents are synthetic; the drive-time, aggregation, and rendering engines are the shipped product.
Combine demographic, epidemiological, and operational data in spatial context to inform equitable service provision, optimize resource allocation, and improve long-term health outcomes.
Map population characteristics, deprivation indices, and long-term-condition prevalence to target resources where need is highest.
Assess drive-time and public-transport access to A&E, GP, pharmacy, and community services, highlighting geographic care gaps.
Visualize coverage for immunization, cancer screening, and health checks to focus outreach and reduce inequalities.
Track patient journeys between primary, secondary, and tertiary care to expose bottlenecks and improve pathway design.
Overlay historic demand patterns with population forecasts to plan beds, staffing, and supplies for seasonal or pandemic surges.
Map neighboring trusts, private hospitals, and community partners to inform commissioning, collaboration, and risk mitigation.
For more information on HIPAA and NHS compliance, data protection, and how Icon Map fits healthcare governance, see our Healthcare Compliance documentation.
Our customer success stories
For the Province of Drenthe, seeing energy data building by building opens up a much clearer picture of what is happening on the ground.

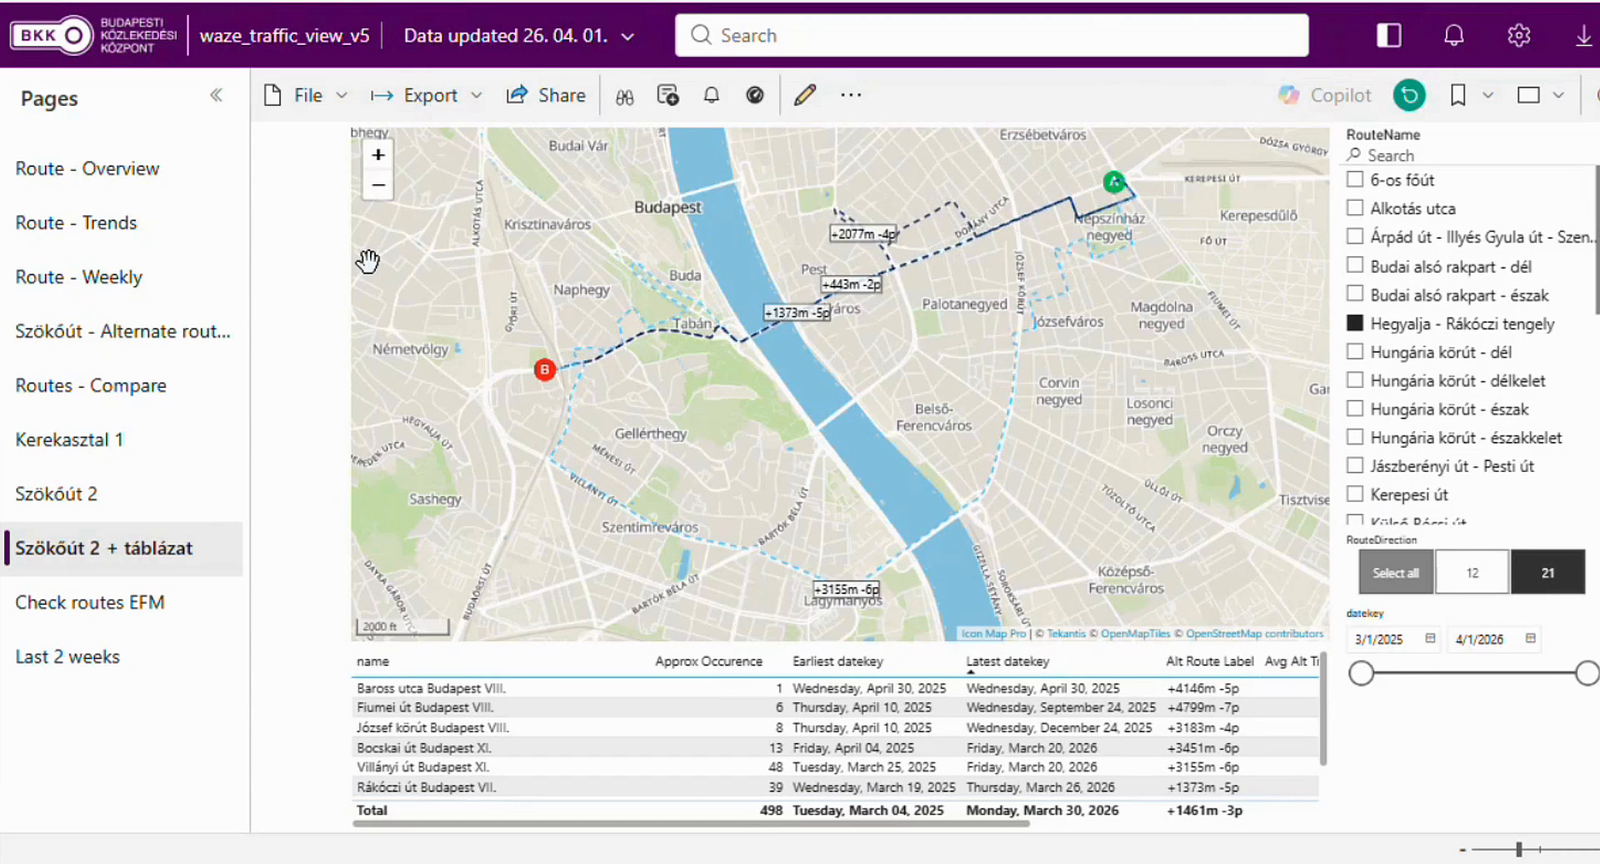
BKK, the Centre for Budapest Transport, is the organization behind the trams, buses and trolleybuses that move people around Hungary's capital, and its remit reaches well past the vehicles themselves. It also coordinates the city's shared bikes and e-scooters…

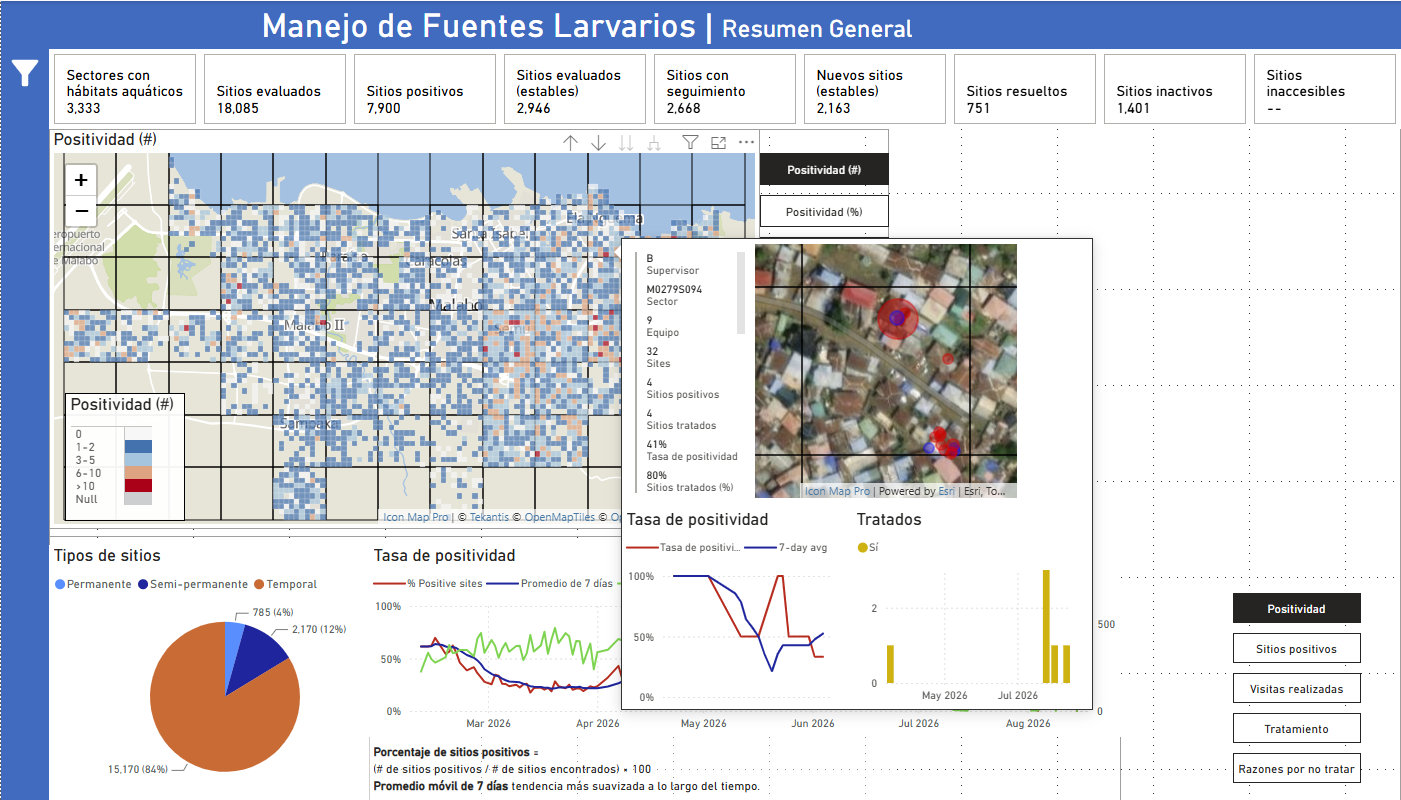
MCD Global Health is a public health nonprofit headquartered in Maine, working across more than 50 countries to design and implement health programmes that genuinely change lives. Their international work spans malaria, cervical cancer, health systems strengt…
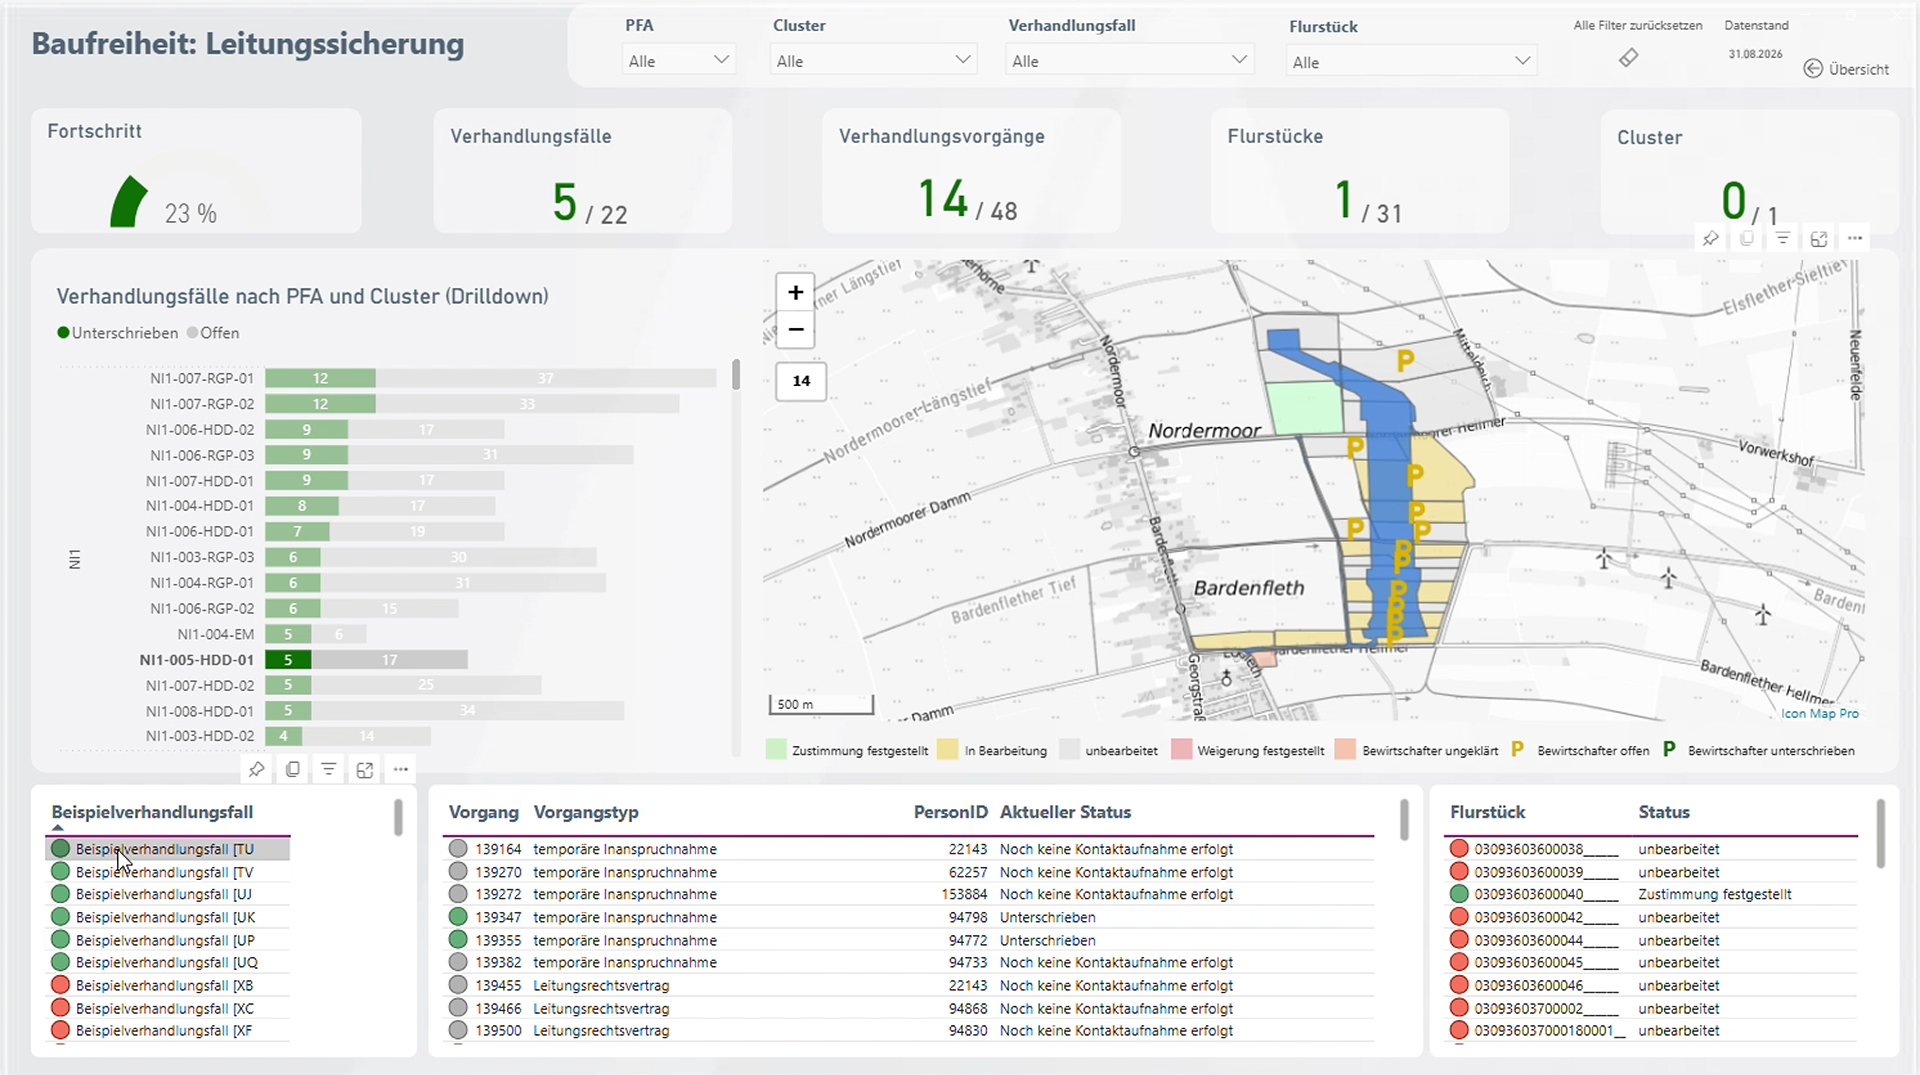
Amprion is one of Germany’s four transmission system operators, responsible for operating and expanding a critical part of Germany’s high-voltage electricity grid. Among its major infrastructure programmes is the Rhein-Main-Link, a planned underground HVDC c…

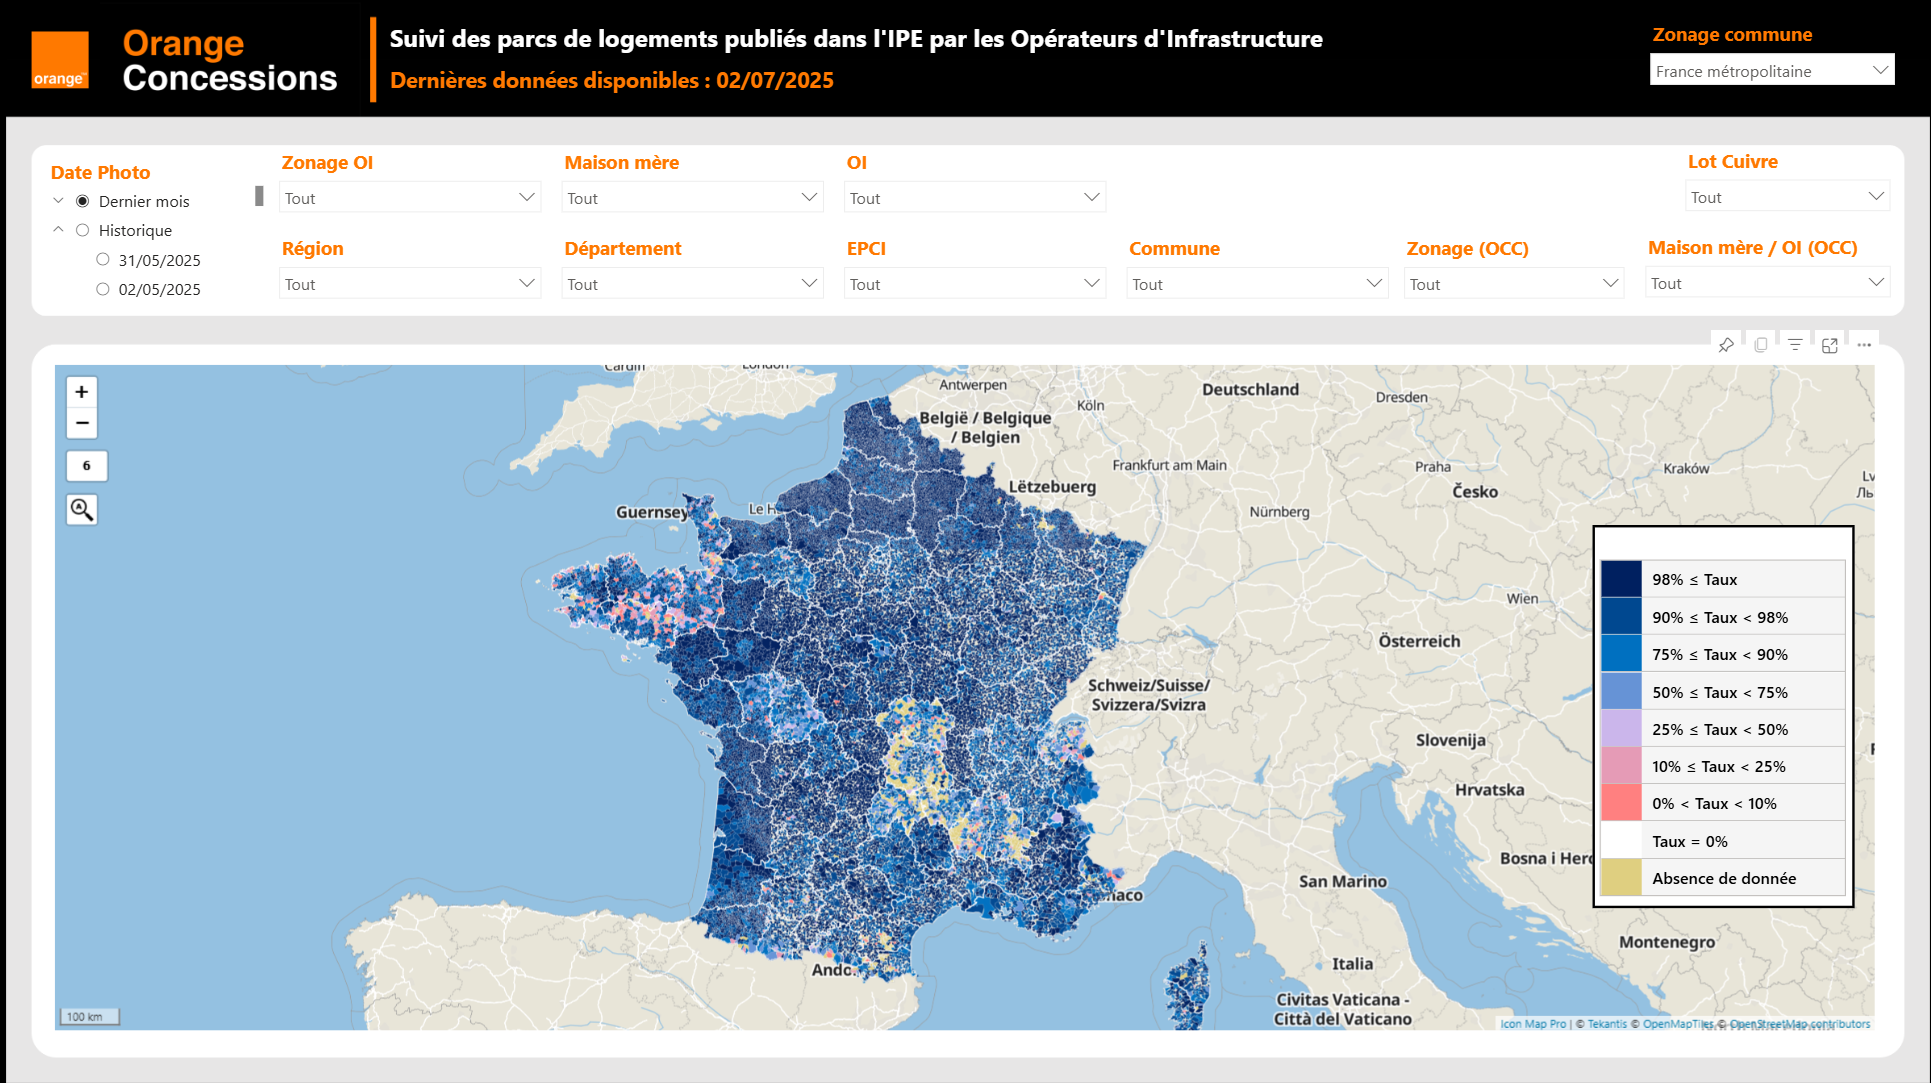
Orange Concessions is the leading public-private fiber network operator in rural France. Through long-term public service delegation contracts, it manages a rapidly expanding network infrastructure designed to bring high-speed broadband access to underserved…

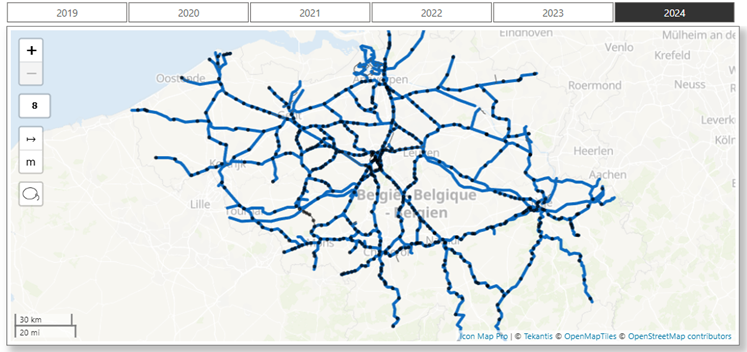
Safety is a cornerstone of SNCB’s operational strategy. As Belgium’s national railway operator, SNCB places significant emphasis on the safety and security of both passengers and staff. CEO Sophie Dutordoir recently stated that all employees' work "deserves r…