

It went from almost impossible to include all requirements and still be quick, to having everything and a quick dashboard.
Drenthe is one of the twelve provinces of the Netherlands, sitting between national government and local municipalities on matters including nature management, spatial planning, certain road maintenance and environmental protection. Its dedicated Datateam brings together data governance, data management, illustration, data engineering and data analysis, with colleagues working across Power BI and GIS.
When the team was asked to build an advanced building map for the municipalities in Drenthe, they knew exactly what they wanted. Every building surface in Drenthe needed to be visible, users needed to be able to switch between different datasets, and selections on the map needed to filter the rest of the dashboard. The challenge was finding a way to make all of that work together while keeping the experience quick and easy to use.
The Challenge
The team started with Azure Maps, the standard mapping option available within Power BI. It could handle the basics, but the more specific requirements called for a different approach, particularly the level of building detail and the way the map needed to interact with the rest of the dashboard.
The aim was to give the municipalities a map that worked as part of the analysis, rather than sitting separately from it. Users needed to be able to explore different datasets, select buildings on the map and see the rest of the dashboard respond.
The Solution
A colleague introduced Liza to Icon Map, and she began testing the free version, which quickly opened up possibilities Azure Maps hadn't. While the team was testing it, Icon Map released the Icon Map Slicer alongside its Catalog function, including a ready-made dataset of Dutch building surfaces. Combining the Slicer with the Catalog data gave the team a way to build the interactive map they had envisioned, without changing the brief to fit the technology.
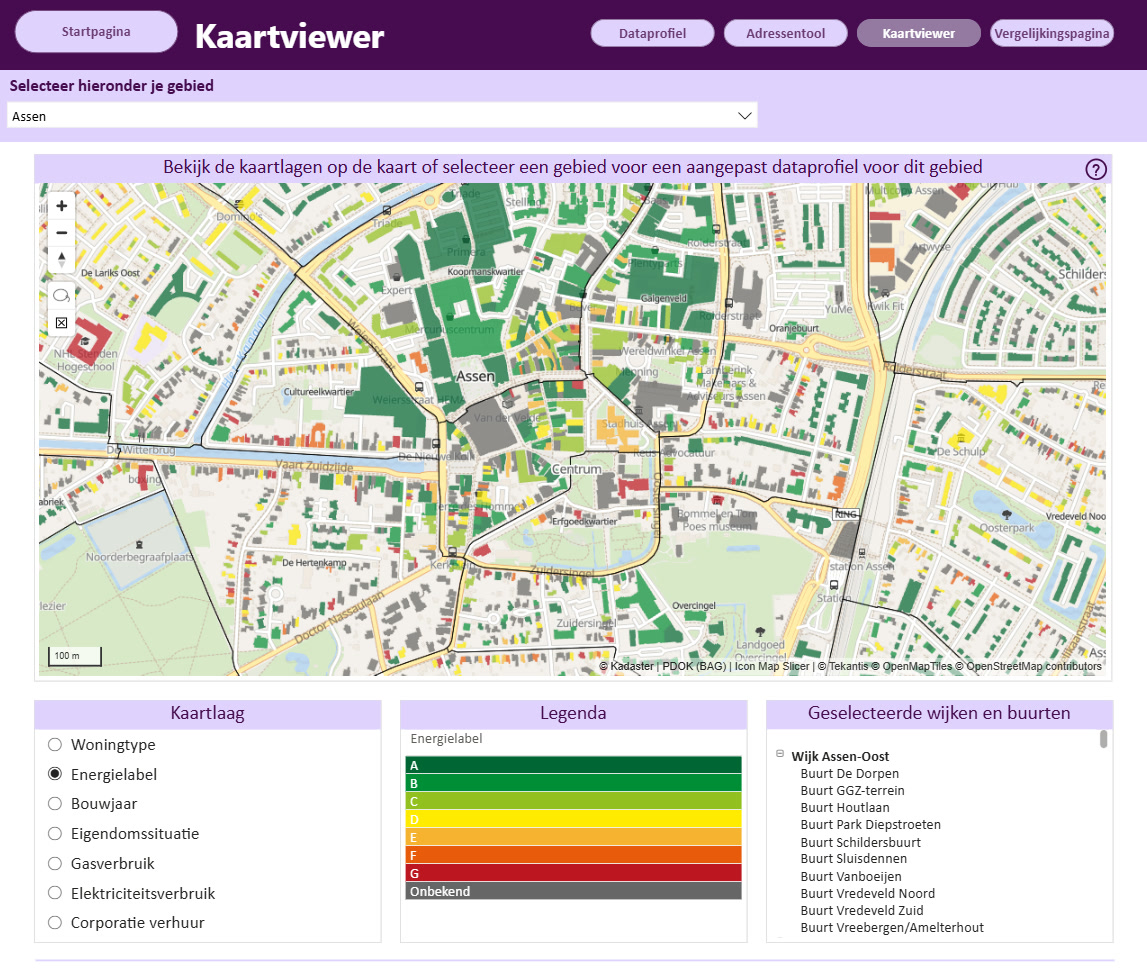
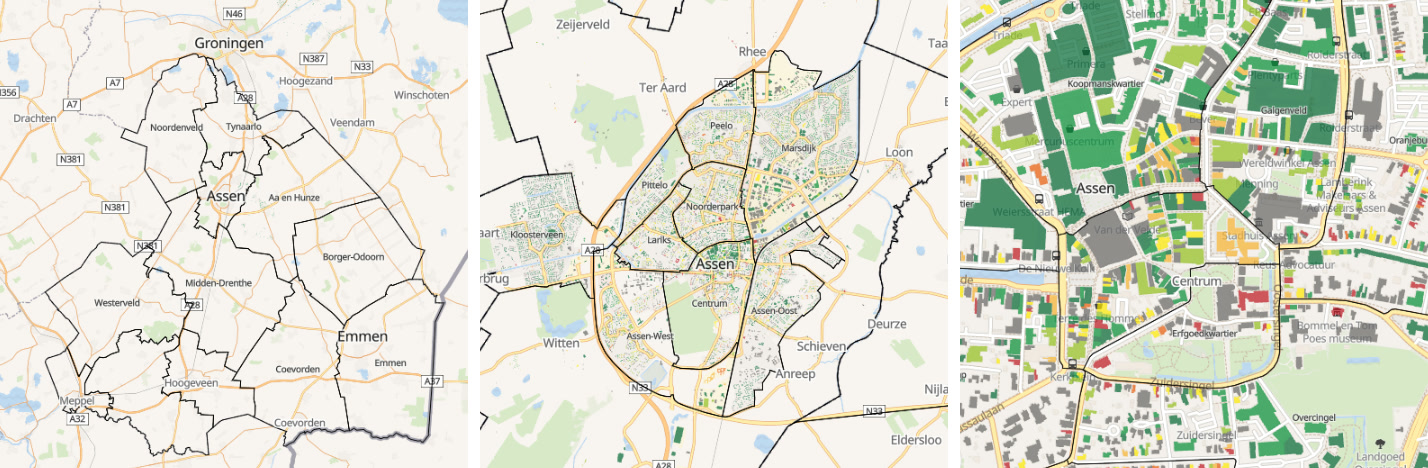
The finished map opens with the outline of Drenthe's municipalities, and zooming in reveals district and neighborhood boundaries before the individual building surfaces come into view. Users can color those buildings by building type, energy performance, year of construction, ownership situation, average gas usage or average electricity usage.
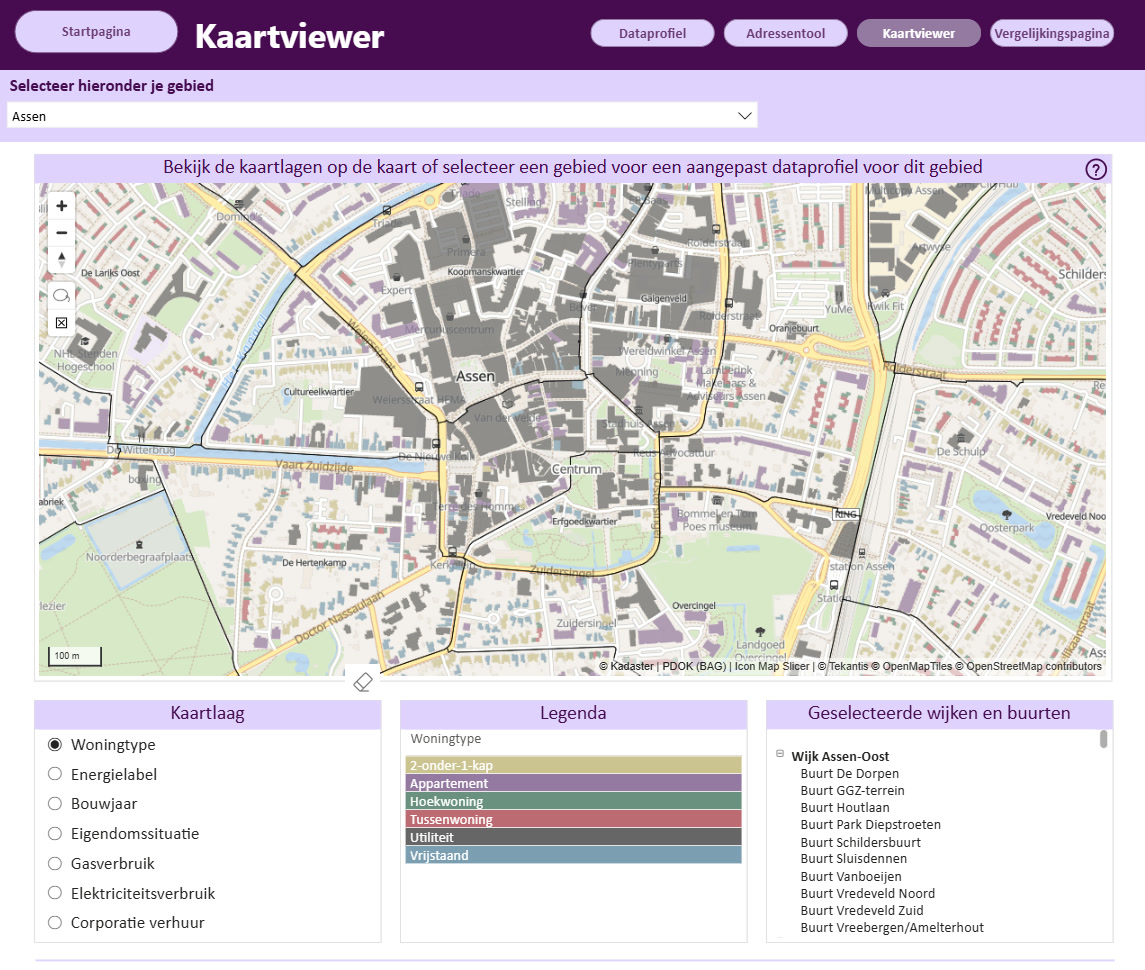
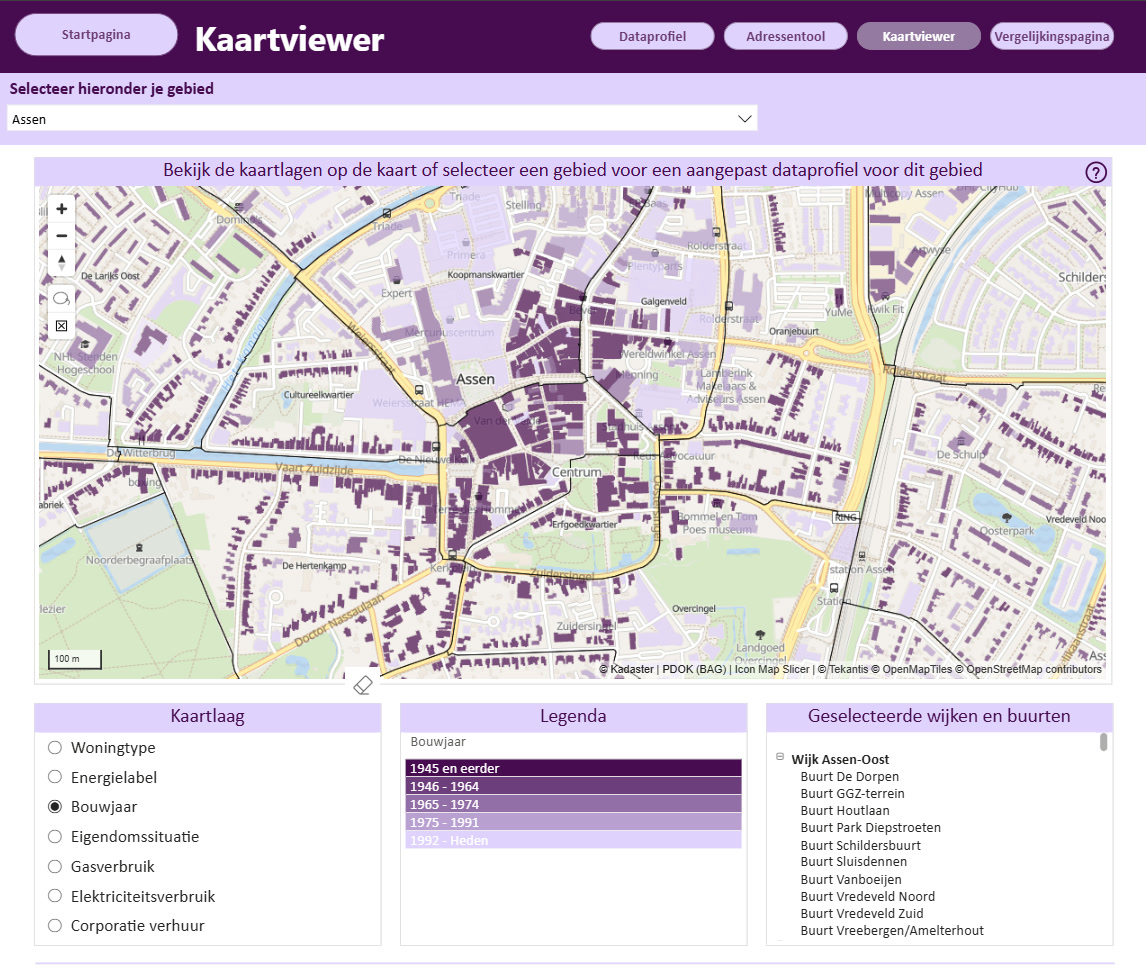
The lasso tool then lets them select a group of buildings directly on the map, with the charts beneath it updating instantly to show the data for that selection, so the map works less like a static picture and more like something you can actually dig into.
The Result
The finished product is Drents Dataplatform Energie, a live platform now available to local municipalities across Drenthe.
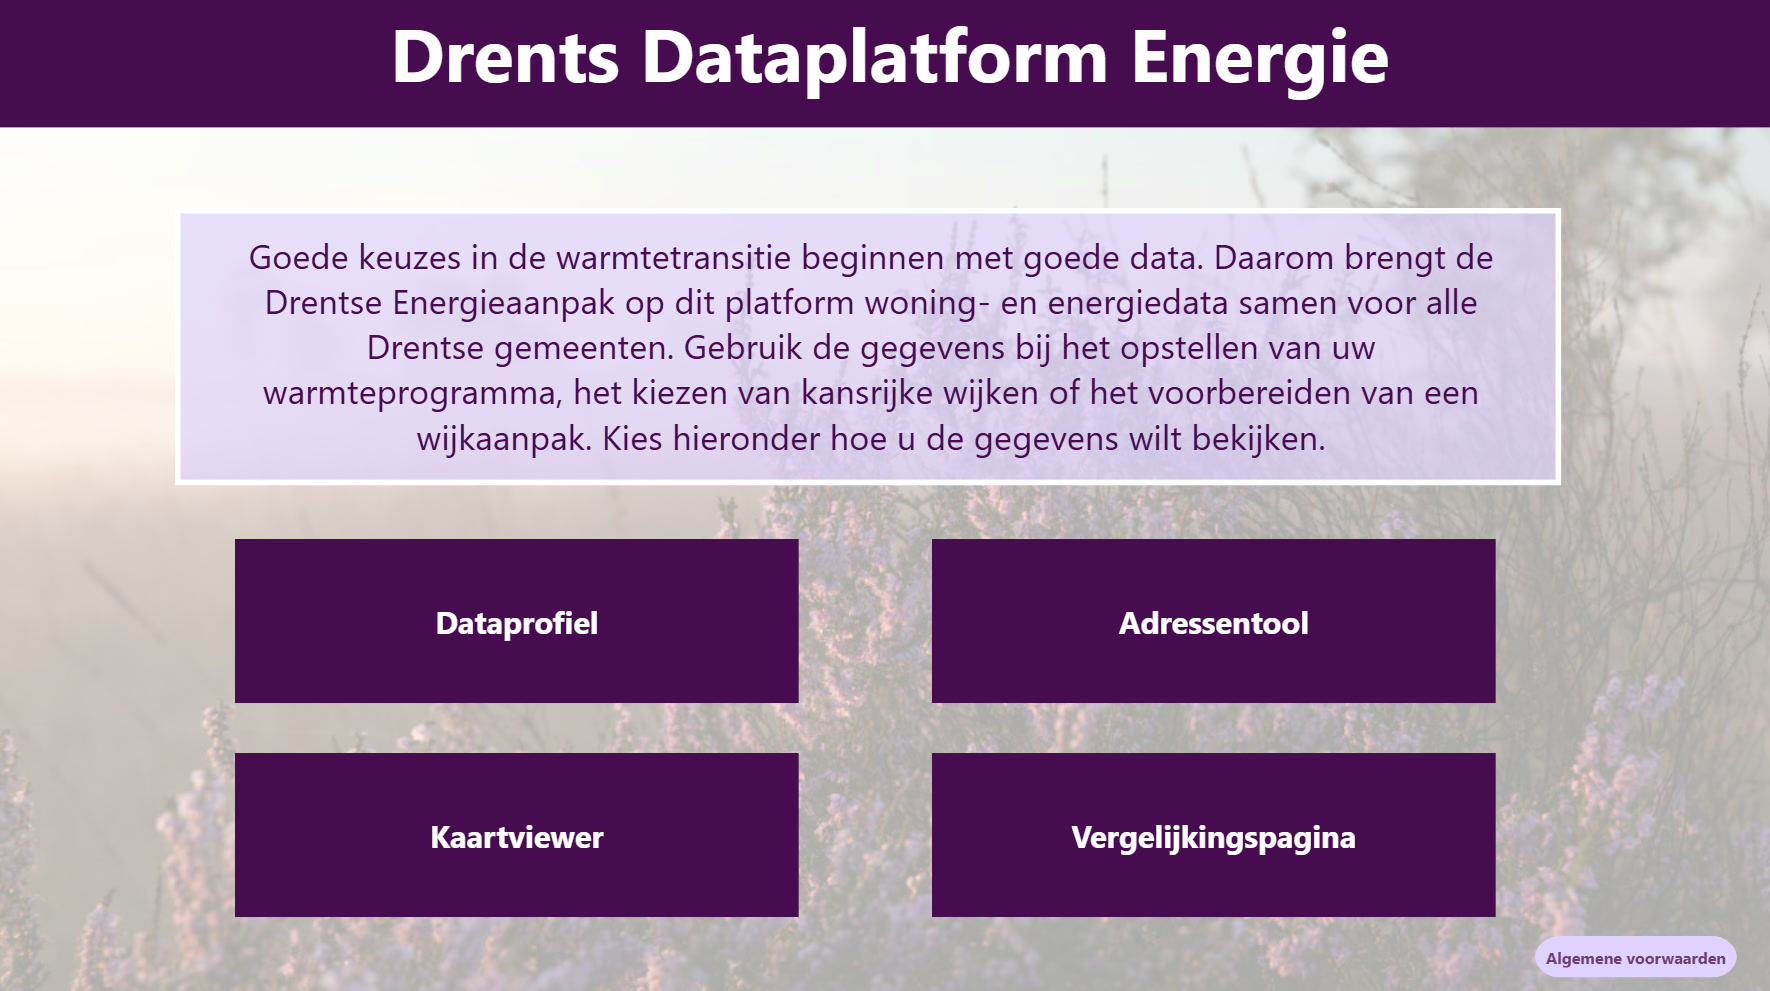
Municipalities can use it to build a data profile for a neighborhood, district, or municipality; identify groups of addresses that match particular criteria; explore the building map; and compare different areas.
Bringing all of those views together gives the municipalities a much more flexible way to work with the data. Users can move from a whole municipality to a specific group of buildings and immediately see how the data changes.
The timing helped too. Icon Map's Slicer and Catalogue features became available just as the Datateam was finishing the assignment, giving them exactly what they needed to bring the brief together.
What's Next
Azure Maps remains the Datateam's starting point for straightforward maps and shapefiles. Icon Map comes into its own when a project calls for something more tailored, as it did here, and the team has more of its functionality they would like to explore, with the broader goal of bringing far more extensive mapping into future Power BI dashboards.
For Icon Map, one of the most rewarding parts of a project like this is understanding what a client actually needs and building toward it, rather than expecting them to adapt to the tool. In Drenthe, that approach has produced a map that does much more than show where buildings are. It gives municipalities a new way to explore what is happening across them, right down to individual buildings.