A mine is a moving, three-dimensional operation. Icon Map puts every truck, shovel, drill hole and monitoring point on one map over the real 3D terrain, inside the Power BI reports and Microsoft Fabric workspaces your teams already use.
Bingham Canyon, Utah · imagery: USGS / NAIP · elevation: USGS 3DEP 1 m · both from the Icon Map Catalog
From pit to port
One map for the whole operation
Fleet telemetry, dispatch, drilling, geology, survey, environmental monitoring and safety systems all describe the same piece of ground. Icon Map brings them together on a single interactive map, so control rooms, engineers and executives see the operation the way it really is: in place, in 3D and in real time.
Build mine reports over 3D terrain in Power BI with Icon Map Pro, or stream a live fleet in 3D with Icon Map for Microsoft Fabric. Either way it lives next to your production reports, with no separate GIS platform to buy, run or train for.
Live fleet in 3DIn Icon Map for Fabric, trucks, shovels and drills appear as true-scale 3D models on the terrain, moving as the telemetry arrives.
Safety you can seeExclusion zones, blast clearances and incidents drawn where they happen, beside the vehicles and people they affect.
Real terrain and imagery3D terrain and aerial imagery from the Icon Map Catalog, ready to drape your data over, in Power BI and in Fabric.
Wired into your reportsClick a truck, a zone or a drill hole and every chart, table and KPI on the page follows.
Live haul operations · Icon Map for Fabric
Every truck, every cycle, live in 3D
A haul fleet working Bingham Canyon, the deepest open pit on Earth: trucks queue and load at the shovels at the bottom, climb over 500 m up the ramp loaded, dump at the crusher and return empty, on a two-lane haul road with a safe headway. Drag to orbit, hover a truck for its telemetry, click an alert to fly to it, and clear the pit wall for blasting.
In Icon Map for Microsoft Fabric this map is fed by real telemetry: an Eventstream takes the trucks' messages, an Eventhouse stores them, and the vehicle layer draws each truck as a 3D model, snapped to the haul road, with a trail and its latest alert. Here the fleet is simulated in your browser using the same haul-cycle model, on a haul road traced from the terrain. Imagery: USGS / NAIP and elevation: USGS 3DEP 1 m LiDAR, both from the Icon Map Catalog.
How it works
From the haul road to the control room in seconds
Stream
Fleet management, dispatch and IoT systems send position and health messages into a Fabric Eventstream, or land them in a Lakehouse on a schedule.
Microsoft Fabric Real-Time Intelligence
Store and shape
An Eventhouse keeps every message and answers KQL queries in milliseconds: latest position per truck, queue lengths, cycle times, alerts by zone.
Icon Map for Fabric draws the live fleet as 3D models over terrain and imagery, with a trail and the latest status for each truck, and cross-filters the charts beside it. In Power BI, Icon Map Pro maps the same data over 3D terrain in your reports.
Icon Map for Fabric · Icon Map Pro for Power BI
Across the mine
Where mining teams use Icon Map
Fleet and haul optimization
Watch queues build at shovels and crushers and compare cycle times by route and shift. In Icon Map for Fabric, replay any shift with the time slider to see where the hours went.
Safety and geofencing
Map exclusion zones, blast clearances and speed zones from your own data, select a zone to see which vehicles and people are inside it, and filter the report to them.
Exploration and geology
Map drill collars, assay grades and resource blocks over terrain and imagery, aggregate samples into hexagons or your own block outlines, and filter by grade, hole or campaign.
Survey and reconciliation
Show survey data over 3D terrain and imagery, and in Icon Map for Fabric bring in 3D tiles, comparing what was planned with what was mined, bench by bench, beside the production numbers.
Water, tailings and environment
Keep piezometers, water quality, dust monitors and tailings instruments on one map with their latest readings, and spot the ones trending toward a limit.
Assets and maintenance
Place conveyors, pumps, substations and workshops on the map with their condition and open work orders, so crews go to the right place with the right parts.
Weather and operating conditions
Add weather layers to plan blasting, dust control and shutdowns around the conditions. Icon Map for Fabric adds live wind, rain and storm-energy data from the global forecast models.
Community and ESG reporting
Show land tenure, rehabilitation progress, community commitments and environmental permits on a map stakeholders can explore for themselves.
Why Choose Icon Map?
Our customer success stories
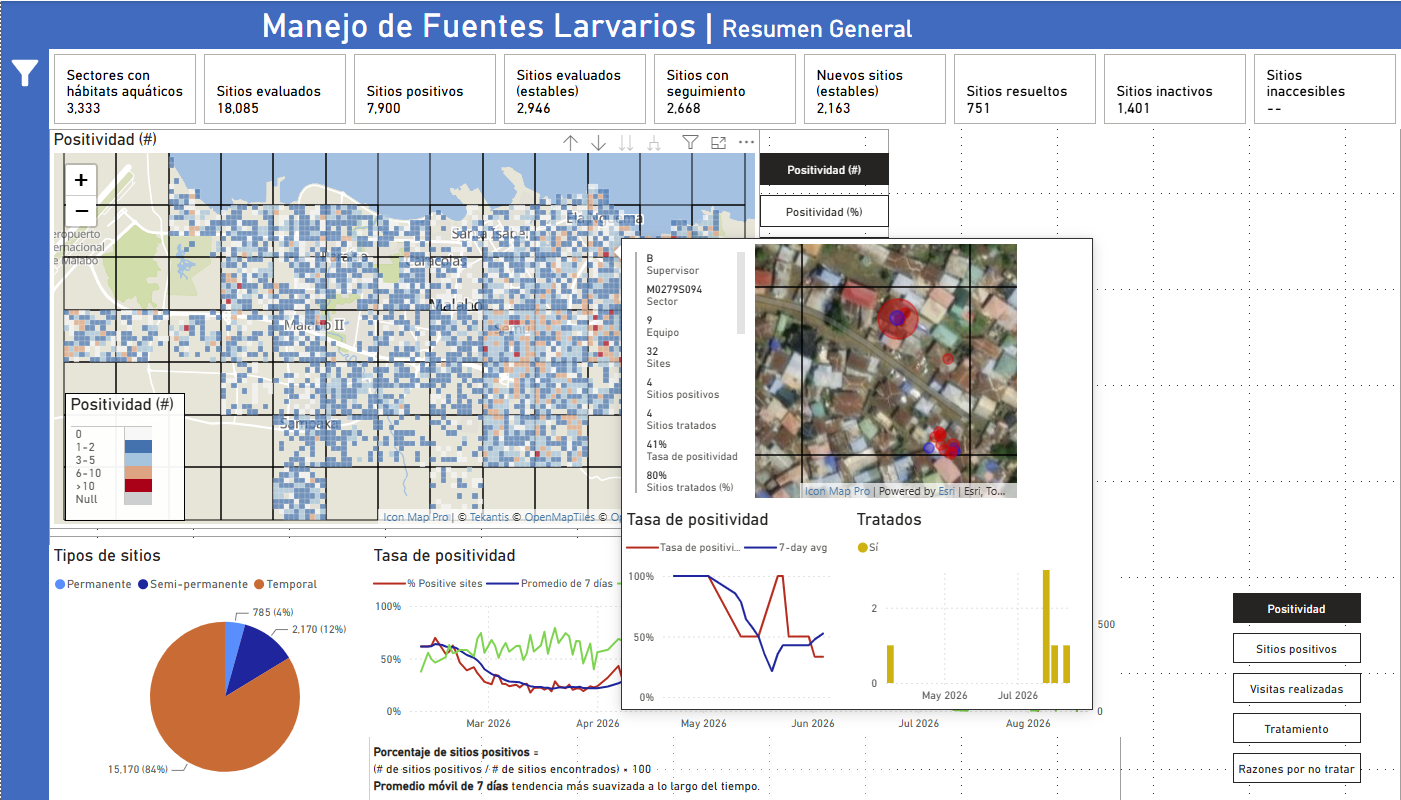
Bringing Malaria Data to Life: How MCD Global Health Uses Icon Map Pro to Power Field Decisions in Equatorial Guinea
MCD Global Health is a public health nonprofit headquartered in Maine, working across more than 50 countries to design and implement health programmes that genuinely change lives. Their international work spans malaria, cervical cancer, health systems strengt…
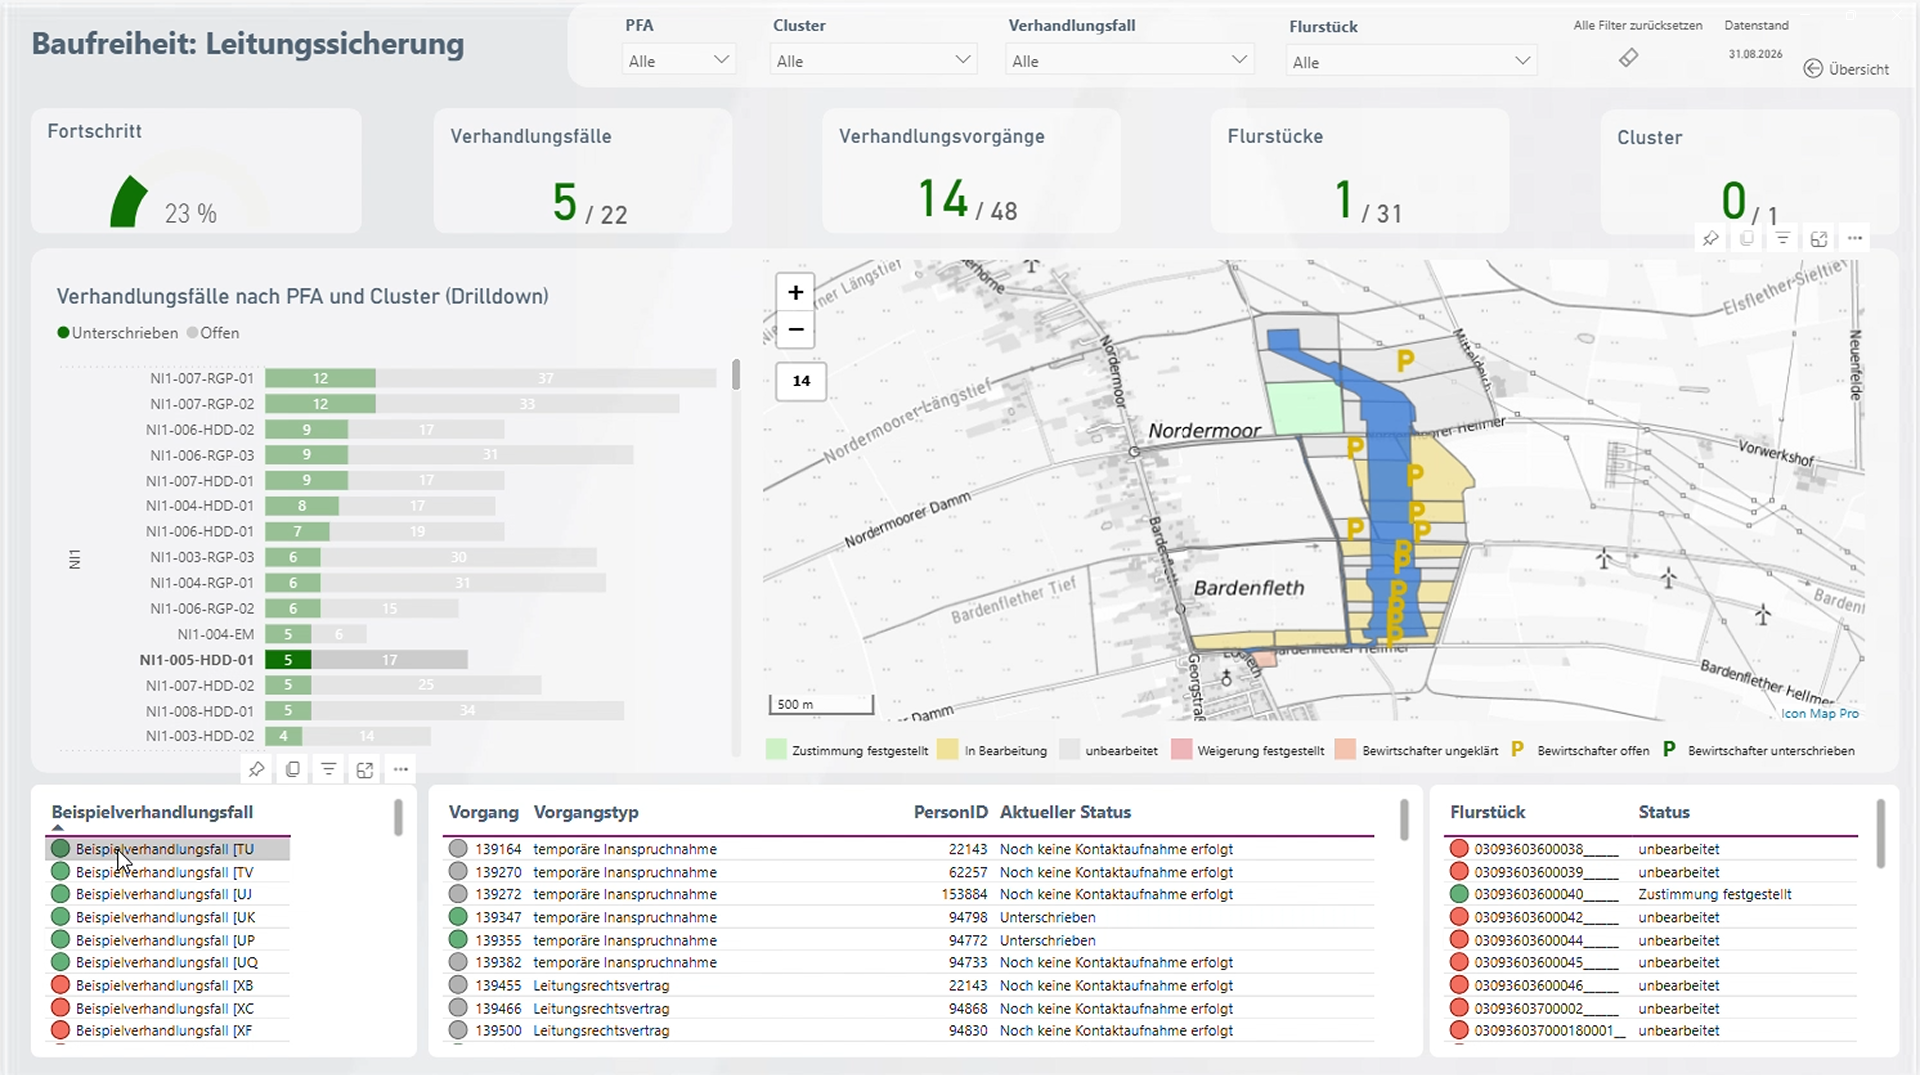
Amprion: Bringing Large-Scale Transmission Infrastructure onto a Single Map
Amprion is one of Germany’s four transmission system operators, responsible for operating and expanding a critical part of Germany’s high-voltage electricity grid. Among its major infrastructure programmes is the Rhein-Main-Link, a planned underground HVDC c…
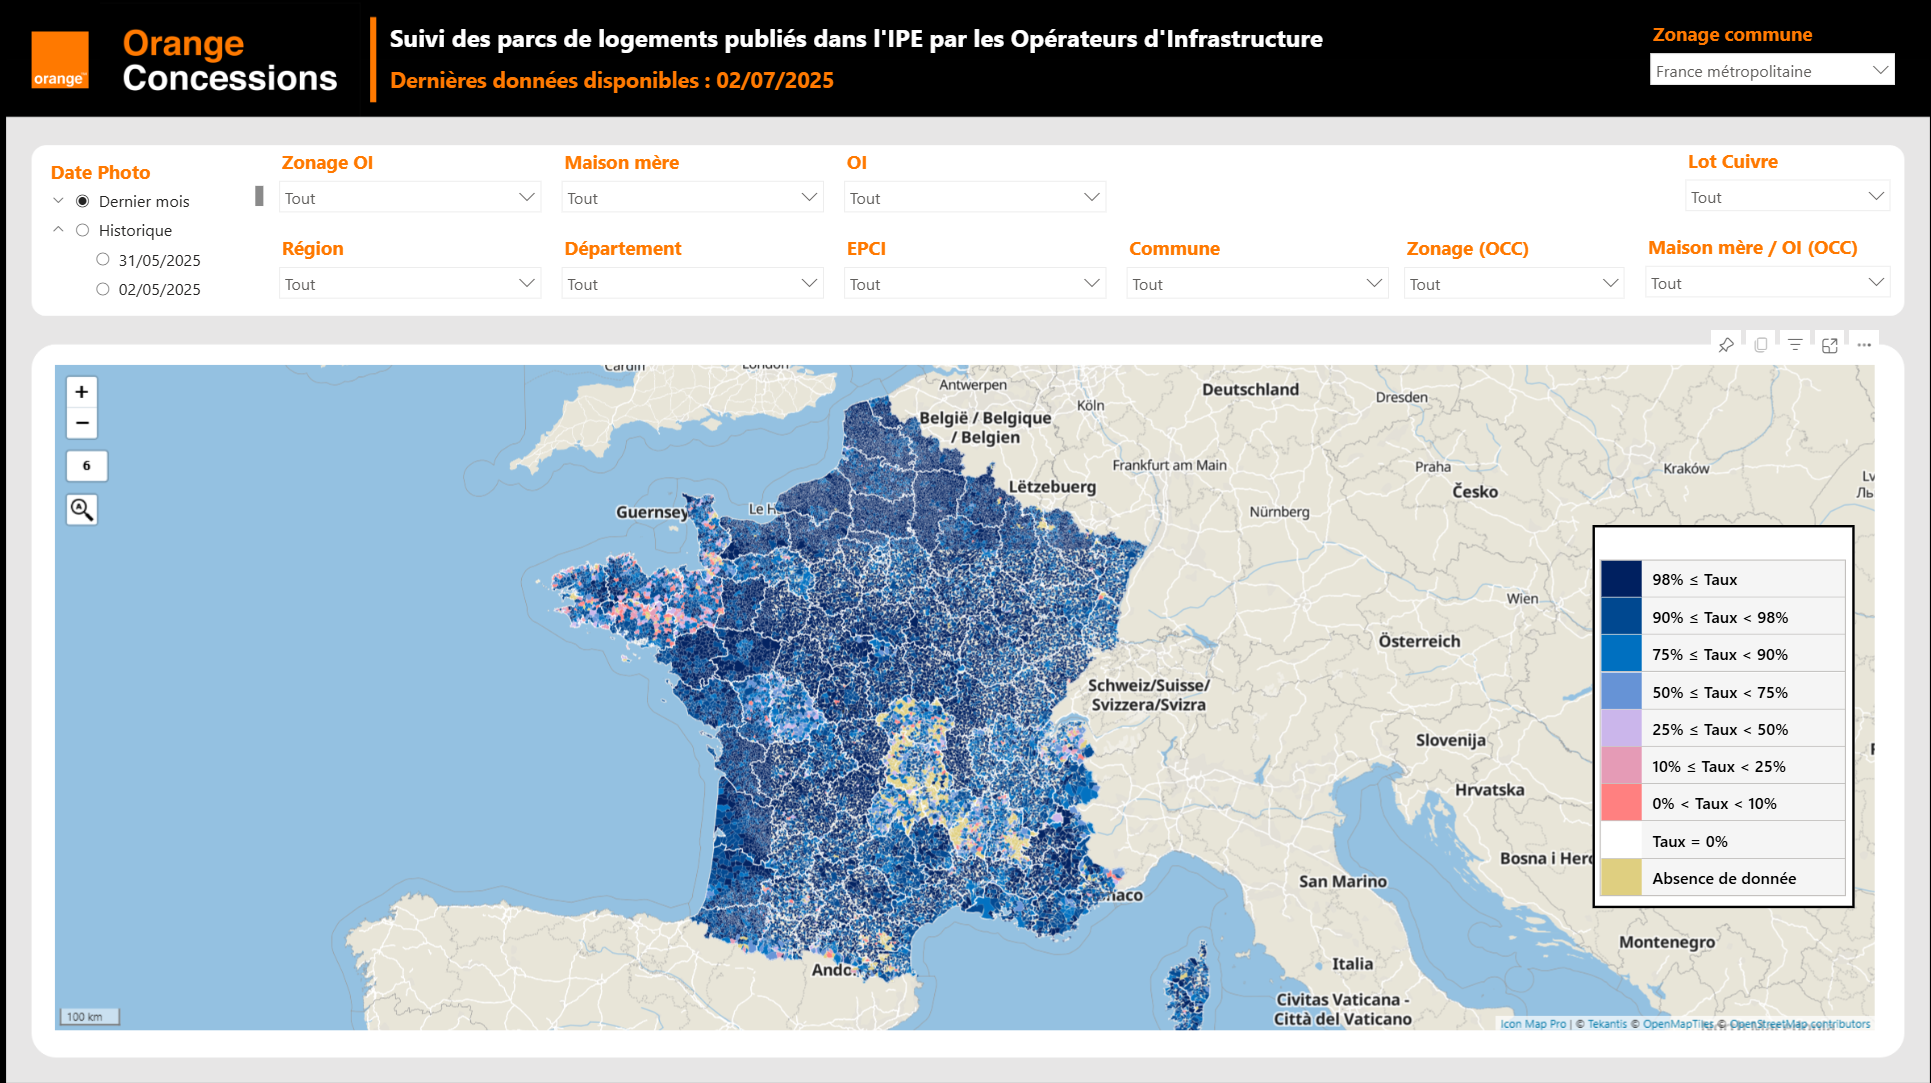
Enhancing Fiber Deployment and Commercialization with Icon Map Pro at Orange Concessions
Orange Concessions is the leading public-private fiber network operator in rural France. Through long-term public service delegation contracts, it manages a rapidly expanding network infrastructure designed to bring high-speed broadband access to underserved…
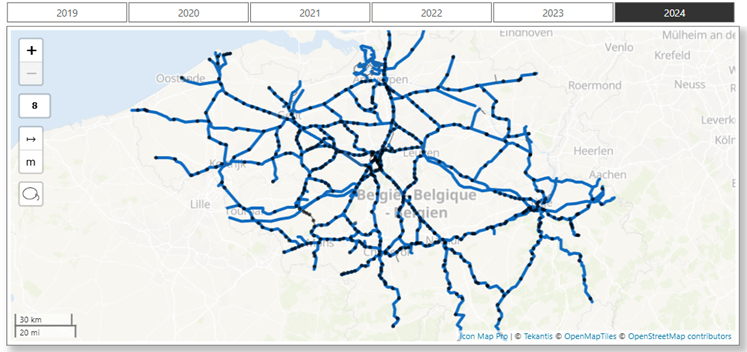
Transforming Rail Safety: The Power of Location Intelligence in Action at SNCB
Safety is a cornerstone of SNCB’s operational strategy. As Belgium’s national railway operator, SNCB places significant emphasis on the safety and security of both passengers and staff. CEO Sophie Dutordoir recently stated that all employees' work "deserves r…
Optimizing Christmas Eve: How Santa Uses Icon Map to Put Every Child on the Map
North Pole Logistics is the exclusive global operator responsible for delivering presents to children who celebrate Christmas. Operating from a single distribution center at the North Pole, the organization must reach more than 900 million homes in one extend…
Icon Map for Microsoft Fabric is in private preview: join the wait list to stream your own fleet into a live map.Start a free 30-day trial of Icon Map for Microsoft Fabric from inside Fabric, and stream your own fleet into a live map. Or build mining reports in Power BI today with Icon Map Pro.
ShovelsCrusherStateSpeedAlertNo active alertsClear the pit wall for blastingBlast zone active - tap to stand down{n} waiting at its edge{n} leaving the blast zoneLoadingHauling loadedDumpingReturning emptyQueuing at the shovelsQueuing at the crusherThis live map could not load. Please check your connection and refresh the page.