
Connecting Project Data with Geography
Large-scale transmission projects bring together technical, commercial, construction and geospatial information. Amprion introduced Icon Map within Power BI to integrate complex spatial geometries directly into its reporting environment.
The solution supports multiple spatial layers, including transmission corridors, construction sections, land parcels and individual project objects. Users can move seamlessly from portfolio and project-level views down to individual geographic objects.
Because Icon Map operates within Power BI, capabilities such as cross-filtering, slicers, drill-downs and dynamic measures can also be applied to geospatial information.
“The real value is the ability to combine information from different domains and make it accessible through one consistent analytical interface.”
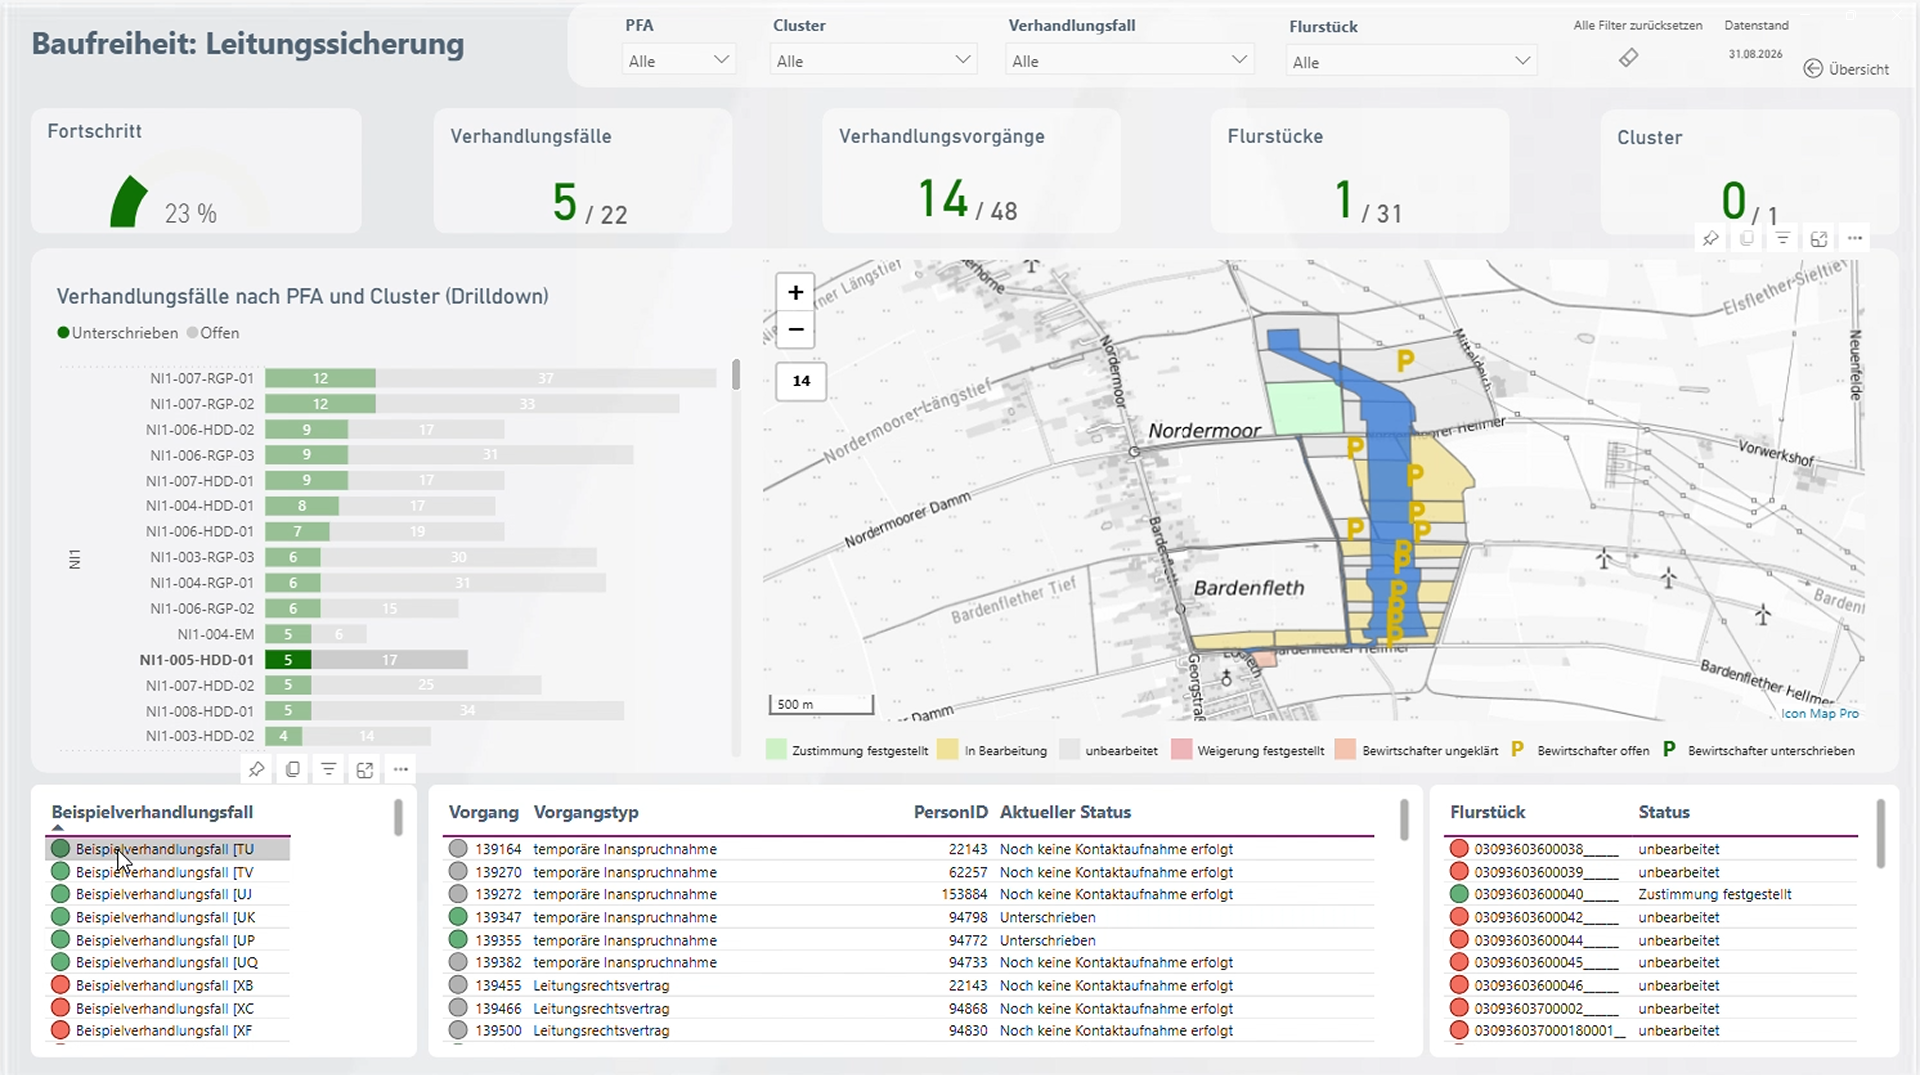
Land Rights: From Corridor View to Individual Parcel
One particularly important use case is land-rights management.
For major transmission projects, thousands of individual land parcels can be relevant along a corridor. Within the Power BI reporting environment, each parcel can be connected with information such as ownership-related data, land-rights status, approval status, project section, responsibilities, construction status and relevant milestones.
Users can select an individual parcel directly on the map and immediately access the associated project information. At the same time, filters and KPIs can be used to highlight parcels with a specific land-rights status across an entire project section or transmission corridor.
This creates a direct analytical connection between the geographic location of a parcel and its current project status and enables teams to move from an overall corridor view to individual land-rights cases within the same reporting environment.
Spatial Decision Support
The result is an integrated analytical environment combining: **Geography + Project Status + Land Rights + Operational Data + Management KPIs **
This enables project teams to identify geographic patterns, understand dependencies and access decision-relevant information directly within its spatial context.
Icon Map shows us not only what is happening, but also where it is happening.
By combining project data with its exact geographic context, we can immediately identify where issues, delays or opportunities are located. This allows teams to move from simply reporting a problem to targeting the right area, taking focused action and resolving issues more effectively.
In short, Icon Map turns data into location-based insight — helping us understand, prioritise and steer projects with much greater precision.
Following its adoption across several major infrastructure projects, the TSO is exploring how geospatial analytics can be expanded further within its future data and reporting architecture, including closer integration with Microsoft Fabric, centralised geospatial data products and more advanced spatial analytics.
“Once spatial data becomes part of the analytical architecture, entirely new reporting and decision-support scenarios become possible.”
The long-term objective is to further develop integrated, spatially enabled project intelligence for complex transmission infrastructure programmes.
See another way Amprion uses Icon Map:
Before a land parcel can be approved for construction, the ground conditions need to be assessed. This involves carrying out drilling investigations at specific points across the site to understand what lies beneath the surface.
In this example, Icon Map brings those drilling points to life, making it easy to explore their locations alongside the underlying technical information - helping turn complex ground investigation data into a clearer picture of the site.