Industry solutions · Maritime & ports

Why Icon Map for Maritime and Ports?

Ports and shipping run on where things are: ships on the fairway, at anchor and alongside, cranes and cargo on the quay, a fleet spread across the oceans. Icon Map puts all of it on one live, interactive map, inside the Power BI reports and Microsoft Fabric workspaces you already use.

Every ship around Helsinki, live from Fintraffic's open AIS data (CC BY 4.0) · imagery: City of Helsinki (CC BY 4.0), Copernicus Sentinel-2 · map data © OpenStreetMap contributors, OpenSeaMap, EMODnet · 3D ships in Icon Map for Fabric

Operations you can see

The port and the fleet, as they move

AIS positions, port calls, berth plans, crane and yard telemetry, voyage reports and fuel data already sit in your data platform. Icon Map shows them where they happen, so a harbor master, a terminal planner or a fleet manager sees the water, not a table: who is inbound, which berths are free, how long ships wait at anchor, which voyages are burning the most fuel.

Build port and fleet reports in Power BI with Icon Map Pro, or bring live AIS, 3D ships and playback together in Microsoft Fabric with Icon Map for Fabric. One organization-wide license, no extra GIS software.

  • Live, true-scale 3D shipsEvery vessel as a 3D model sized from its own AIS length and beam, turning on its real heading, in Icon Map for Fabric.
  • AIS and port calls, straight inAIS, port community and terminal systems stream through Eventstream, or sit in OneLake for history and playback.
  • Berths, waits and emissions beside the mapBerth occupancy, waiting time at anchor, turnaround and fuel as measures, filtering with the map in the same report.
  • From one berth to the globeThe same map zooms from a single quay to a world fleet on a 3D globe, with real sea lanes and chokepoints.

Port operations · Helsinki, Finland

A live digital twin of a working port

Every ship around Helsinki, live from AIS: the Tallinn and Stockholm ferries threading the islands past Suomenlinna, Finland's icebreaker fleet at Katajanokka, pilots and tugs, and the container ships at Vuosaari. The berths fill from the port's own port-call data. Zoom in to see each ship in 3D, click one for its voyage and berth, and follow it out to sea.

Connecting - ships - under way --:-- Helsinki

Live data: AIS positions and ship particulars from Fintraffic's Digitraffic Marine service (open data, CC BY 4.0), read every 10 seconds; the map runs about half a minute behind, so every ship moves between two positions it really reported. Port calls and berths: Digitraffic port call data from the Port of Helsinki's port community system. Ships are drawn from their AIS type and dimensions; models and colors are generic, not the operators' liveries. If the live feed is unavailable, a recorded evening plays instead. 3D models and live streaming are features of Icon Map for Fabric.

How it works

From AIS to a living port

  1. Stream the positions

    Terrestrial and satellite AIS, radar tracks and port community system messages flow into Fabric through Eventstream, each ship carrying its type, size, destination and port call.

    Eventstream · Eventhouse · OneLake
  2. Add the port

    Berths, quays, fairways, depths and aids to navigation from your GIS and the nautical chart, terminal yards and cranes from your terminal operating system, and 3D models for every ship type.

    Your GIS · Icon Map Catalog · your models
  3. Run the operation

    Watch the port live or replay any period, follow a ship, and measure berth occupancy, waiting time, turnaround and emissions with every chart in the report filtering together.

    Icon Map for Fabric · Icon Map Pro

For shipping companies · Voyage planning

Suez or the Cape? The cost of every route

Choose a voyage, a ship and a speed. Icon Map routes it on the sea-lane network every way it can go, and puts the distance, the days, the fuel, the CO2, the EU ETS bill and the high-risk areas on the way side by side.

Routes: shortest paths on the Eurostat MARNET sea-lane network (via searoute, EUPL-1.2). Shipping density: World Bank and IMF, Global Shipping Traffic Density (CC BY 4.0). Fuel: the ship class's main engine consumption scaled by the cube of speed, plus auxiliary engines; CO2 from the IMO conversion factor for very low sulfur fuel oil. EU ETS: the share of emissions covered for voyages to, from and within the EU and EEA, at the stated allowance price. High-risk areas are drawn approximately from the Joint War Committee's listed areas. Estimates for illustration, not voyage advice.

For shipping companies · Fleet performance

Every ship in the fleet, every measure that matters

A fleet's position, schedule, fuel and carbon on one map. Rank the ships by what matters this week, from ETA slippage to the IMO carbon intensity rating, and click one to see its voyage, the weather around it and its EU ETS liability so far this year.

The fleet, its schedules and its fuel figures are simulated for demonstration, sailing real sea lanes; ratings use the IMO CII method for each ship type and this year's required reduction. Weather around each ship: live from Open-Meteo's marine and weather forecasts (CC BY 4.0). Shipping density: World Bank and IMF, Global Shipping Traffic Density (CC BY 4.0).

Across ports, terminals and shipping lines

Where maritime teams use Icon Map

Vessel traffic and port control

Every ship live with its type, speed and destination, inbound queues and movements in the fairways, as the harbor master sees them.

Berth planning

Berth occupancy, ETA against plan, waiting time at anchor and turnaround by berth and terminal, on the map and in the berth plan.

Terminals and yards

Crane productivity, yard density and equipment moves from the terminal operating system, block by block, in 3D.

Pilotage and towage

Pilot boats, tugs and their jobs on the water, boarding points and transit times, utilization by area and hour.

Fleet and voyage performance

Positions, schedules, speed and consumption for a whole fleet, with ETA risk and route choices measured against each other.

Emissions and compliance

CO2 by voyage, at berth and in EU waters, EU ETS and FuelEU exposure and CII ratings, from the noon reports you already file.

Security and risk

War-risk and high-risk areas, chokepoint disruption and port congestion against your routes and cargo, as it changes.

Environment and safety

Protected areas, emission control areas, ice, weather and incidents beside the traffic, for planning and investigation.

Why Choose
Icon Map?

Our customer success stories

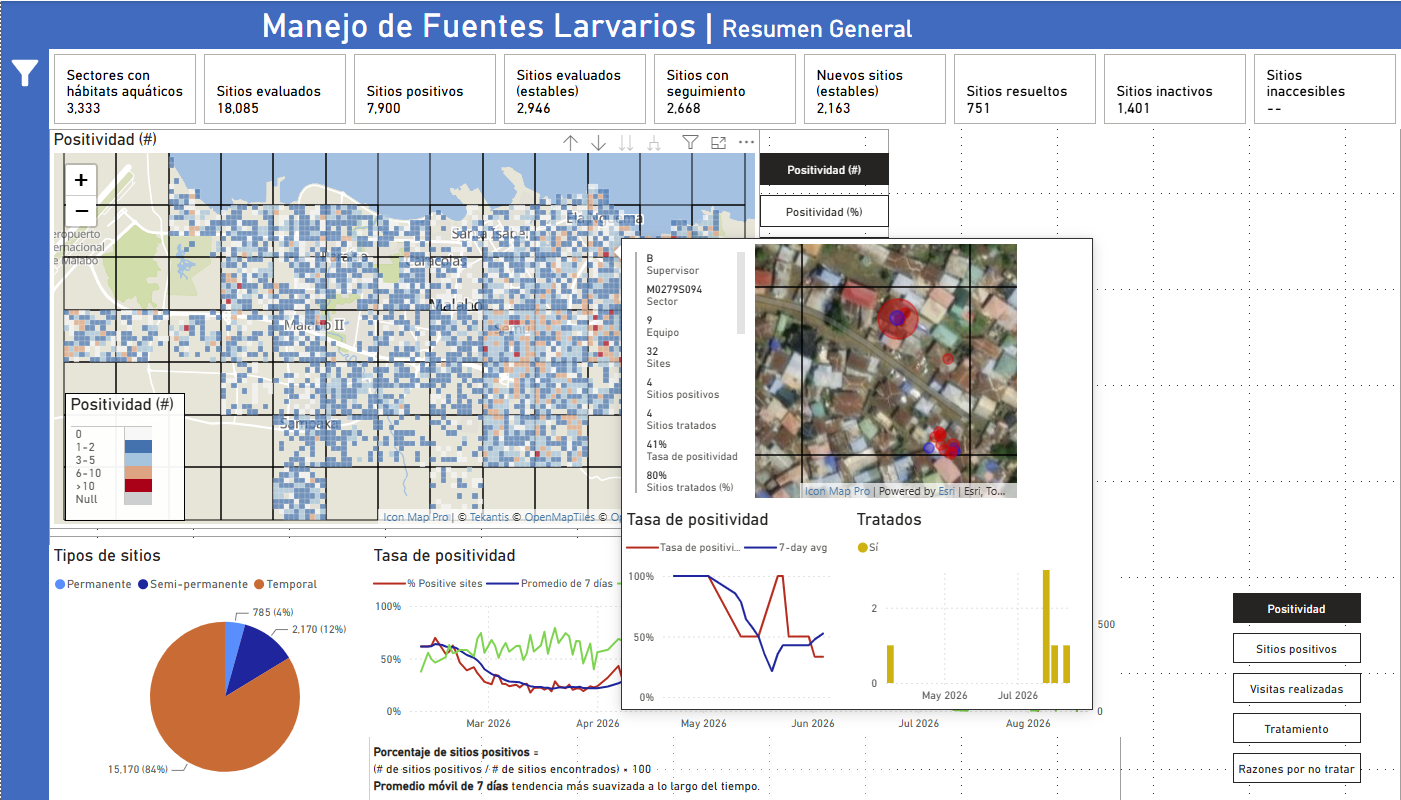
Bringing Malaria Data to Life: How MCD Global Health Uses Icon Map Pro to Power Field Decisions in Equatorial Guinea screenshot

Bringing Malaria Data to Life: How MCD Global Health Uses Icon Map Pro to Power Field Decisions in Equatorial Guinea

MCD Global Health is a public health nonprofit headquartered in Maine, working across more than 50 countries to design and implement health programmes that genuinely change lives. Their international work spans malaria, cervical cancer, health systems strengt…
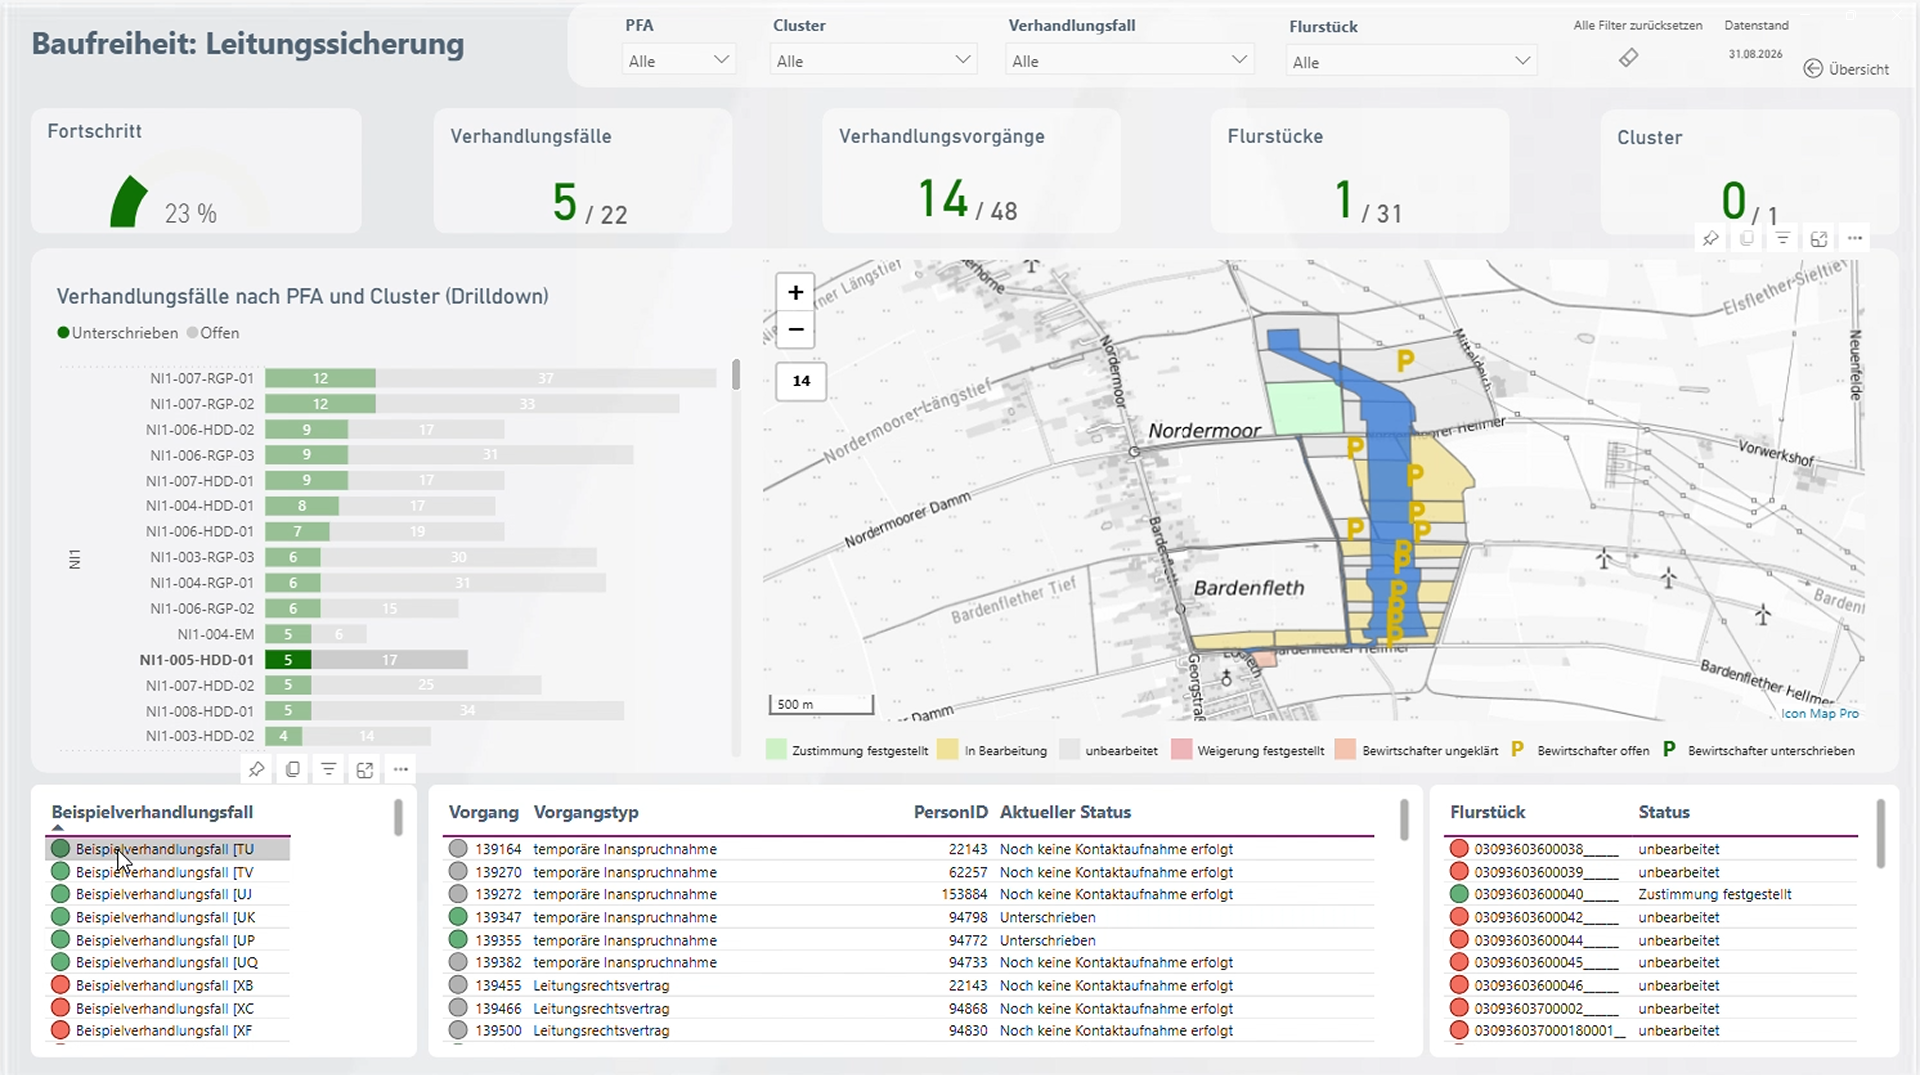

Amprion: Bringing Large-Scale Transmission Infrastructure onto a Single Map  screenshot

Amprion: Bringing Large-Scale Transmission Infrastructure onto a Single Map

Amprion is one of Germany’s four transmission system operators, responsible for operating and expanding a critical part of Germany’s high-voltage electricity grid. Among its major infrastructure programmes is the Rhein-Main-Link, a planned underground HVDC c…

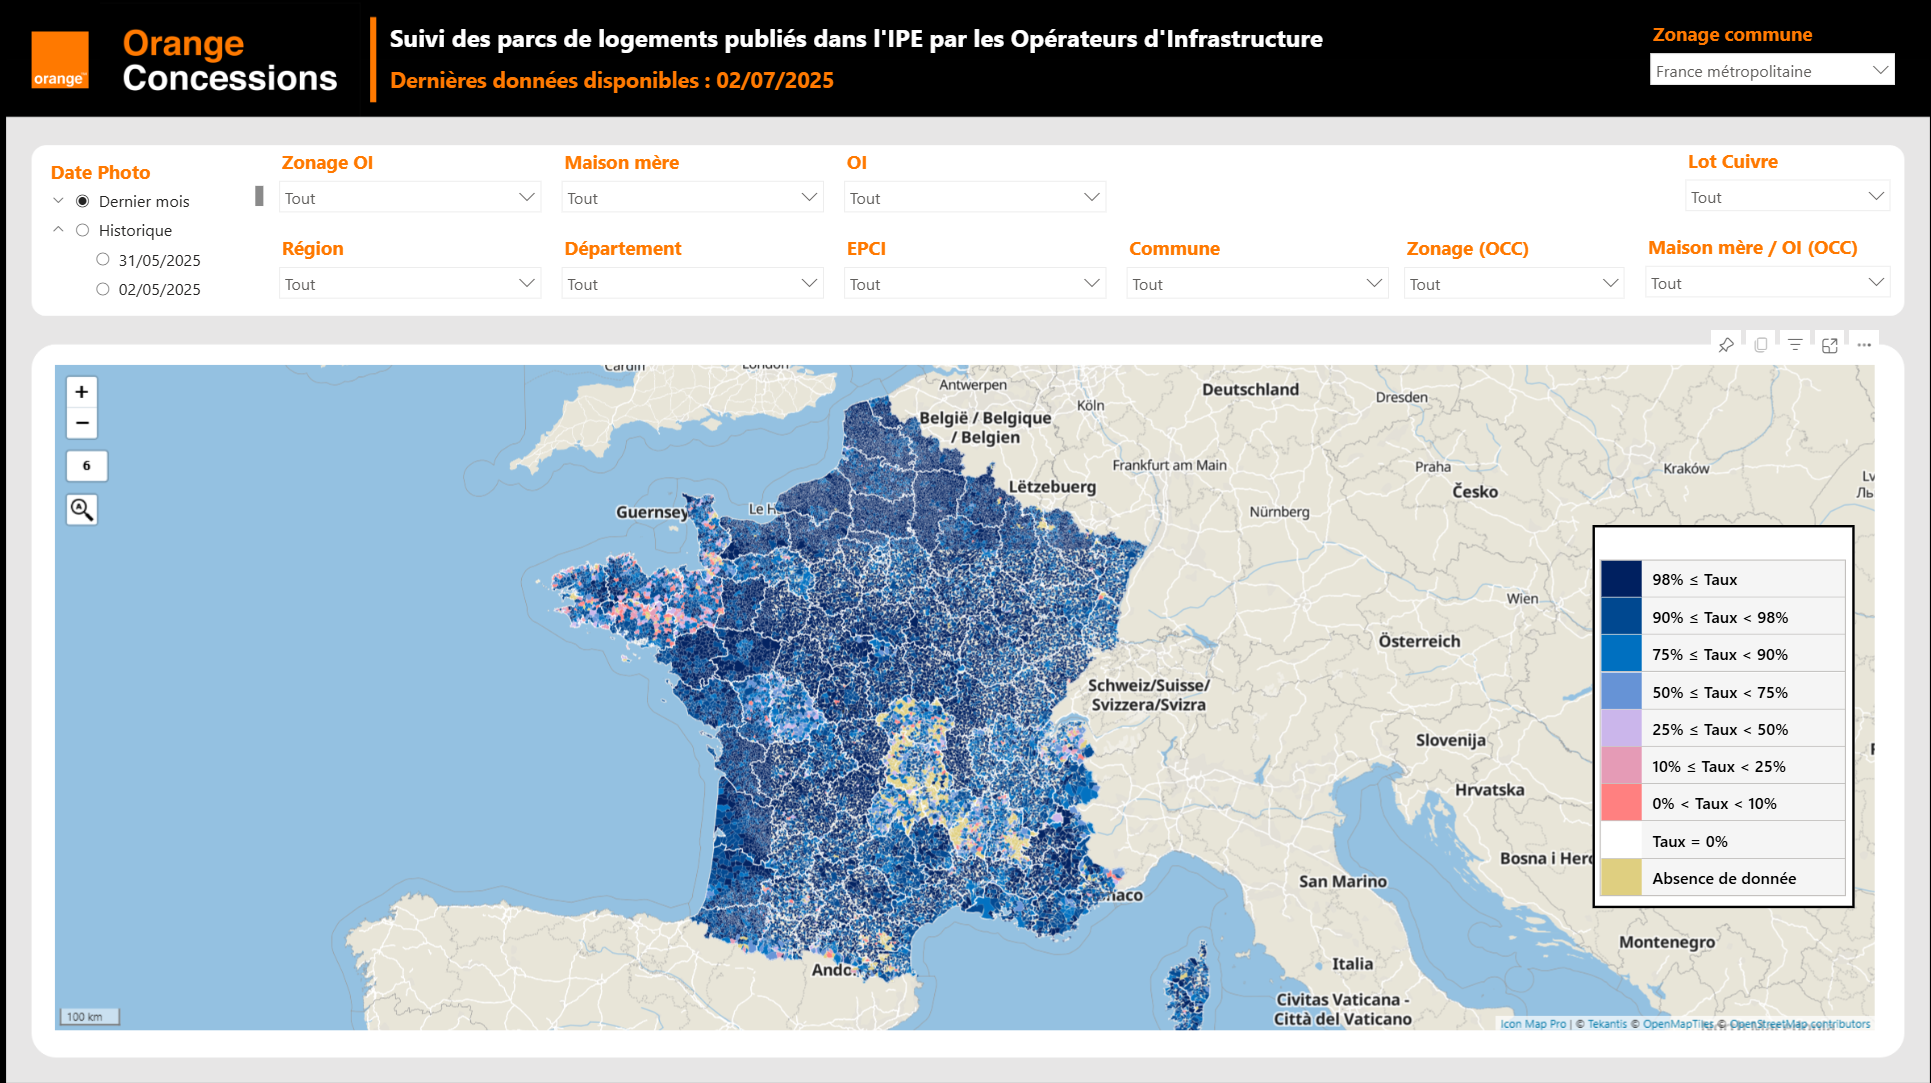
Enhancing Fiber Deployment and Commercialization with Icon Map Pro at Orange Concessions screenshot

Enhancing Fiber Deployment and Commercialization with Icon Map Pro at Orange Concessions

Orange Concessions is the leading public-private fiber network operator in rural France. Through long-term public service delegation contracts, it manages a rapidly expanding network infrastructure designed to bring high-speed broadband access to underserved…

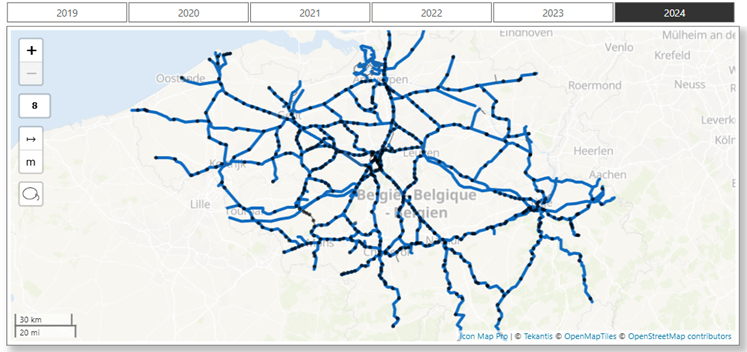
Transforming Rail Safety: The Power of Location Intelligence in Action at SNCB screenshot

Transforming Rail Safety: The Power of Location Intelligence in Action at SNCB

Safety is a cornerstone of SNCB’s operational strategy. As Belgium’s national railway operator, SNCB places significant emphasis on the safety and security of both passengers and staff. CEO Sophie Dutordoir recently stated that all employees' work "deserves r…

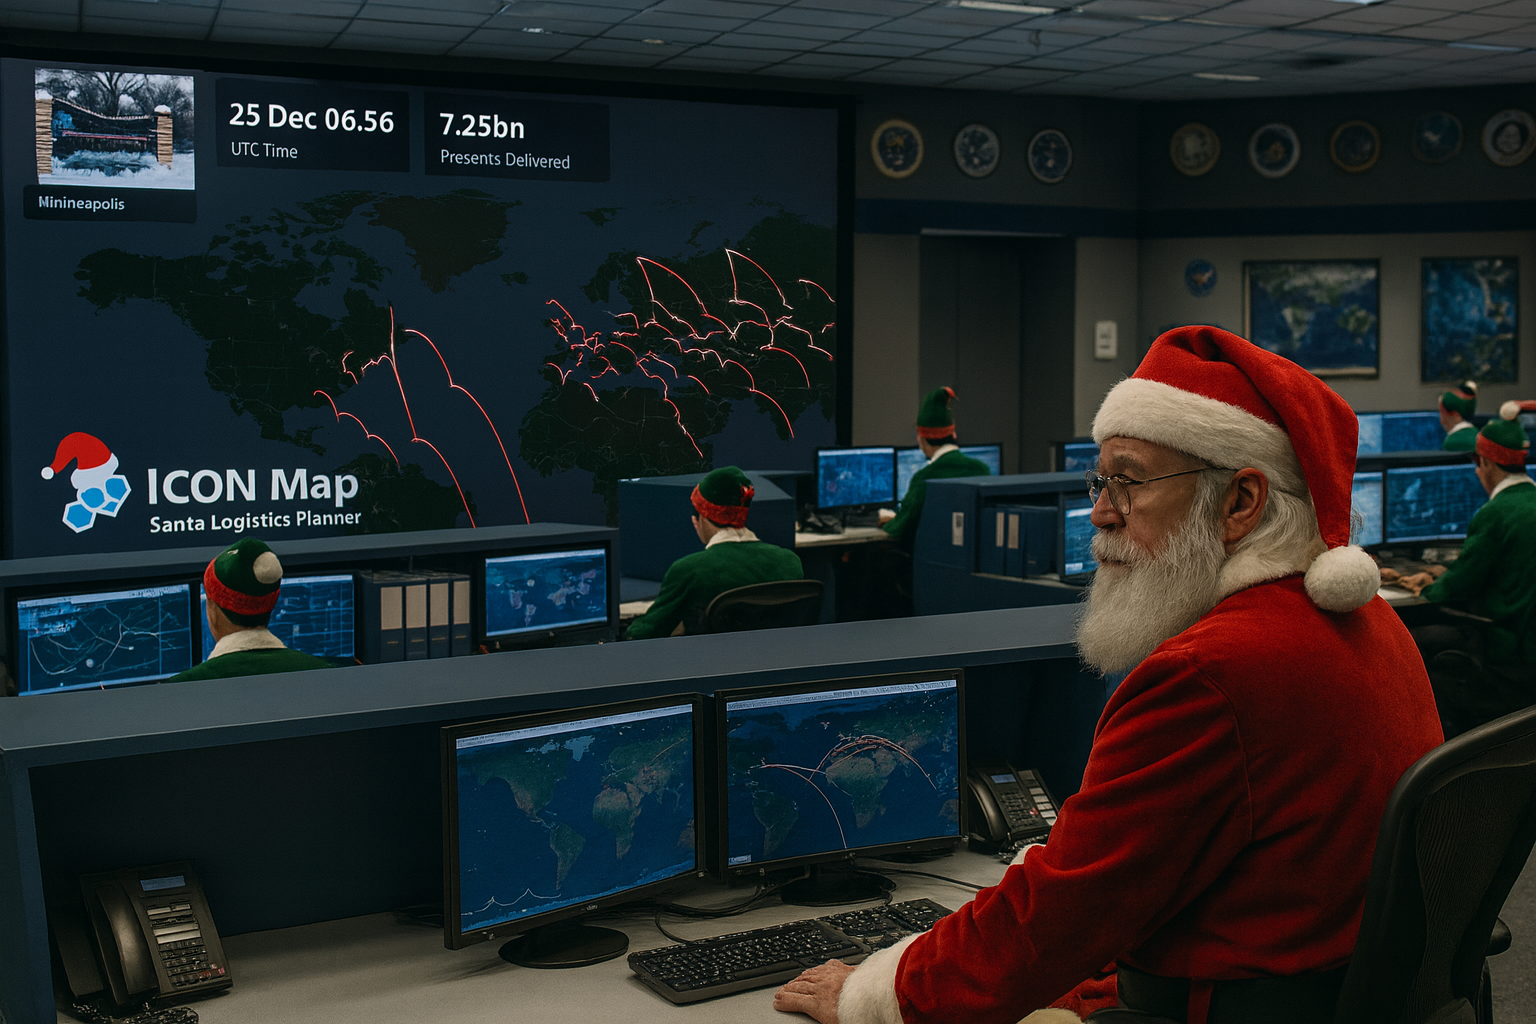
Optimizing Christmas Eve: How Santa Uses Icon Map to Put Every Child on the Map screenshot

Optimizing Christmas Eve: How Santa Uses Icon Map to Put Every Child on the Map

North Pole Logistics is the exclusive global operator responsible for delivering presents to children who celebrate Christmas. Operating from a single distribution center at the North Pole, the organization must reach more than 900 million homes in one extend…

See your port and your fleet on the map

Build port and fleet reports in Power BI with Icon Map Pro, or bring live AIS, 3D ships and playback together in Microsoft Fabric with Icon Map for Fabric.

Icon Map for Microsoft Fabric is in private preview - join the wait list to run these analyses on your own data.Icon Map for Microsoft Fabric is generally available - start a free 30-day trial from inside Fabric or buy a plan to run these analyses on your own data.