Industry solutions · Retail & Commercial Real Estate
Why Icon Map for Retail & Real Estate?
Every store, site and lease lives in a place, and its value depends on who can reach it. Icon Map puts your portfolio, your customers and your competition on one interactive map, inside the Power BI reports and Microsoft Fabric workspaces you already use.
Greater Manchester residents, Census 2021 · gold: the fictional Northway chain
Location is the decision
See who every site really reaches
Where to open next, which stores to refit, which leases to renew, where the competition is closing in: these are location decisions. Icon Map answers them on a map your whole team can use, with your sales, footfall and lease data beside it and every chart filtering together.
Build portfolio and performance reports in Power BI with Icon Map Pro, select customers and sites by real drive time with Icon Map Slicer, or bring the whole picture together in Microsoft Fabric with Icon Map for Fabric.
Real drive-time catchmentsCatchments worked out along the road network, not drawn as circles, in Icon Map for Fabric and Icon Map Slicer.
Numbers that follow the mapSelect a catchment, a region or a cluster of stores and every chart in the report sums what is inside.
Portfolio in contextStores, sites and buildings beside demographics, competitors and transport, from your data and the Icon Map Catalog.
From one city to every marketThe same analysis on every store and every market, with hexagons and clusters that stay fast at scale.
Live site selection · Greater Manchester
Drop a store anywhere. See who it reaches.
Click anywhere on the map, or pick a suggested site. Icon Map's travel-time engine works out the real 5, 10 and 15 minute drive-time catchments along the road network, then counts the residents inside, the competing supermarkets, and how much of the catchment your existing stores already cover.
The catchments are calculated in your browser by the travel-time engine inside Icon Map for Fabric and Icon Map Slicer. In Icon Map Slicer, a catchment like this becomes a selection that filters every visual on the report page. Residents and the catchment profile: 2021 Census and the Index of Multiple Deprivation 2025 by LSOA; supermarkets: Overture Maps Places. All from the Icon Map Catalog. Store brands are fictional: the competitor locations are real supermarkets, shown under made-up names, and "your stores" are illustrative.
How it works
From store list to site decision
Bring your data
Stores, sales, loyalty postcodes, footfall and lease schedules from your semantic models, Lakehouses or warehouses, located by coordinates, postcodes or boundaries.
Power BI semantic models · OneLake · Warehouse
Add the market
Layer in demographics, competitors, transport and boundaries from the Icon Map Catalog, and aggregate your customers into hexagons or your own trade areas.
Icon Map Catalog: census, points of interest, boundaries
Decide on the map
Compare catchments, spot gaps and overlaps, and filter the whole report from the map: by drive time in Icon Map Slicer and Icon Map for Fabric, or by region, cluster and selection in Icon Map Pro.
Icon Map Pro · Icon Map Slicer · Icon Map for Fabric
Across retail and real estate
Where retail and property teams use Icon Map
Site selection and network planning
Score candidate sites on the residents they reach, the competition they face and the overlap with your own stores, then compare them side by side.
Catchments and trade areas
Draw drive-time and walk-time catchments, or use your own trade areas, and see sales, customers and penetration for each one.
Store performance
Map sales, margin and like-for-like growth by store, colored and sized by any measure, and drill from region to store to department.
Competitor and cannibalization analysis
Overlay competitor locations from the Icon Map Catalog and see where your own stores compete with each other for the same customers.
Commercial real estate portfolios
Map buildings and units with occupancy, rent and lease expiry, extrude them by value or height, and label key assets with rich cards: photo, headline and facts.
Leasing and acquisitions
Bring availability, comparables and planning context together, and see every option against the demographics and transport around it.
Customers and loyalty
Aggregate customers into hexagons by spend, frequency or segment, and see where your best customers live against the stores that serve them.
Supply chain and delivery
Map distribution centers, delivery zones and routes beside store demand, with flow arcs showing how goods move through the network.
Why Choose Icon Map?
Our customer success stories
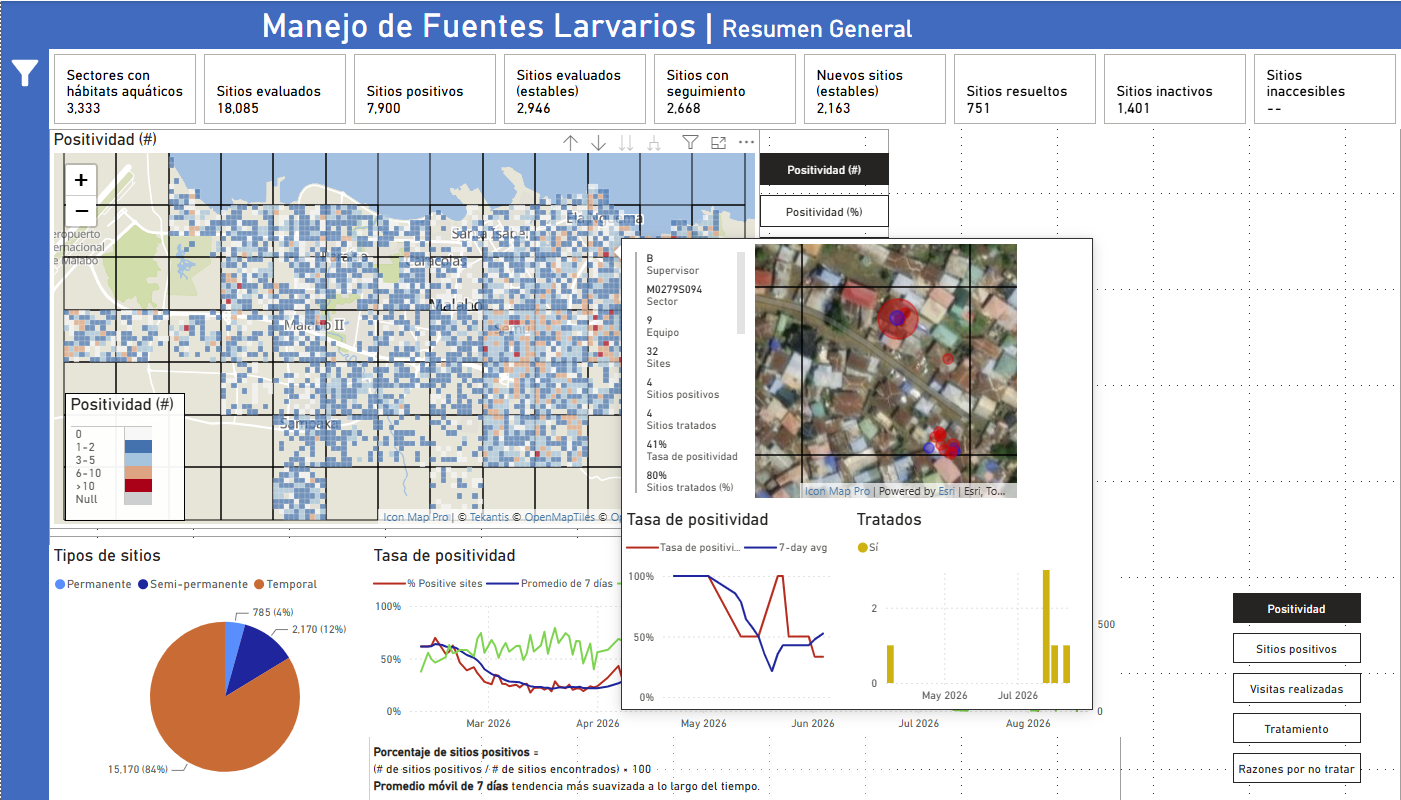
Bringing Malaria Data to Life: How MCD Global Health Uses Icon Map Pro to Power Field Decisions in Equatorial Guinea
MCD Global Health is a public health nonprofit headquartered in Maine, working across more than 50 countries to design and implement health programmes that genuinely change lives. Their international work spans malaria, cervical cancer, health systems strengt…
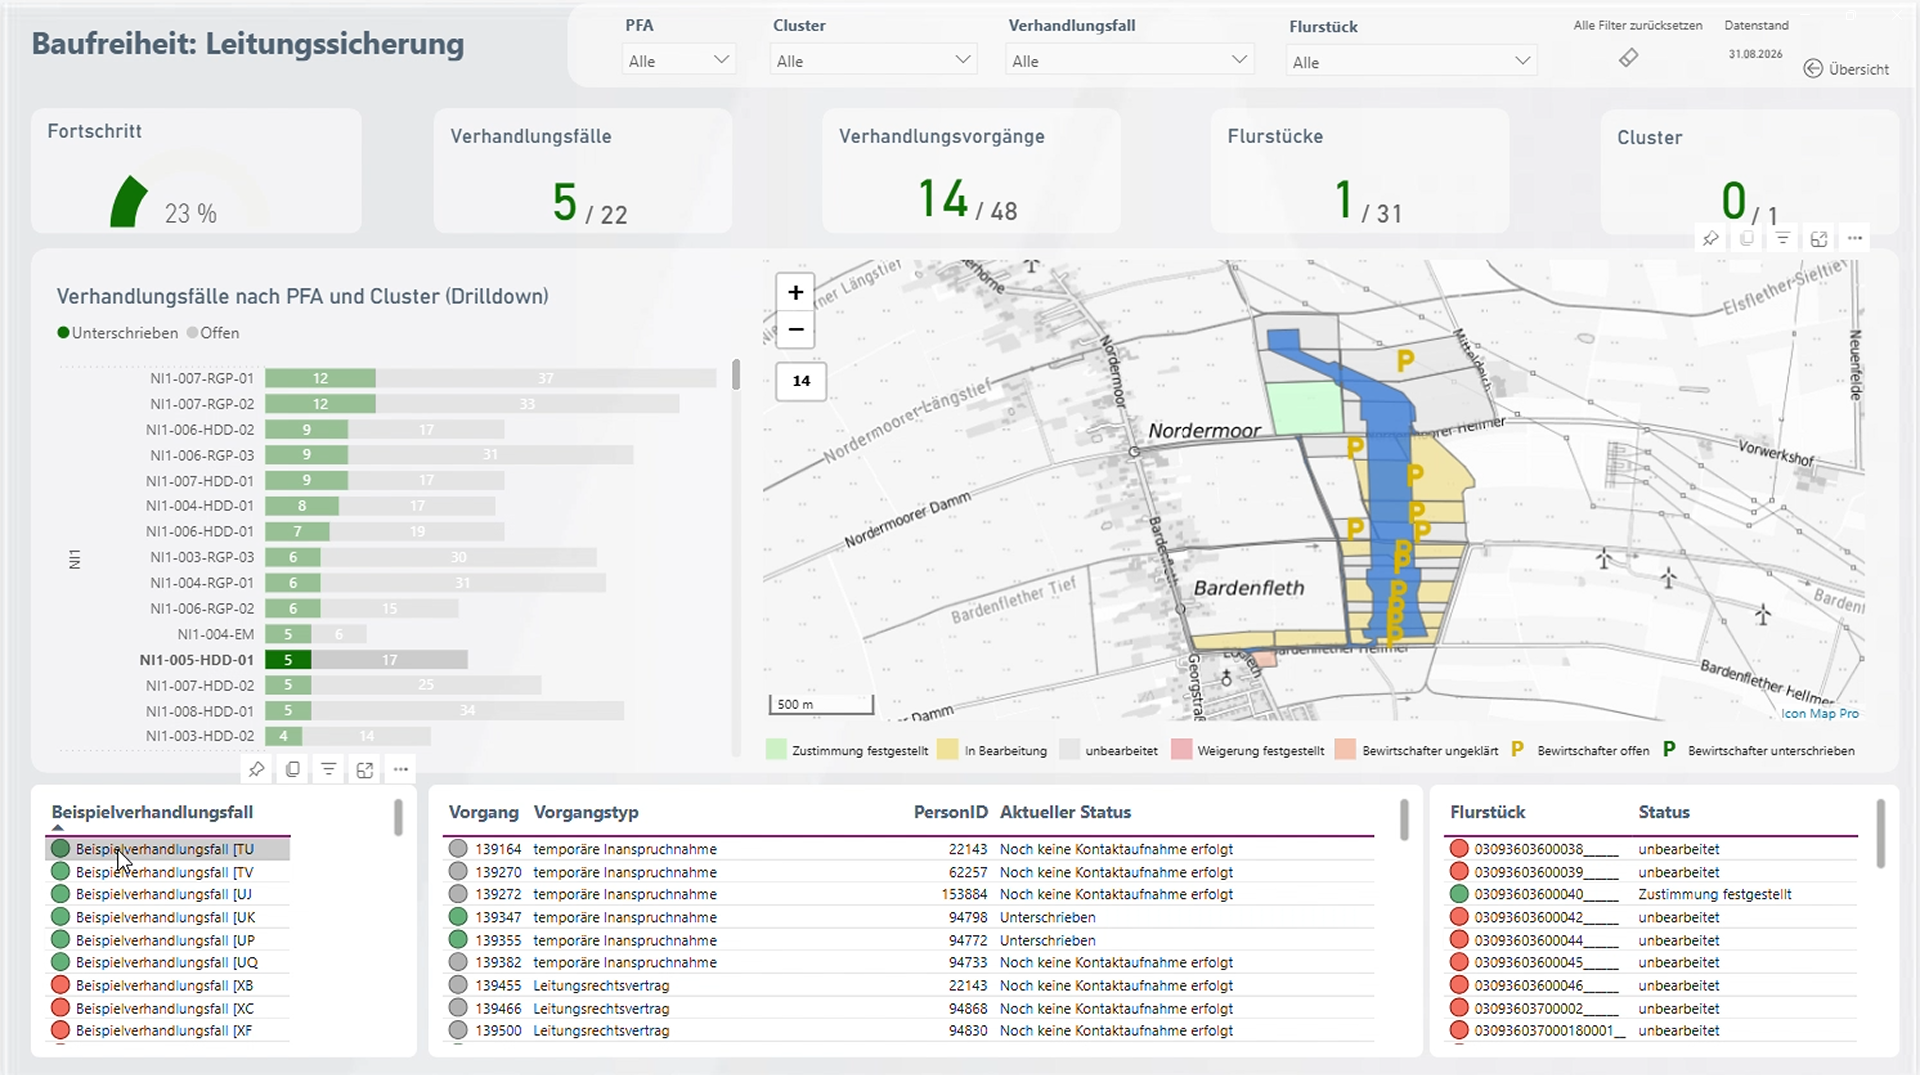
Amprion: Bringing Large-Scale Transmission Infrastructure onto a Single Map
Amprion is one of Germany’s four transmission system operators, responsible for operating and expanding a critical part of Germany’s high-voltage electricity grid. Among its major infrastructure programmes is the Rhein-Main-Link, a planned underground HVDC c…
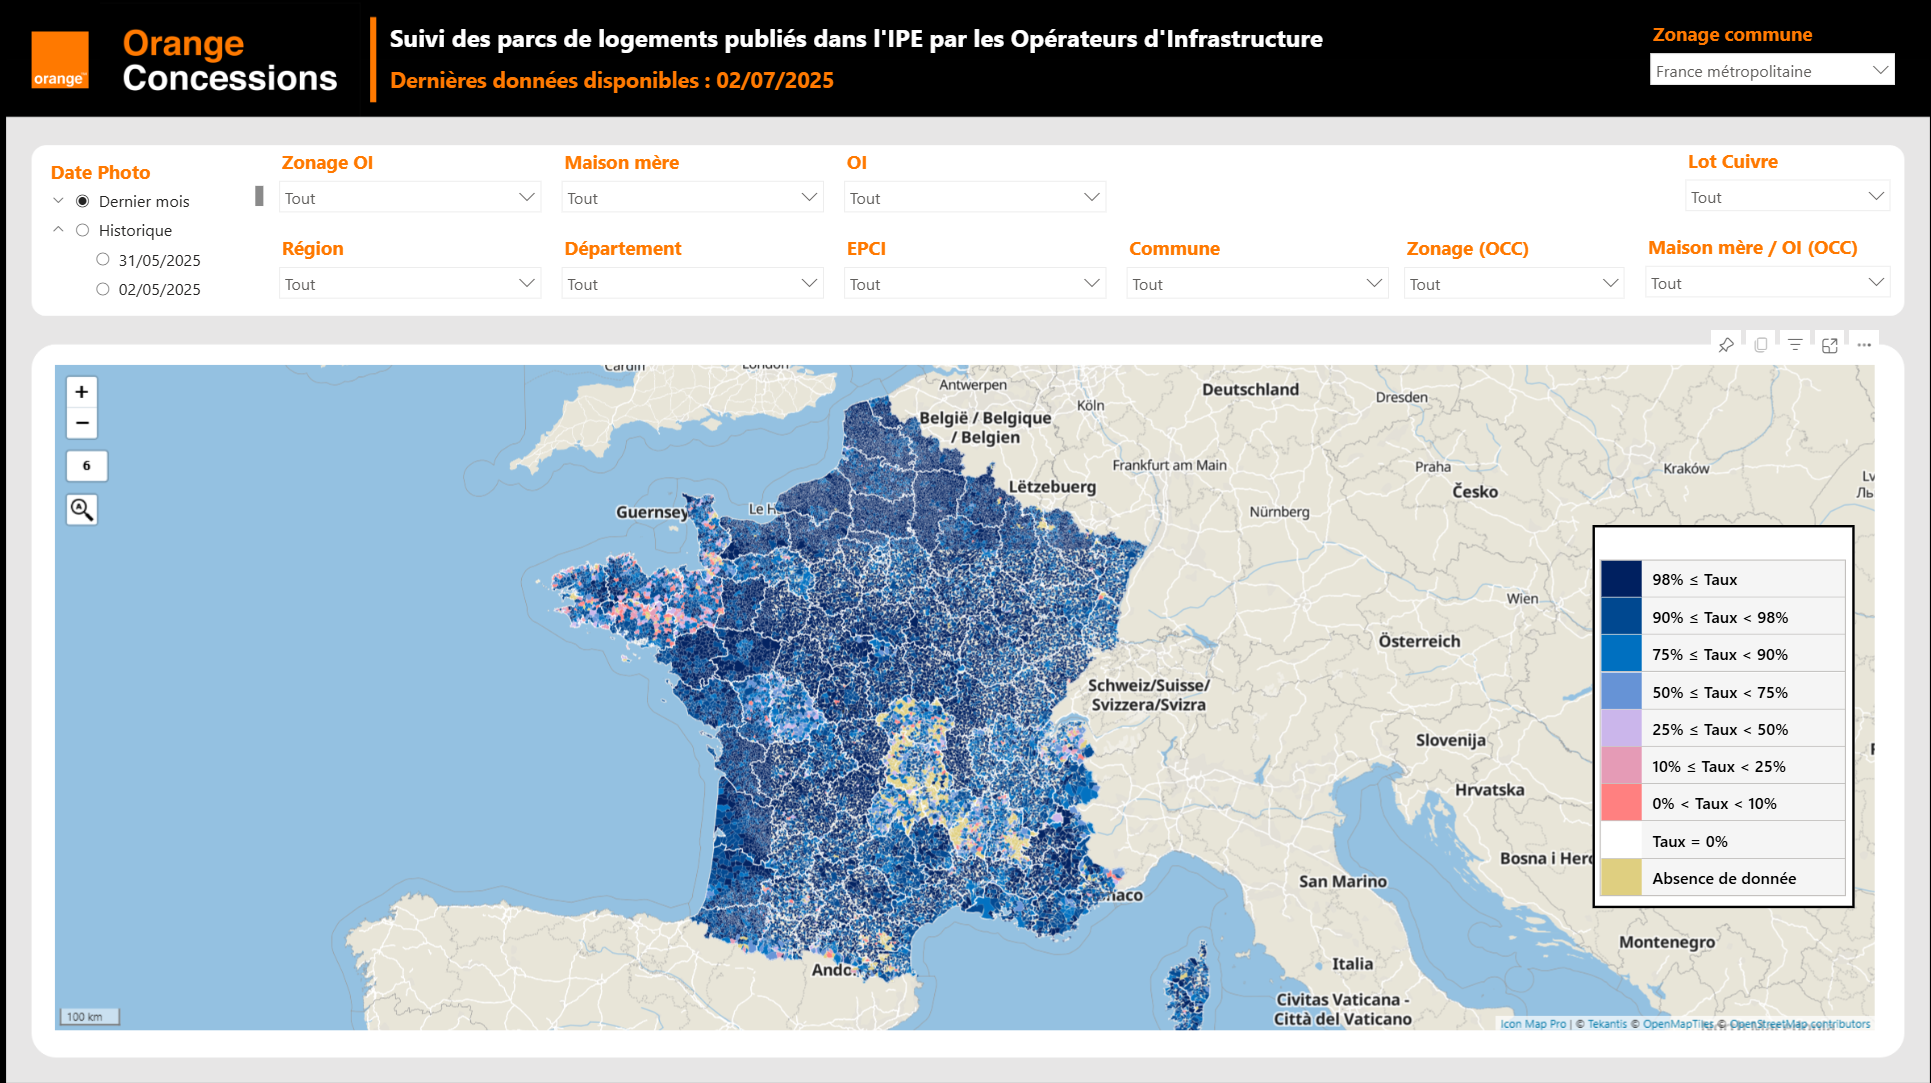
Enhancing Fiber Deployment and Commercialization with Icon Map Pro at Orange Concessions
Orange Concessions is the leading public-private fiber network operator in rural France. Through long-term public service delegation contracts, it manages a rapidly expanding network infrastructure designed to bring high-speed broadband access to underserved…
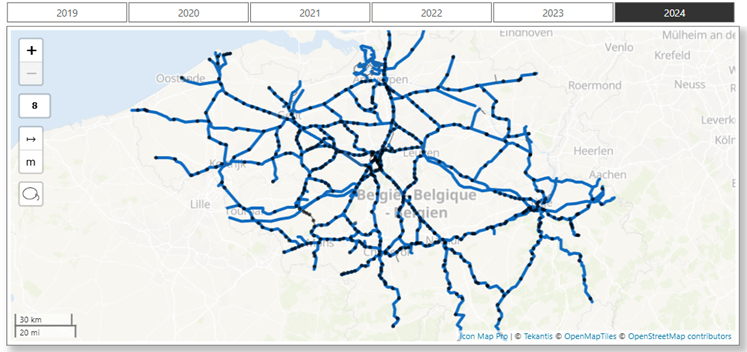
Transforming Rail Safety: The Power of Location Intelligence in Action at SNCB
Safety is a cornerstone of SNCB’s operational strategy. As Belgium’s national railway operator, SNCB places significant emphasis on the safety and security of both passengers and staff. CEO Sophie Dutordoir recently stated that all employees' work "deserves r…
Optimizing Christmas Eve: How Santa Uses Icon Map to Put Every Child on the Map
North Pole Logistics is the exclusive global operator responsible for delivering presents to children who celebrate Christmas. Operating from a single distribution center at the North Pole, the organization must reach more than 900 million homes in one extend…
Map your portfolio in Power BI with Icon Map Pro, select by drive time with Icon Map Slicer, or bring it all together in Microsoft Fabric with Icon Map for Fabric.
Working out drive times along the road network...Three catchments calculated in {s} sYour pickNo road near that point: try somewhere else.SupermarketTypeCatchments by the Icon Map travel-time engineHouseholdsHouseholds without a carChildren under 16Aged 65 and overManagerial and professionalIn the 20% most deprived areasGreater Manchester averageResidents per km², 2021 Census, darker = denserIndex of Multiple Deprivation 2025: red = most deprived, green = leastShare of households without a car or van, 2021 CensusShare in managerial and professional occupations, 2021 CensusCatchment10 minute driveThis live map could not load. Please check your connection and refresh the page.Use Ctrl + scroll to zoom the mapUse ⌘ + scroll to zoom the mapUse two fingers to move the map