The environment is measured everywhere and changes by the hour. Icon Map brings sensors, warnings, designations and risk together on one live map, inside the Power BI reports and Microsoft Fabric workspaces your teams already use, so everyone from field teams to the board sees the same picture.
Live river levels: Environment Agency (Open Government Licence)
Monitor, protect, report
Environmental data, where it belongs: on the map
River gauges, water quality samples, air monitors, habitat surveys, permits and incidents all describe places. Icon Map puts them on an interactive map beside your charts and KPIs, so you can see what is happening, where it matters and who it affects, then act on it.
Build environmental reports in Power BI with Icon Map Pro, or bring live monitoring and analysis together in Microsoft Fabric with Icon Map for Fabric. The Icon Map Catalog adds ready-made context, from protected sites to flood risk zones and river networks.
Live monitoringSensor readings and warnings on the map as they arrive, colored by what normal looks like at each site.
Risk in contextFlood zones, protected sites and receptors in one view, so you see who and what is exposed.
Ready-made contextThousands of environmental layers in the Icon Map Catalog: designations, habitats, rivers, flood risk and more.
Reporting that adds upClick an area, a site or a catchment and every chart and table in the report follows.
Live river levels and flood warnings
Every river gauge in England, right now
This map reads the Environment Agency's open real-time data as the page opens: the latest level at every river gauge, colored against that gauge's own typical range, and the flood warnings in force, drawn as their warning areas. Click a gauge for its last five days, pick a warning to fly to it, and switch on catalog layers for context.
Sensors, field apps, lab results and open data feeds land in OneLake through pipelines, notebooks or Eventstreams, or in the data sources your Power BI reports already use.
Join each reading to its site, catchment or water body, and add designations, flood zones, habitats and boundaries from the Icon Map Catalog in a couple of clicks.
Icon Map Catalog: environmental, boundary and reference layers
Map and report
Colour every site against its own thresholds, aggregate readings into hexagons or catchments, and cross-filter the charts beside the map, in Fabric or in Power BI.
Icon Map for Fabric · Icon Map Pro for Power BI
Across environmental work
Where environmental teams use Icon Map
Flood and water monitoring
Map river and groundwater levels, rainfall and warnings against each site's normal range, and see which communities and assets sit in the areas at risk.
Water quality
Bring sampling points, discharge consents and storm overflows together by catchment, and trace a result back to the water bodies and protected sites downstream.
Air quality and emissions
Map monitors and emission sources, aggregate readings into hexagons or local areas, and compare exposure against the people and places nearby.
Biodiversity and protected sites
Overlay survey records on SSSIs, national parks and habitat networks from the catalog, and see where development, land use or pressures meet designated sites.
Climate risk and ESG
Score your sites, suppliers or portfolio against flood zones and other physical risks, and give stakeholders a map they can explore alongside the numbers.
Permits, incidents and compliance
Plot permitted sites, inspections and pollution incidents, then select a radius or a catchment to see every receptor and report within it.
Weather and conditions
Add weather layers to read readings against the conditions behind them. Icon Map for Fabric adds live wind, rain and temperature from the global forecast models.
Land, terrain and nature recovery
Show land cover, peat, woodland and restoration projects over 3D terrain and aerial imagery, and track progress area by area against your targets.
Why Choose Icon Map?
Our customer success stories
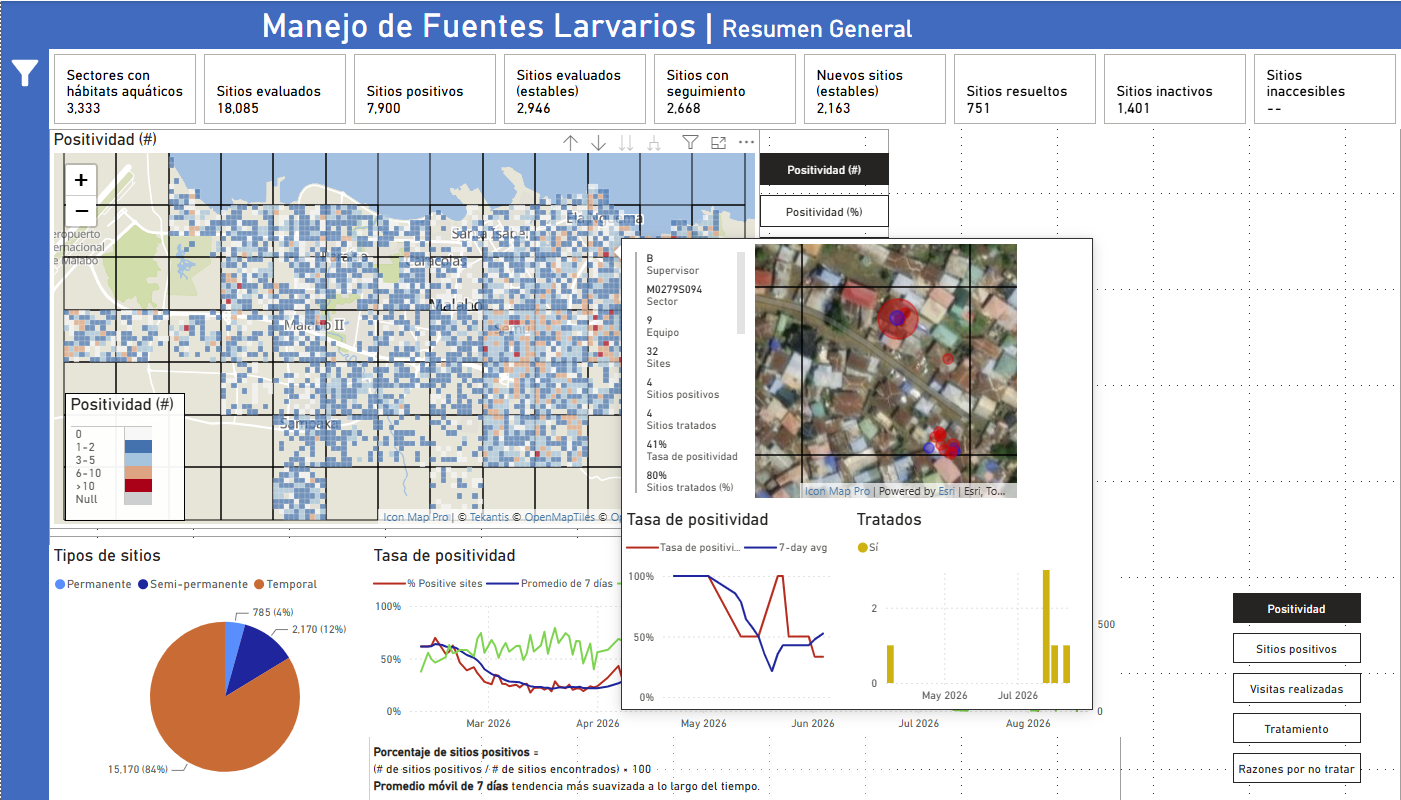
Bringing Malaria Data to Life: How MCD Global Health Uses Icon Map Pro to Power Field Decisions in Equatorial Guinea
MCD Global Health is a public health nonprofit headquartered in Maine, working across more than 50 countries to design and implement health programmes that genuinely change lives. Their international work spans malaria, cervical cancer, health systems strengt…
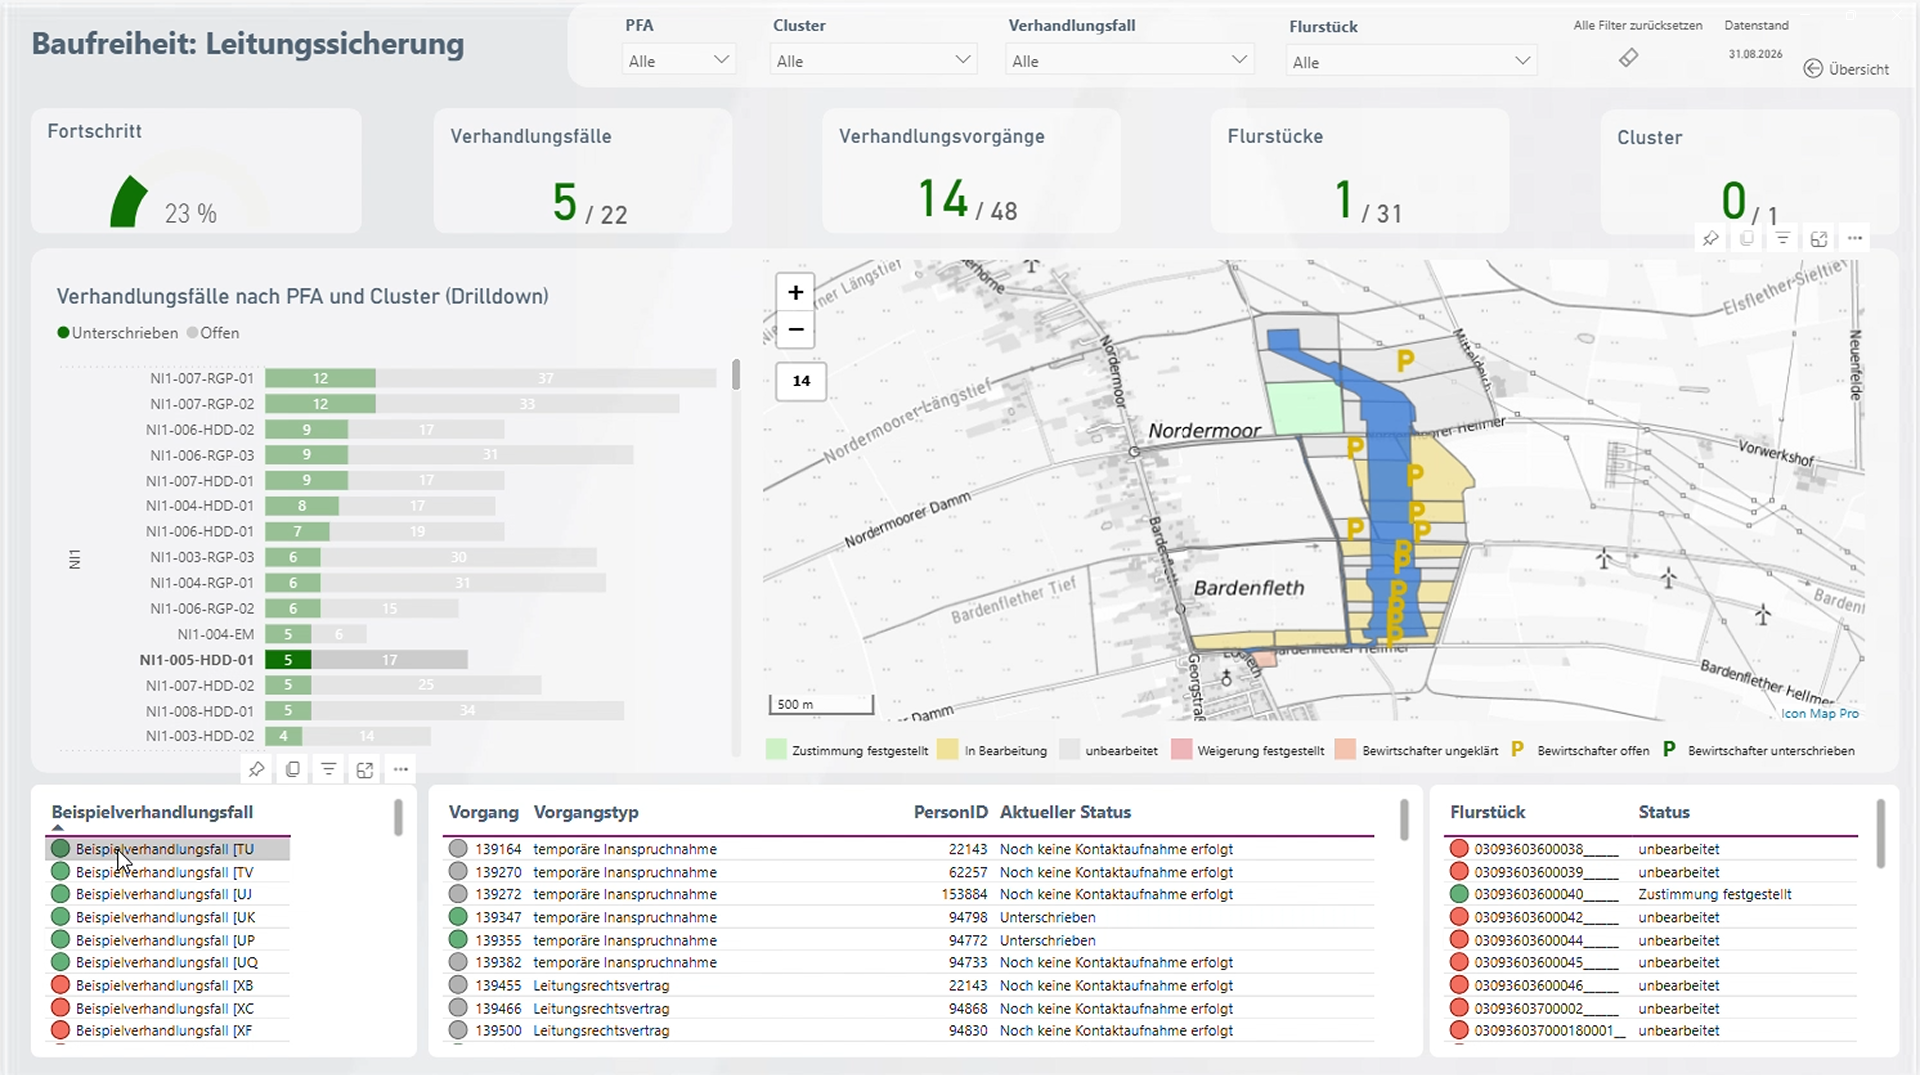
Amprion: Bringing Large-Scale Transmission Infrastructure onto a Single Map
Amprion is one of Germany’s four transmission system operators, responsible for operating and expanding a critical part of Germany’s high-voltage electricity grid. Among its major infrastructure programmes is the Rhein-Main-Link, a planned underground HVDC c…
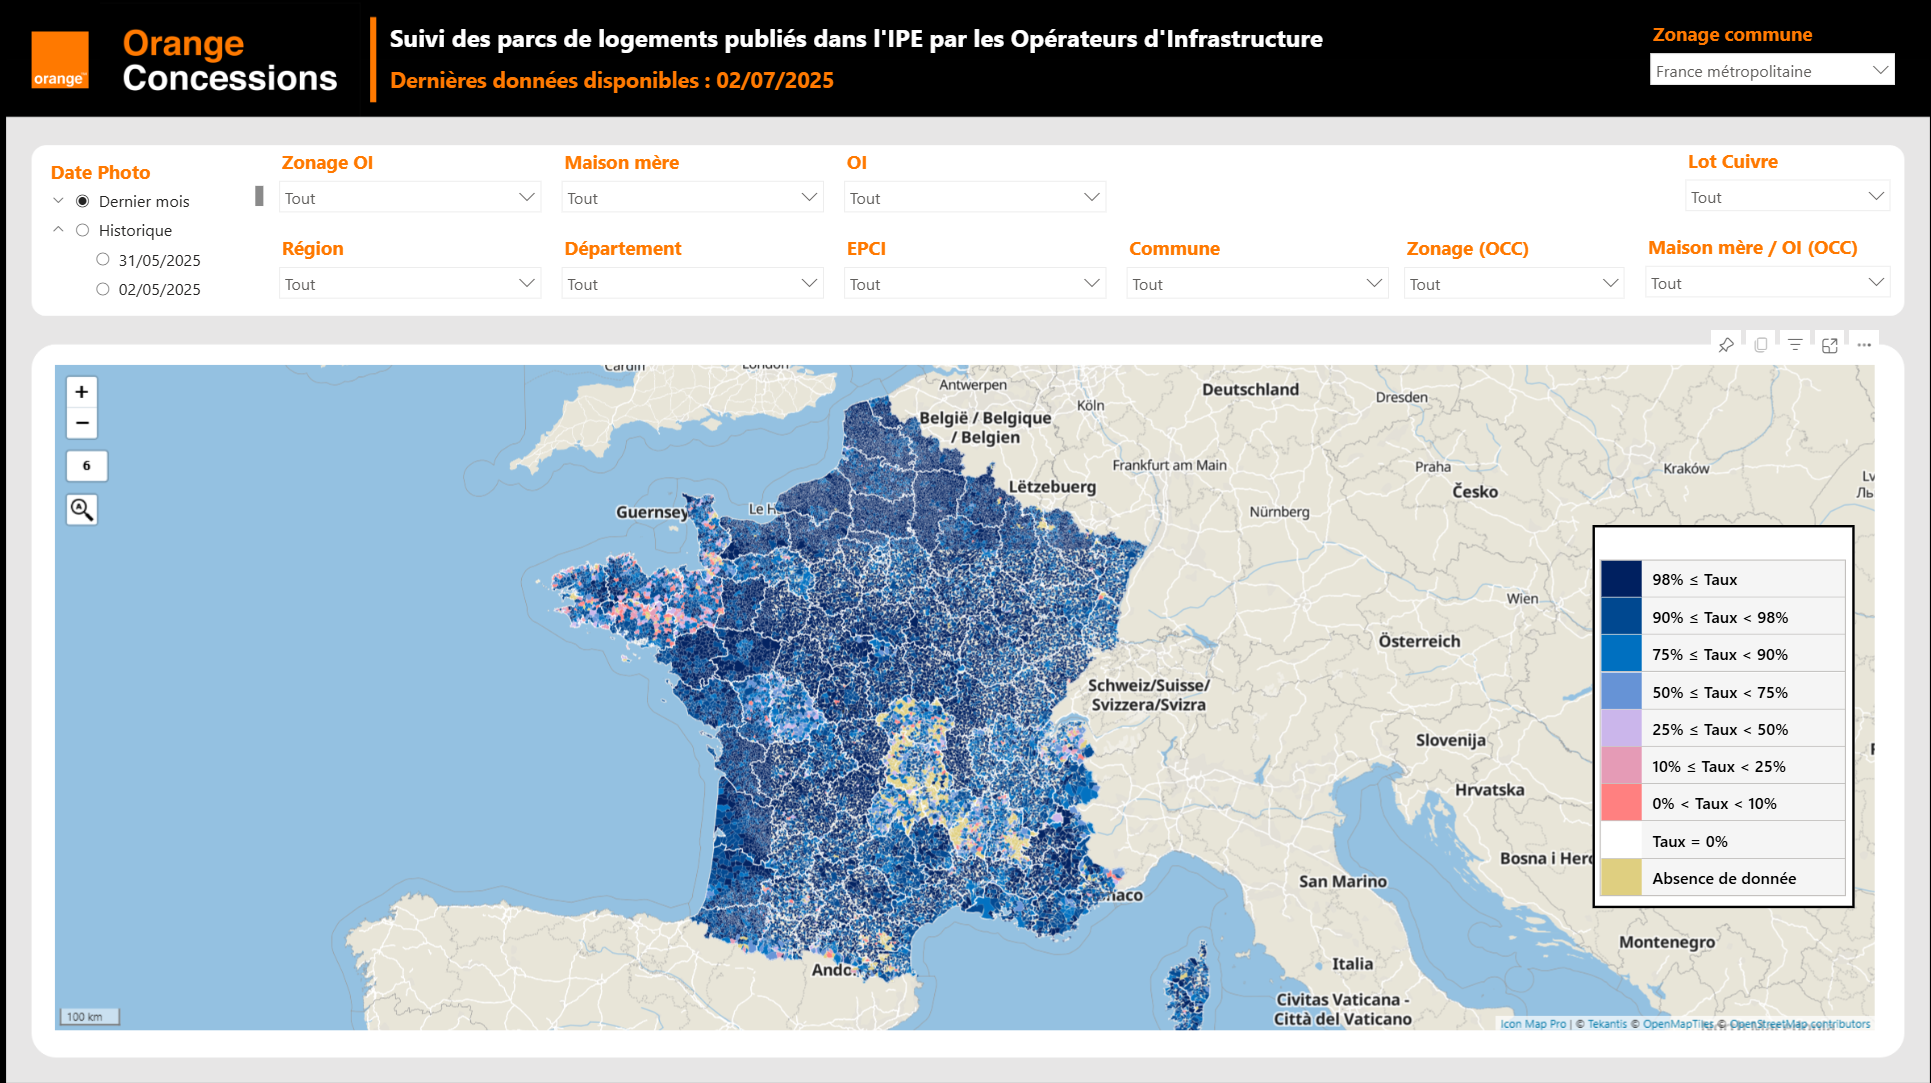
Enhancing Fiber Deployment and Commercialization with Icon Map Pro at Orange Concessions
Orange Concessions is the leading public-private fiber network operator in rural France. Through long-term public service delegation contracts, it manages a rapidly expanding network infrastructure designed to bring high-speed broadband access to underserved…
Transforming Rail Safety: The Power of Location Intelligence in Action at SNCB
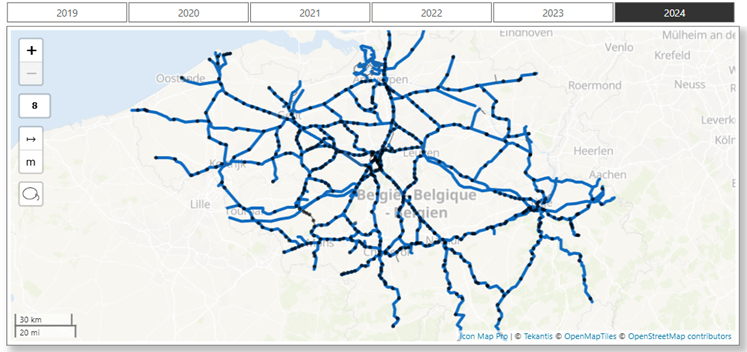
Safety is a cornerstone of SNCB’s operational strategy. As Belgium’s national railway operator, SNCB places significant emphasis on the safety and security of both passengers and staff. CEO Sophie Dutordoir recently stated that all employees' work "deserves r…
Optimizing Christmas Eve: How Santa Uses Icon Map to Put Every Child on the Map
North Pole Logistics is the exclusive global operator responsible for delivering presents to children who celebrate Christmas. Operating from a single distribution center at the North Pole, the organization must reach more than 900 million homes in one extend…
Level{v} m now, against a typical {lo} to {hi} mEnvironment Agency, liveTypical rangeStateAreaNowHighest on recordLoading the last five days...No recent readings for this gauge.River level over the last five days, with the typical range shadedNo flood warnings in force right now.Highest on recordAbove normalNormalBelow normalNo recent readingSevere flood warningFlood warningFlood alertThis live map could not load. Please check your connection and refresh the page.Use Ctrl + scroll to zoom the mapUse ⌘ + scroll to zoom the mapUse two fingers to move the map