

It's very useful for us. It's really a deal breaker.
Making sense of that much movement means working with large volumes of geospatial data, and BKK's data and reporting teams found that Power BI's default mapping tools could not keep up with what they needed to show.
The Challenge
Tamás Bringye and Dániel Bence Burányi work with data and reporting at BKK, helping the organization make sense of what's happening across its network. Power BI's built-in mapping could handle points and stations well enough, but broke down as soon as the team needed to show routes and movement, something Tamás puts down to a real limitation in Azure Maps.
"The basic or default Power BI visualizations are not so strong," he says. "We can show some points, some stations, but already if you want to draw the lines, for example where the buses and other transportation are going, there is a huge limitation." That gap sent him looking for a proper mapping solution built for the tool BKK actually relies on, since Power BI remains the organization's main reporting platform even though some colleagues also use QGIS or their own Python solutions.
Dániel ran into a related problem from a different angle. Azure Maps could only handle one filtered area at a time, which made it impossible to compare two zones side by side. "With the basic Azure map, I could only select one area," he explains. "If I wanted to select a different zone at the same time, I couldn't do it."
The Solution
BKK had tried the free version of Icon Map Pro a few years earlier, and it was seeing worked examples on Icon Map's own website that convinced the team it could solve the specific problem they had. The organization now runs Icon Map Pro alongside Icon Map Slicer, having bought Pro first and added the Slicer roughly six months later. Together, they've been part of BKK's reporting for a bit more than a year and are now used across several parts of the business.
Journey planning at city scale
The clearest example is BudapestGO, the journey-planning app that logged around 40 million trip plans in an eight-month window of 2026 the team looked at. That scale was more than Power BI could render as individual points, which is where Icon Map Pro's H3 hexagon visualization came in. "We weren't able to visualize it in Power BI, but with this H3 hexagon that's built into Icon Map Pro, it was very great news for us," Tamás says.
Dániel can also select multiple hexagons at once, one as the origin and one as the destination, to see how people plan journeys between two points, something Azure Maps couldn't filter at all. That view has a practical use whenever Budapest hosts a big event: the team can watch how a concert or football match affects the transport network and plan the next one more smartly, and the same approach is being explored for schedule optimization.
Bike share: where bikes start, end and need to go
The same origin and destination thinking carries over to BKK's MOL Bubi bike-share scheme, where station usage is shown through circle size and trips between stations reveal where bikes need to be collected and redistributed. A related view maps where journeys actually end when someone drops a bike off away from a docking station, pointing to where new stations might be worth adding, though the team works around a rendering limit of around 30,000 points by filtering the data down first.
Traffic: the routes drivers really take
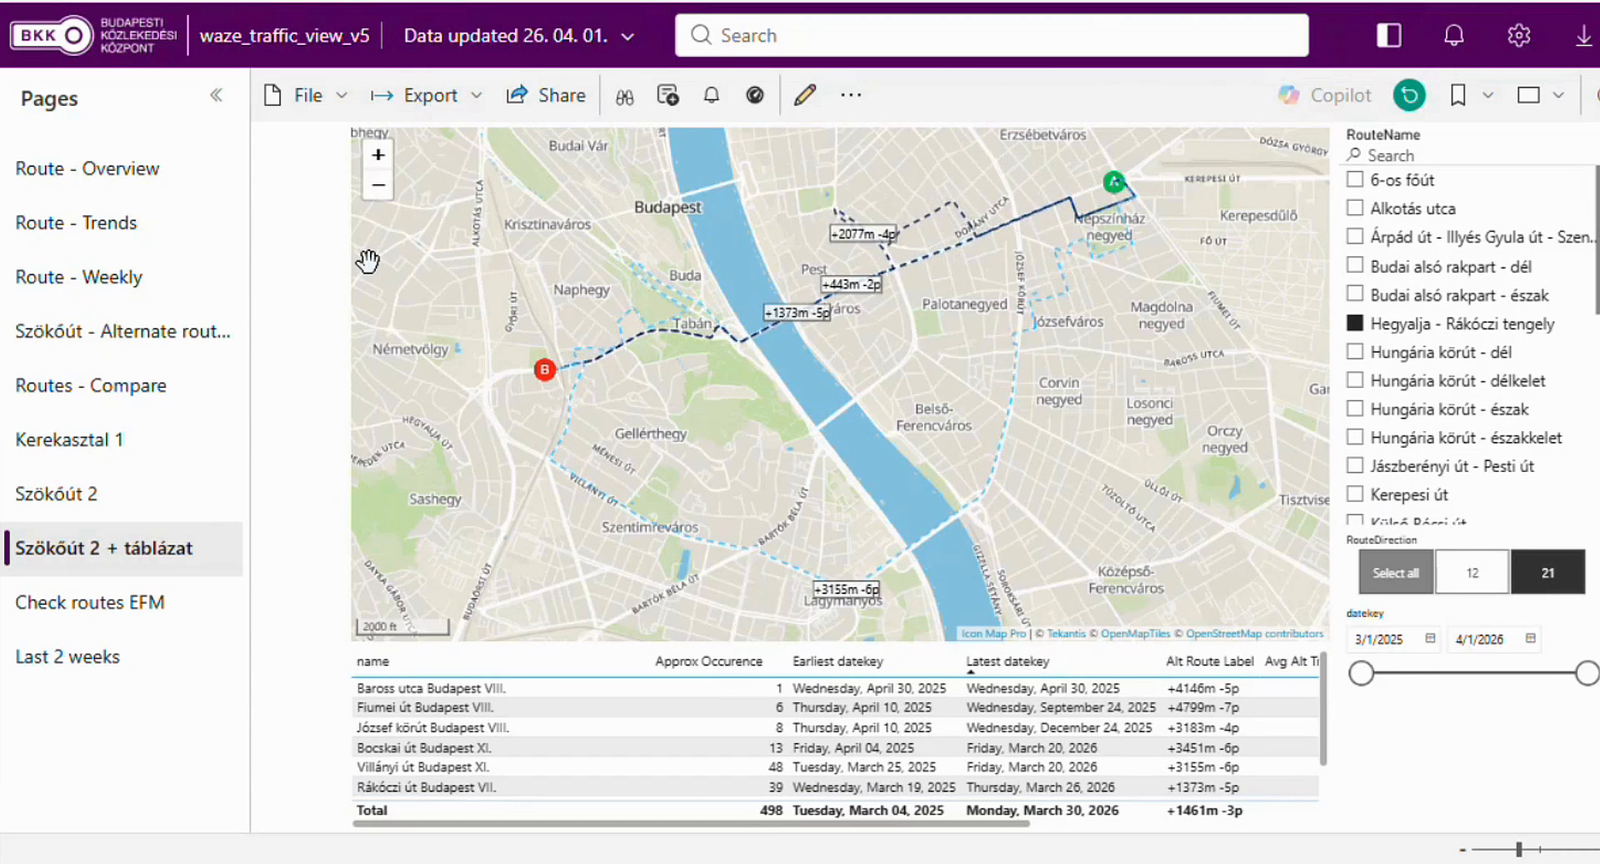
A third example, built by Dávid Bartal, brings in traffic data from Waze, comparing the route people would normally take between two points against the alternatives they actually use when that main corridor is jammed. In one case, a route that looked longer saved around six minutes, with color showing traffic volume and labels showing the time and distance difference, helping the team decide where to avoid pushing car traffic onto smaller residential streets.
Across all of these, the maps are built by data analysts rather than the technical team. "Our team has a pretty strong SQL and Python knowledge," Dániel says, "but we have some data analysts who couldn't do this without Icon Map."
The Results
BKK is candid that it doesn't yet have hard financial figures attached to this work. "We have feelings, but not real numbers," Tamás says, and that's a fair reflection of where things stand. What's clearer is the capability that wasn't there before: two-way filtering, origin and destination views the team simply couldn't build in Azure Maps, and a dataset the size of BudapestGO's rendered and readable in Power BI at all. Just as importantly, that capability now sits with data analysts across the business rather than only with colleagues who know SQL and Python well.
What's Next
BKK's infrastructure team is preparing a report on which streets are due to close or be renovated over the coming year, and unlike most of the organization's internal reporting, this one is intended for BKK's public website. It's a Power BI feature rather than an Icon Map one, but it points to where the team wants its reporting to head next, alongside a wish to bring the currently separate bike, taxi and public transport reports into one combined view.
BKK also maintains its own internal zones that don't line up with the city's official districts and postcodes, and the plan is to bring those in as a custom layer within Icon Map Pro. That sits alongside a wider effort to centralize BKK's geodata, so colleagues currently working in QGIS with their own coordinate systems draw from the same underlying geodatabase instead. For Dániel, the next area of interest is passenger data: visualizing how people actually board different vehicles and routes across the network.