
Icon Map basemap styles
Icon Map Pro includes its own set of basemap styles, hosted by Tekantis. They need no account and no key, and they are the quickest way to put a good-looking map under your data.
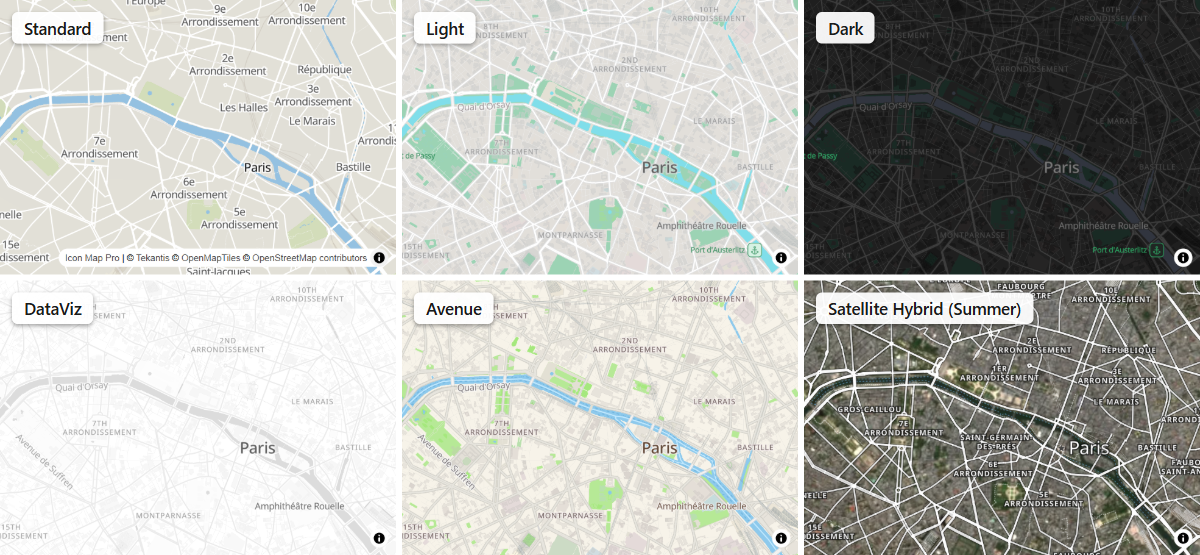
Choose an Icon Map style
On a map that uses the Basemaps dialog: open the dialog, select + Add a basemap, choose Icon Map, tick the styles you want and select the Add button. Star the one the map should open with, then select Apply changes. See The Basemaps dialog.
On a map that uses the Format pane: go to Format pane > Background Layer > Map Source, set Background map source to Icon Map, then choose the style in Icon Map Tiles - Configuration > Layer. See Set the basemap in the Format pane.
Not sure which your map uses? See Basemaps overview.
A map that has never had its basemap changed uses Standard.
The styles
The list of styles is loaded from Icon Map's servers each time the visual starts, so it can change without a new version of the visual. These are the styles available at the time of writing.
| Style | Label languages | 3D buildings |
|---|---|---|
| Standard | Yes | Yes |
| Bright | Yes | No |
| Dark Matter | Yes | No |
| Positron | Yes | No |
| DataViz | Yes | Yes |
| DataViz Gray | Yes | Yes |
| DataViz Black | Yes | Yes |
| Light | Yes | Yes |
| Dark | Yes | Yes |
| Fiord | Yes | No |
| Liberty | Yes | Always on |
| OpenStreetMap | Yes | No |
| Americana | Yes | Yes |
| Toner | Yes | No |
| Natural Earth Standard | Yes | Yes |
| Avenue | Yes | Yes |
| Avenue Pop | Yes | Yes |
| Avenue Bright | Yes | Yes |
| Avenue Saturated | Yes | Yes |
| Avenue Warm | Yes | Yes |
| Avenue Vintage | Yes | Yes |
| Avenue Night | Yes | Yes |
| Avenue B&W | Yes | Yes |
| Avenue Blueprint | Yes | Yes |
| Avenue Ocean | Yes | Yes |
| World Map | No | No |
| (GB only) Ordnance Survey Zoomstack - Light | No | No |
| (GB only) Ordnance Survey Zoomstack - Night | No | No |
| (GB only) Ordnance Survey Zoomstack - Outdoor | No | No |
| (GB only) Ordnance Survey Zoomstack - Road | No | Always on |
| Empty | No | No |
| Satellite (Winter) | No | No |
| Satellite (Summer) | No | No |
| Satellite Hybrid (Winter) | Yes | No |
| Satellite Hybrid (Summer) | Yes | No |
Notes on the table:
- Label languages: Yes means you can choose the language of place names. Other styles have one language.
- 3D buildings: Yes means the style holds building heights and can draw buildings in 3D. Always on means the style always draws them in 3D.
- The Ordnance Survey Zoomstack styles cover Great Britain only.
- World Map and the Ordnance Survey Zoomstack styles have no points of interest or land use to switch on or off.
Label language
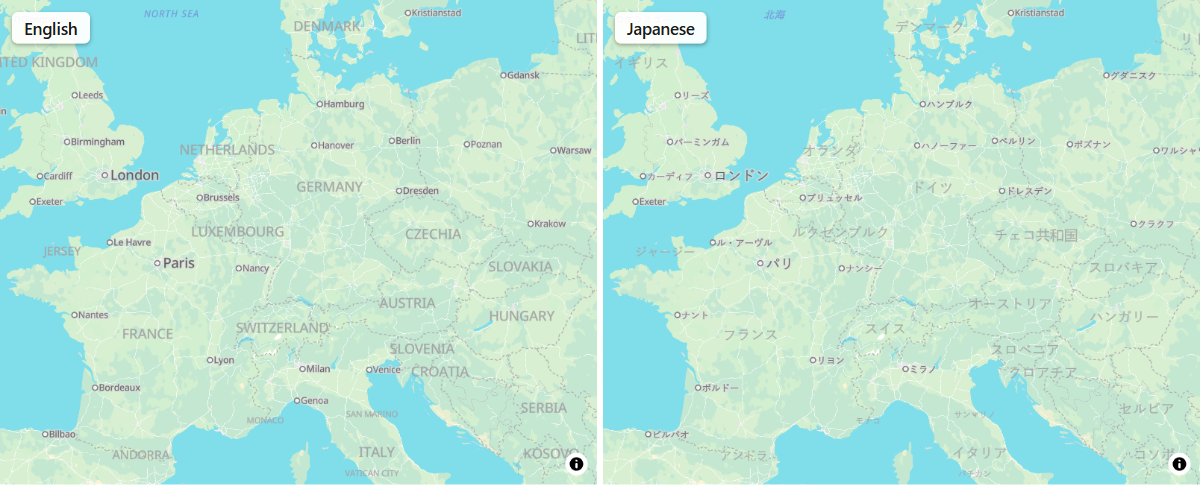
For a style that supports languages, you can choose the language of its place names. The setting starts on Report language: place names follow the language of the Power BI report when it is German, Spanish, French or Portuguese, and are in English otherwise. Choose a language, English included, to use it whatever the report's language. How much of the map follows the setting depends on the style: styles such as Light show every name in that language, while on some styles, such as Standard, country names still appear in the local language when the map is zoomed out.
In the Basemaps dialog, the Language option belongs to each basemap in the list and offers Report language and 25 languages. To offer readers the same style in two languages, use Duplicate and give each copy its own language and name. A style with one language shows "This style has one language."
In the Format pane, Icon Map Tiles - Configuration > Language offers Report language and 41 languages.
3D buildings
Styles with building heights can draw buildings as 3D blocks. They only look 3D when the map is tilted, so set a tilt as well. See View, zoom and projection.
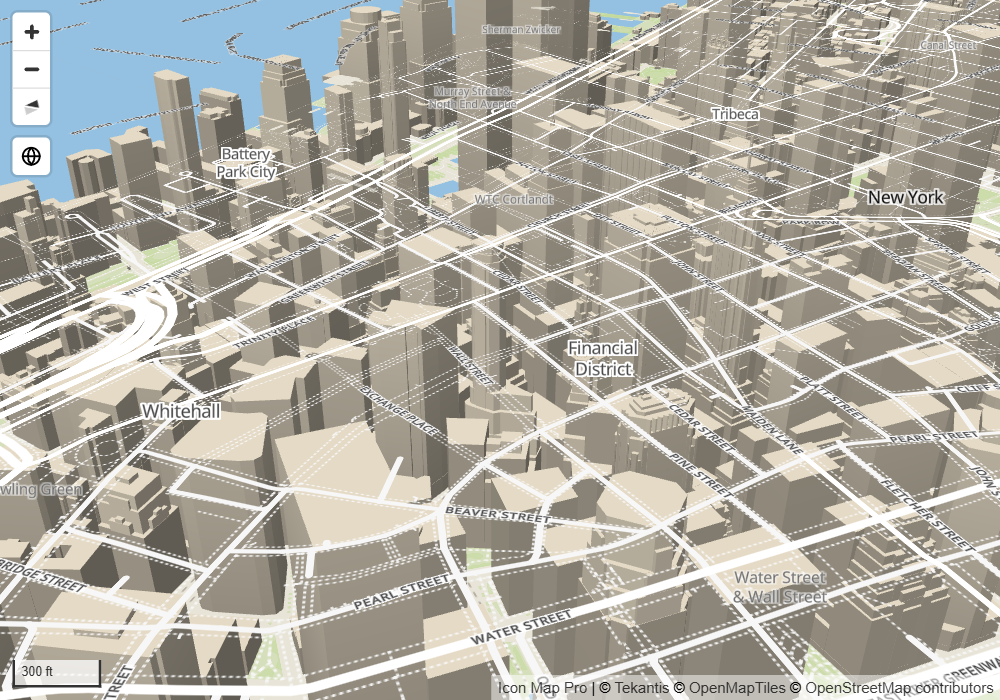
The shading on the buildings follows the map's Light settings. See Terrain, hillshade, sky and lighting.
Display options
Each Icon Map style has the same set of switches for what it shows.
In the Basemaps dialog, select the basemap in the list. The switches are under Options.
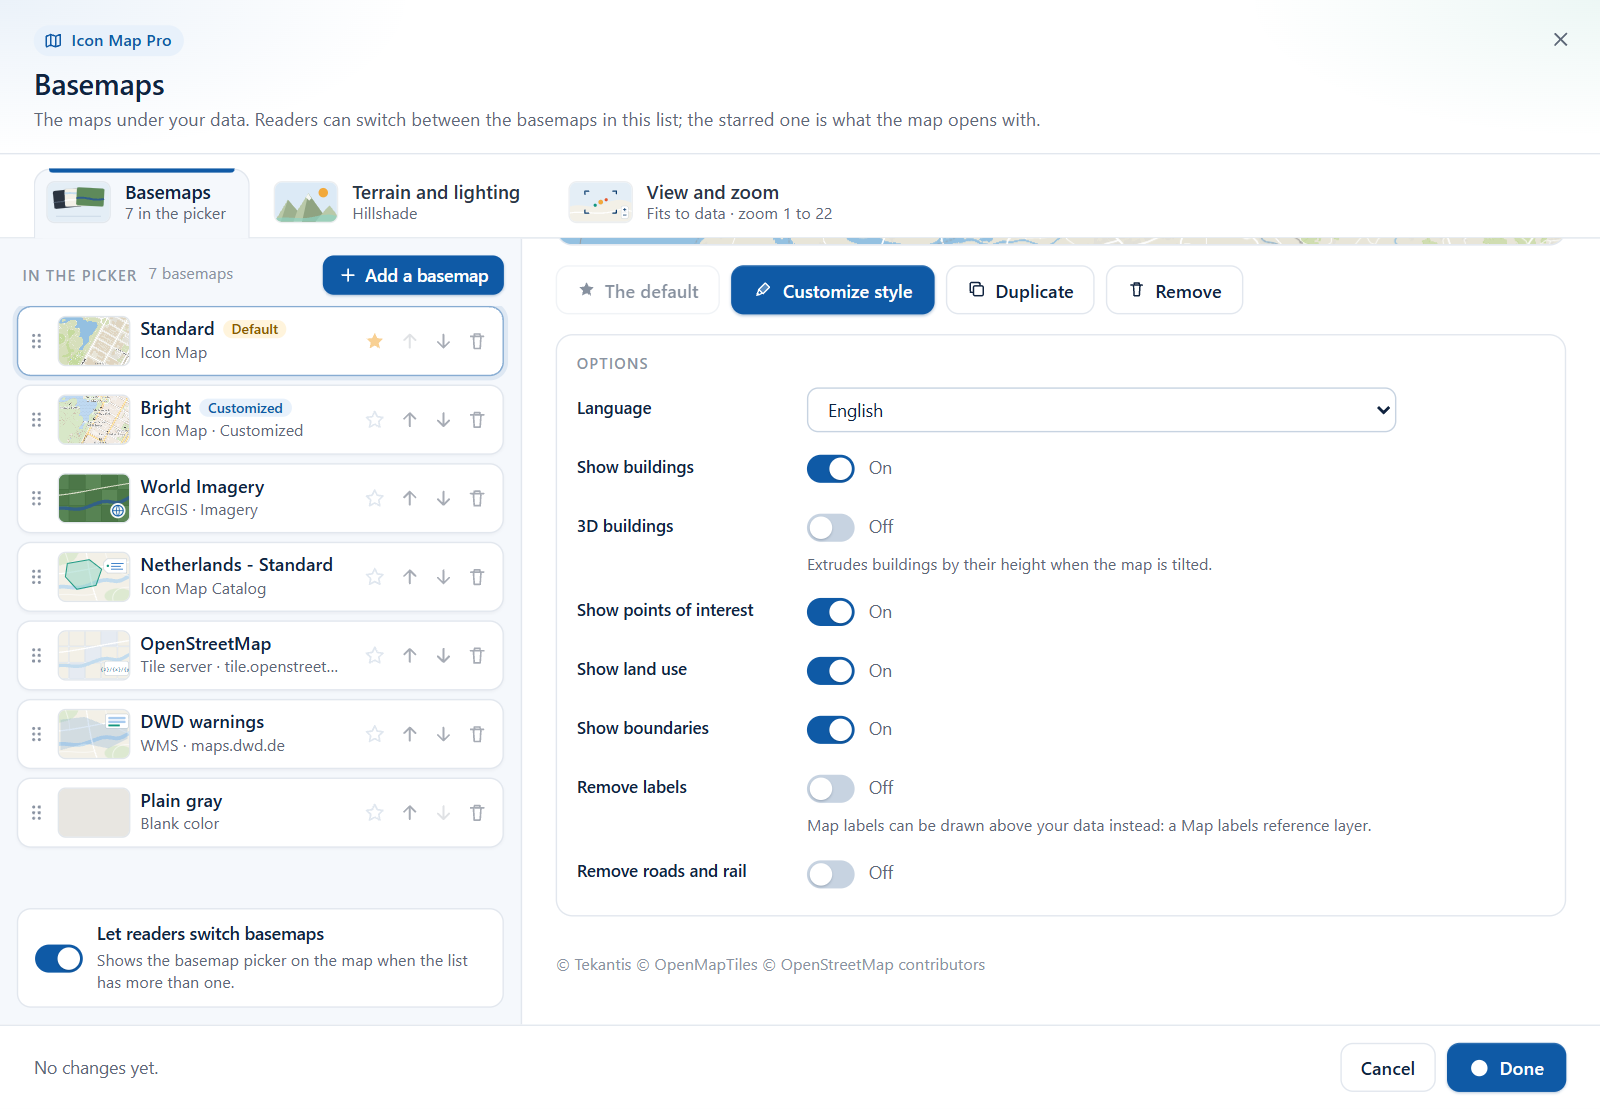
| Option | What it does | Default |
|---|---|---|
| Language | The language of place names. Report language follows the report | Report language |
| Show buildings | Shows building footprints | On |
| 3D buildings | Draws buildings by their height when the map is tilted | Off |
| Show points of interest | Shows points of interest | On |
| Show land use | Shows parks, woodland and other land areas | On |
| Show boundaries | Shows administrative boundaries | On |
| Remove labels | Hides the style's labels | Off |
| Remove roads and rail | Hides roads and rail | Off |
To change anything else about a style, such as its colors, use the style editor. See Customize a basemap style.
In the Format pane, the same switches are in the Icon Map Tiles - Configuration group under slightly different names, together with Override Formatting for the water and land colors and Show Hillshading. They are listed in Set the basemap in the Format pane.
Labels above your data
Basemap labels are drawn under your data, so large shapes can cover them. To draw place names on top, remove the labels from the basemap and add the Map Labels reference layer, which has its own language and color settings. See Map labels on top of your data.
Tips and limits
- Each style shows its own credit line on the map, for example for OpenStreetMap contributors. The satellite styles add a Copernicus Sentinel credit and the Zoomstack styles a Crown copyright line.
- If the style list does not load, check the network can reach Icon Map's servers. See Troubleshooting.
- On a network with no internet access, you can host the styles yourself. See Power BI Report Server (on-premises).