
Selection, cross-filtering and highlighting
Icon Map Pro takes part in Power BI's interactions like any other visual. Select items on the map to filter or highlight the rest of the report page, and select in another visual to filter or highlight the map.
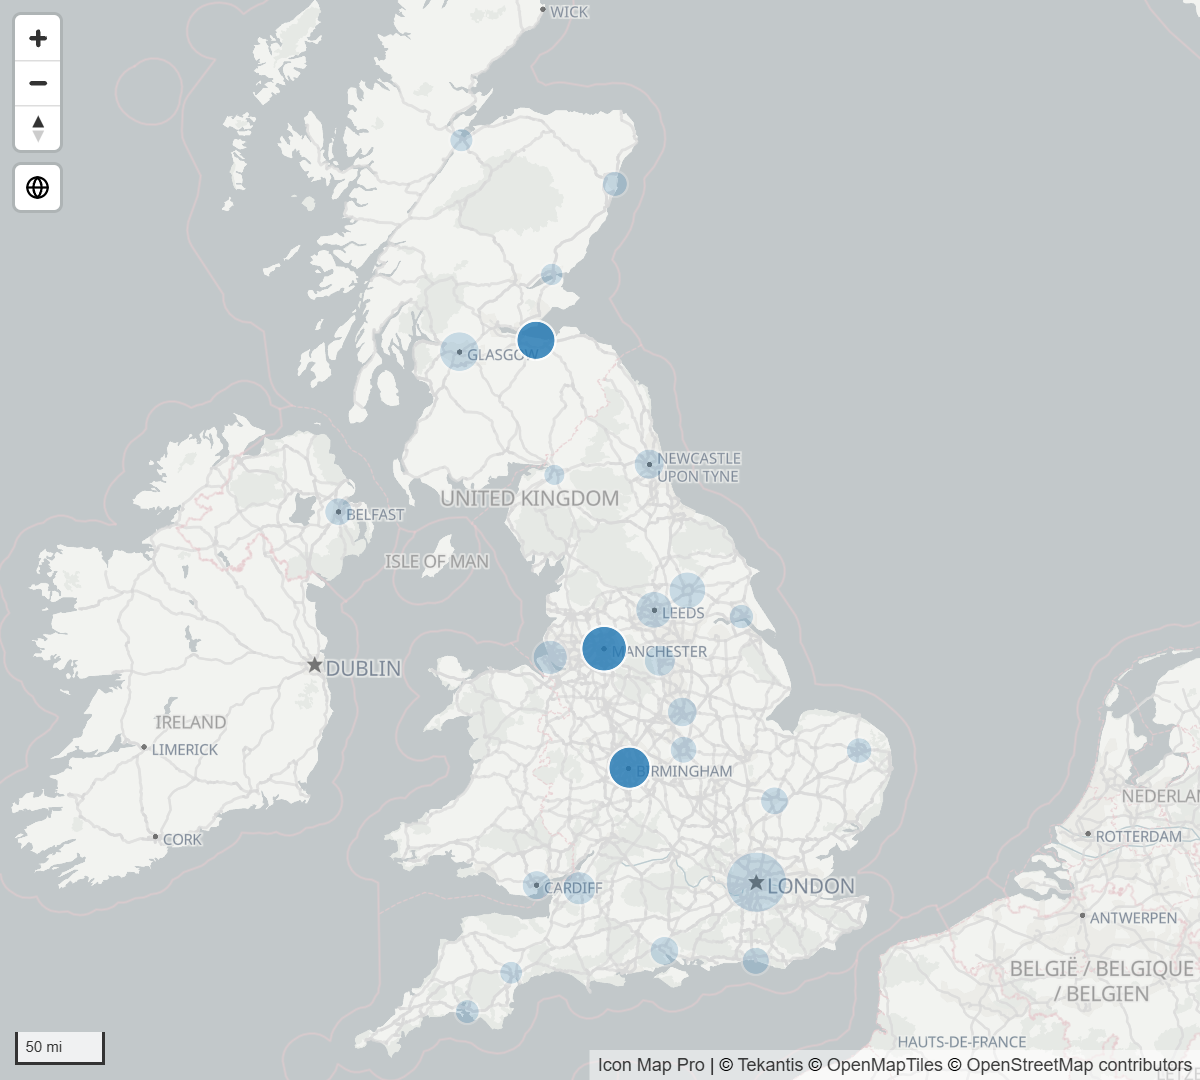
Select items on the map
| To do this | Do this |
|---|---|
| Select one item | Click it. |
| Add to the selection | Hold Ctrl or Shift and click another item. |
| Remove one item from the selection | Hold Ctrl or Shift and click an item that is already selected. |
| Clear the selection | Click the selected item again, or use the Clear All Selections button on the map. |
| Select everything in an area | Use the lasso tool. See Select an area with the lasso. |
The pointer changes to a hand over anything you can select.
The Clear All Selections button is not on the map by default. Switch it on with Format pane > Controls > Controls > Clear Selections Button. See Map controls.
Dragging the map is not a click. If the pointer moves more than a few pixels between pressing and releasing the mouse button, the map pans and nothing is selected.
What you can select
An item can be selected when it comes from a row of your data and its layer allows selection.
| Layer | Selectable | Setting |
|---|---|---|
| Circles, Images and icons, Lines, shapes, Cells | Yes | Selectable: Yes or No. Takes conditional formatting (fx), so some rows can be made unselectable. |
| 3D columns | Yes | Allow Selection: Yes or No. Takes fx. |
| Clusters | Optional | Select on Click (off by default) selects the points in a cluster. Zoom on Click (on by default) zooms in to them instead. |
| Icon Map Catalog layers joined to your data | Yes, when the layer allows selection | Set in the catalog window. |
| Heatmap | No | |
| Shapes in a file that match no row | No | |
| Reference layers | No | Reference layers are not joined to your data. |
An item that stands for several rows selects all of them. Clicking a cell that aggregates 40 points selects those 40 rows, and clicking the cell again clears them.
Select an area with the lasso
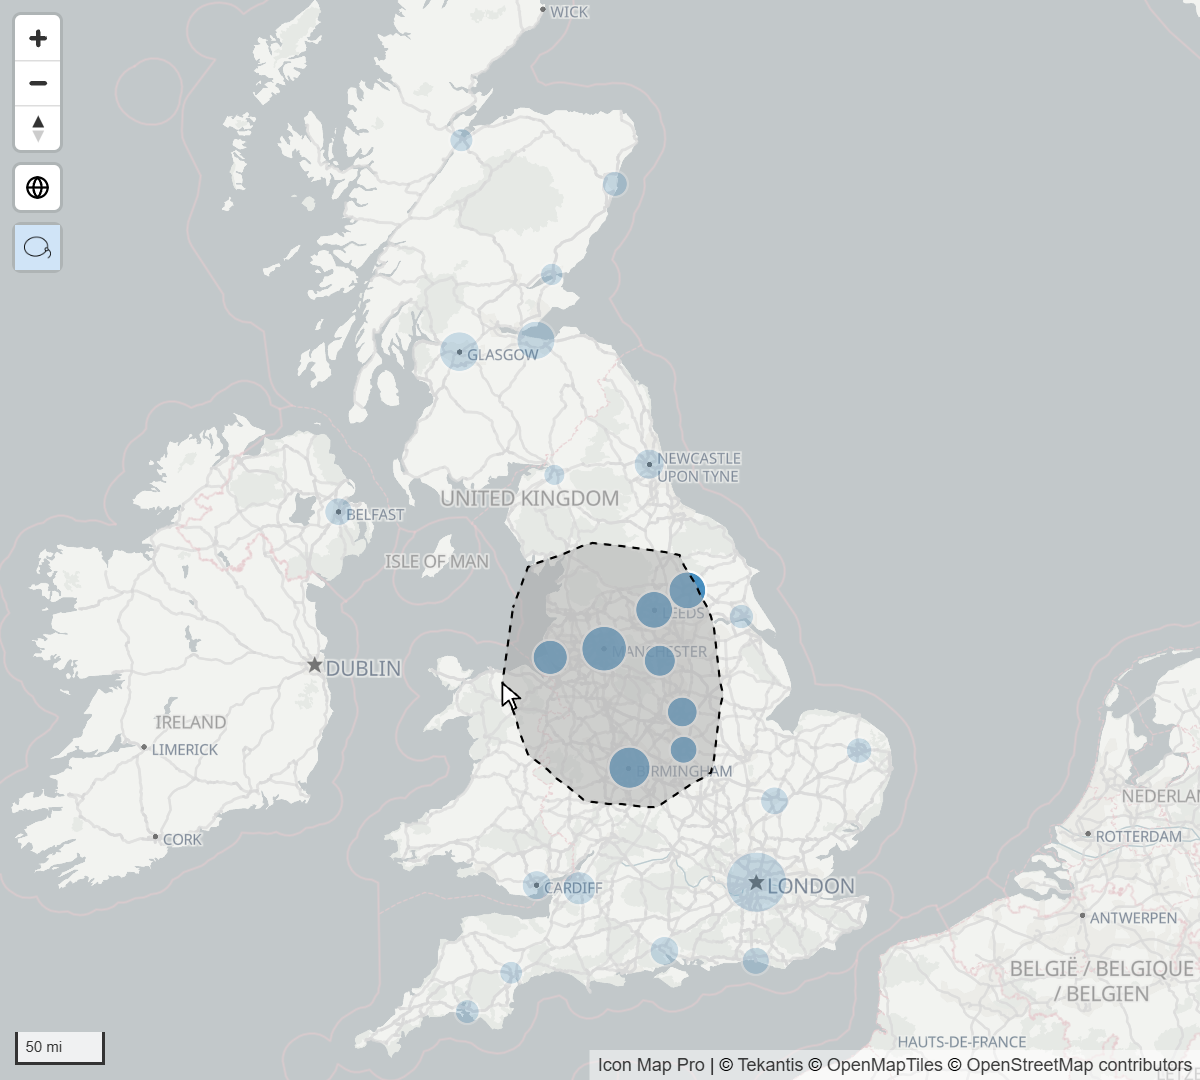
- Switch the tool on: Format pane > Controls > Controls > Lasso.
- On the map, select the Lasso Select Tool button.
- Drag a shape around the items you want. The map does not pan or zoom while you draw.
- Release the mouse button. Everything inside the shape is selected and the tool switches itself off.
Hold Ctrl or Shift while you draw to add to the current selection.
Lasso Mode decides which lines and shapes count:
| Lasso Mode | Selects |
|---|---|
| Intersect or Contain (default) | Lines and shapes that touch the lasso or lie inside it. |
| Fully Contain | Only lines and shapes that lie entirely inside the lasso. |
A point is selected when it is inside the lasso, in either mode. The lasso selects only items that are drawn in the current view.
How selections filter the report
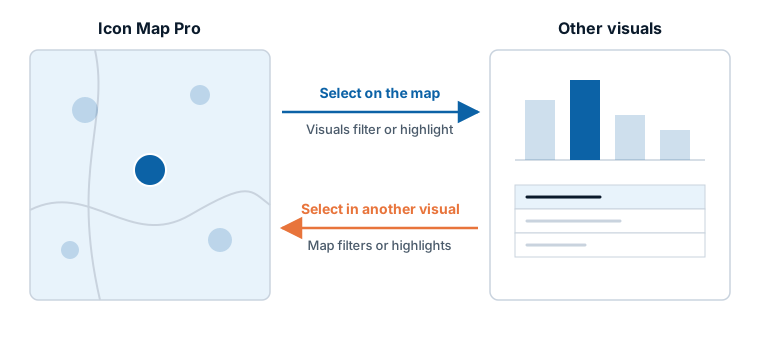
From the map to other visuals
Selecting items on the map selects their rows in Power BI. Every other visual on the page then cross-filters or cross-highlights to those rows. Which of the two happens is a Power BI setting for each pair of visuals: select the map, choose Format > Edit interactions, and pick Filter, Highlight or None on each of the other visuals.
From other visuals to the map
What the map does depends on how the other visual is set to interact with it.
| The other visual | What the map does |
|---|---|
| Cross-filters the map | The map receives only the matching rows and redraws with those. With Auto Zoom on, it zooms to fit them. |
| Cross-highlights the map | The map keeps every item. The highlighted rows stay solid and the rest fade. |
| A slicer or a filter | The same as cross-filtering: the map draws only the rows that remain. |
Selections that Power BI restores, for example from a bookmark, are applied to the map in the same way.
How selected and unselected items look
When a selection or a highlight is active, the map changes the transparency of its items. With nothing selected, each layer uses its own transparency.
| Setting | Applies to | Default |
|---|---|---|
| Selected Items Transparency | The items you selected on the map. | 20 |
| Unselected Items Transparency | Every other data item while a selection is active. | 80 |
| Include Labels | Data labels fade with their items. | On |
| Cross-Highlighted Items Transparency | Items highlighted by another visual. | 20 |
| Unhighlighted Items Transparency | Every other data item while a highlight is active. | 80 |
These are in Format pane > Interactivity, in the groups Item selection and Cross Highlighted Items. A transparency of 0 is solid and 100 is invisible.
Things to know:
- The settings apply to circles, images, lines, shapes, cells, ArcGIS layers bound to data, catalog features joined to a row, and data labels.
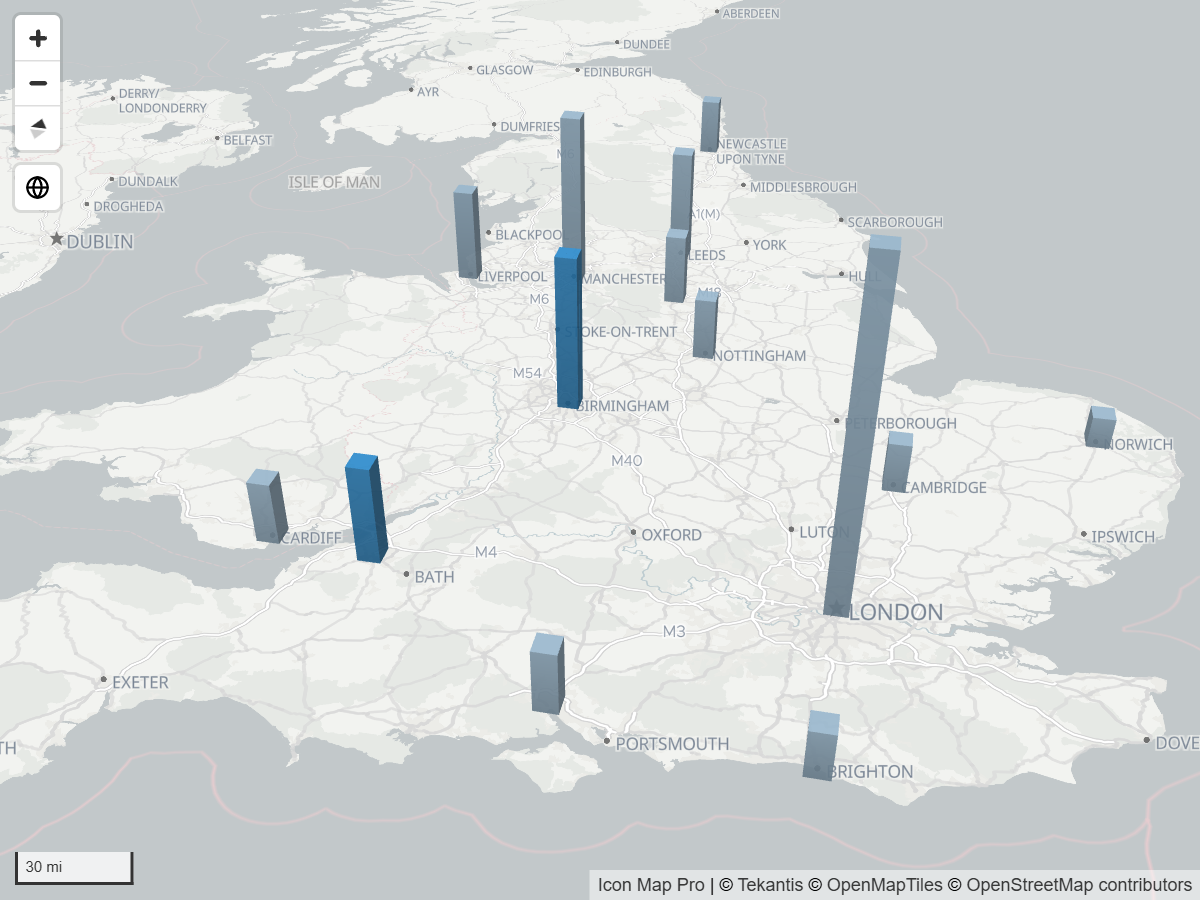
- 3D items (3D columns and extruded cells and shapes) cannot fade one by one. Unselected 3D items turn toward gray instead, and the transparency settings do not apply to them.
- Heatmaps do not change.
- With Label Visibility set to When selected, labels appear for selected and for highlighted items. See Data labels.
Zoom to the selection
The map can move to frame what is selected or highlighted. These settings are in Format pane > Map > Zoom.
| Setting | What it does | Default |
|---|---|---|
| Zoom to Selected Items | After you select on the map, the view fits the selected items. | Off |
| Reset zoom after unselect | When the selection is cleared, the view returns to fit all the data. | Off |
| Zoom to Cross-Highlighted Items | When another visual highlights rows, the view fits the highlighted items. | On |
| Zoom Level When Single Item | The closest the map zooms when exactly one item is selected or highlighted. | 15 |
| Lock Zoom | Stops all of the above. | Off |
Readers can stop the map moving for their own session with the Zoom Lock button, if you switch it on in the Controls card. See View, zoom and projection for the other zoom settings and Map controls for the button.
Drill-down
The ID field well accepts a hierarchy, for example Country, Region, District. Add the fields in order and Power BI shows its drill buttons on the visual header: drill up, drill down, go to the next level, and expand. With drill mode switched on, clicking an item on the map drills into it.
Layers that join your data to shapes can show a different set of shapes at each level. Shapes from files, Vector tiles and ArcGIS layers bound to data each have the setting Display multiple layers as:
| Option | Result |
|---|---|
| Drill-Down (default) | One layer is drawn at a time. Level 1 of the layer is drawn at the top of the hierarchy, level 2 after one drill, and so on, up to 5 levels. |
| Multiple Layers | All the layers are drawn together. |
If you use more than one Feature Reference field, the first is used at level 1, the second at level 2, and so on. A single Feature Reference field is used at every level.
Right-click menu
Right-click a data item to open Power BI's context menu for that row, with the commands Power BI offers for a data point, such as Include, Exclude and Drill through. Right-clicking an empty part of the map opens the visual's general menu.
Clicks on ArcGIS reference layers
Reference layers cannot be selected, but an ArcGIS reference layer can open its ArcGIS pop-up when a feature is clicked. Switch on Pop-up on Click for the layer. It does not affect selection or filtering. See ArcGIS layers.
Tips and limits
- Select on Click on a cluster selects at most the first 100 points of the cluster.
- Items on the map cannot be selected with the keyboard.
- To stop a layer taking part in selection, set its Selectable setting to No. The pointer no longer changes over its items.
- If every row is highlighted by another visual, the map treats that as no highlight and draws normally.