
Shapes from files
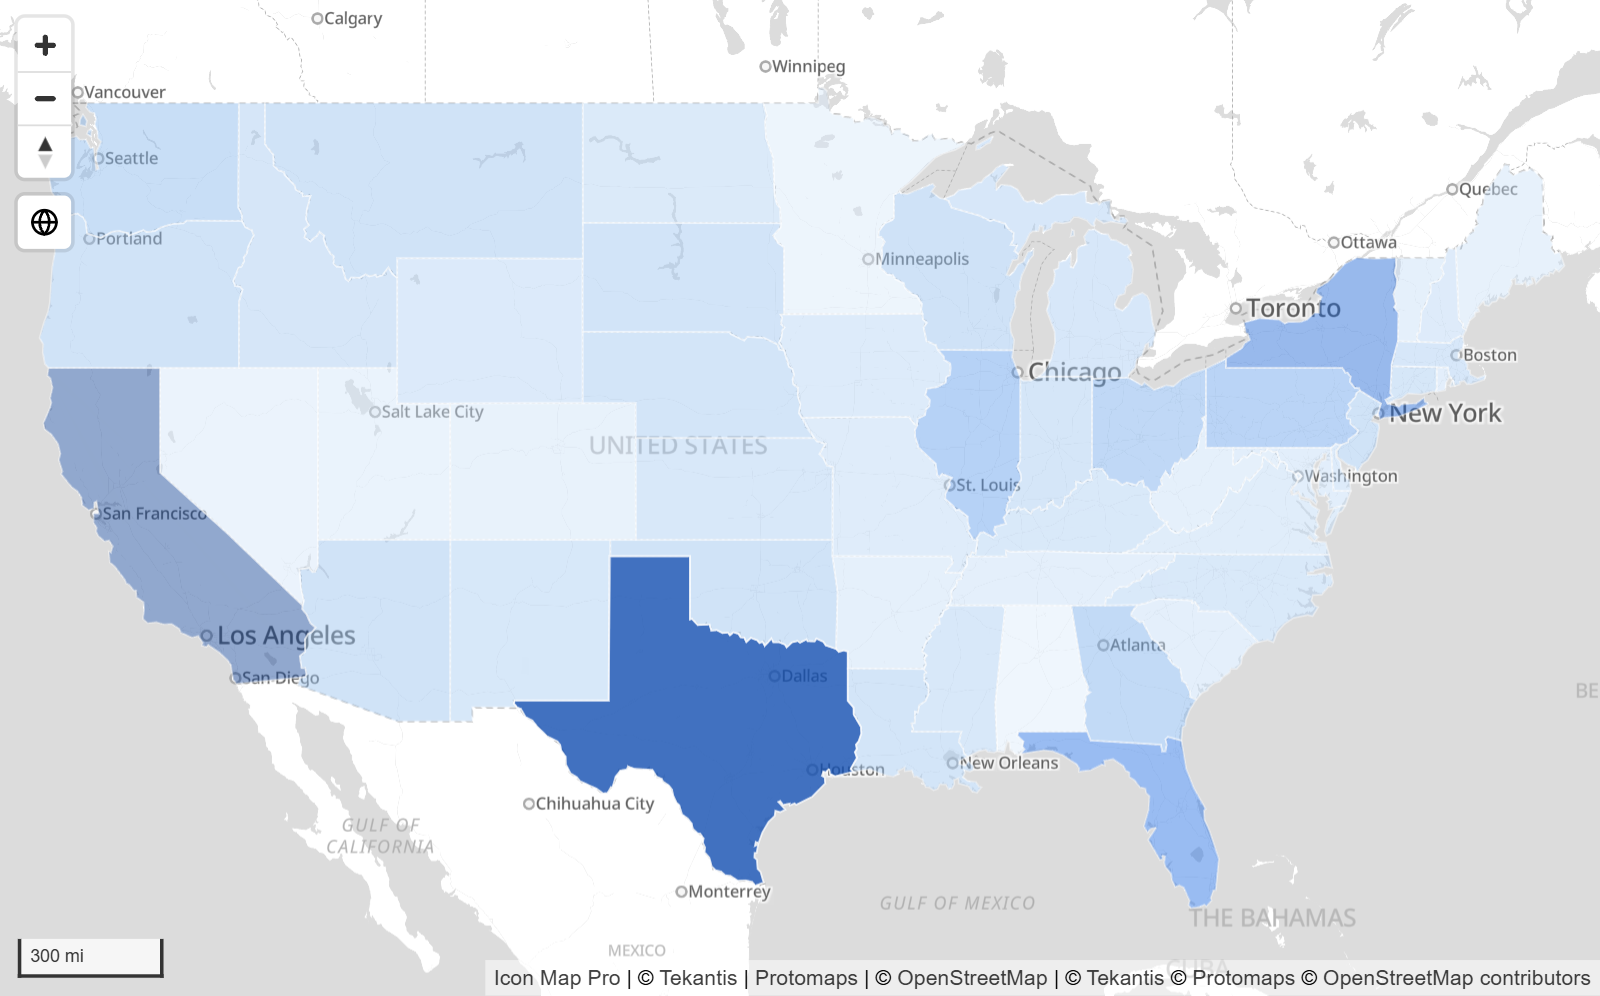
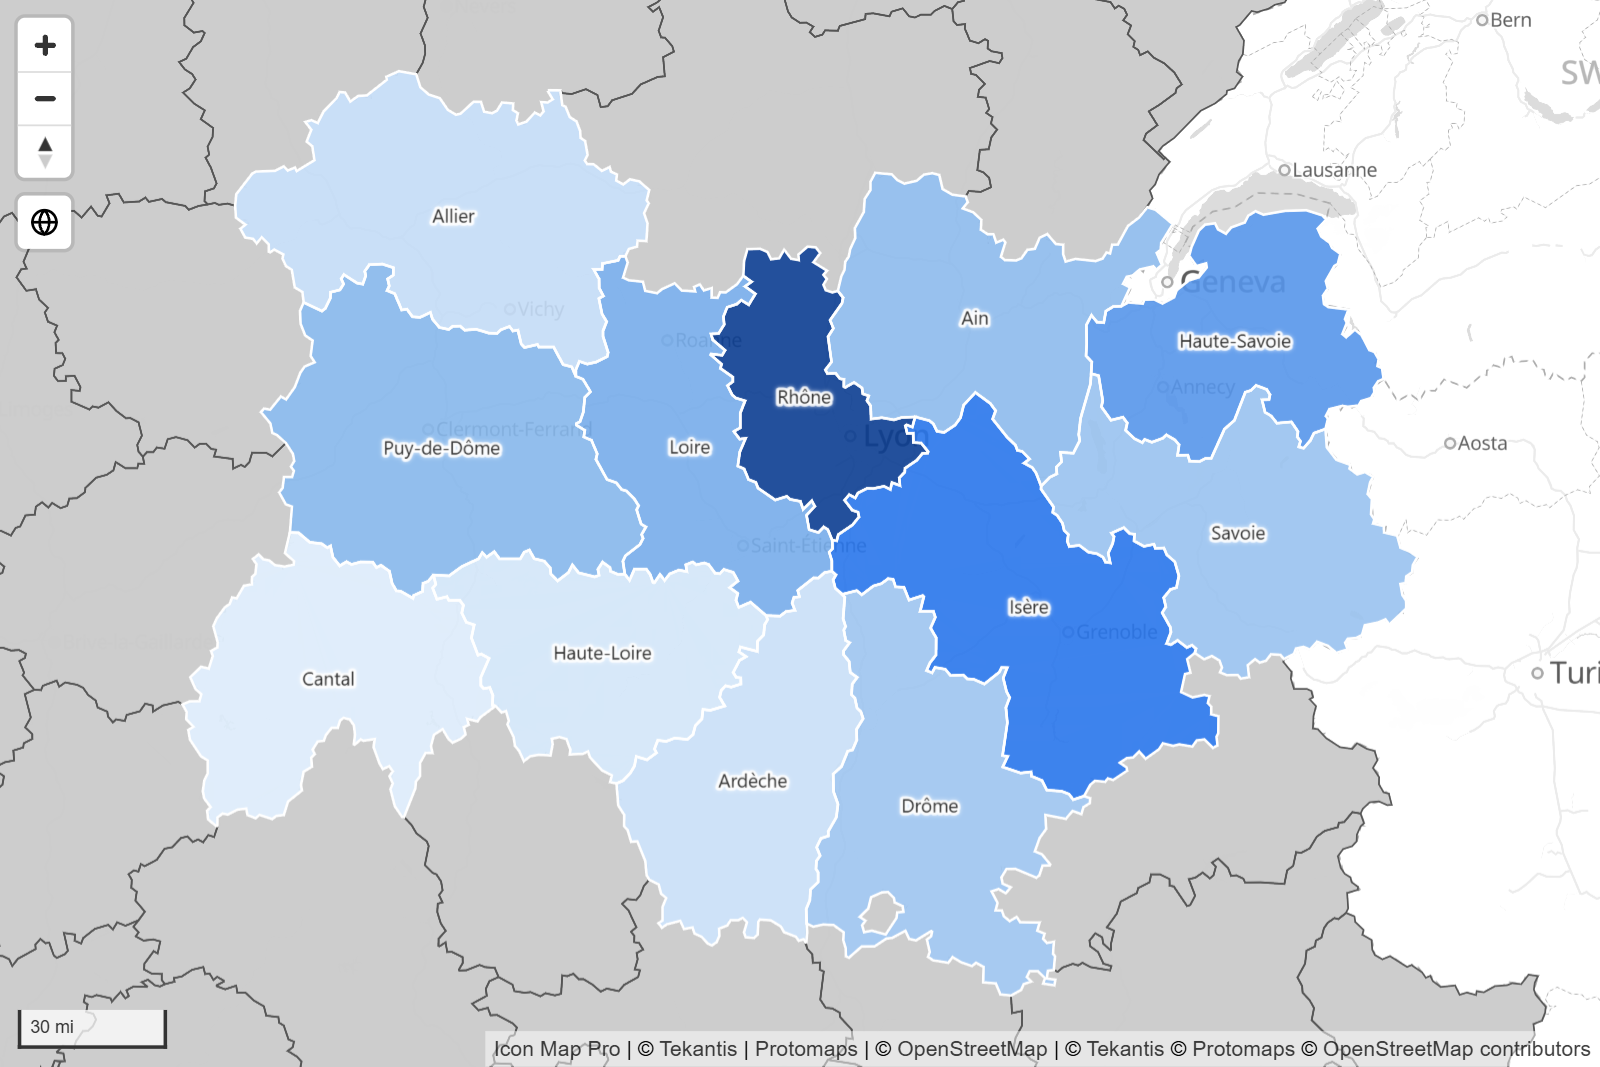
This layer draws the shapes in a file, such as regions, postal areas or sales territories, and joins each shape to a row of your data. Matched shapes take their color from your data, show your tooltips and can be selected. Use it for choropleth maps when you have the boundaries as a file.
What you need
Add these fields to the visual:
| Field well | What to put in it |
|---|---|
| ID | A unique value for each row. |
| Feature Reference | The value that identifies the shape in the file, for example a region code. |
Optional fields:
- Feature Weight - a value used to color the shapes with a gradient, when you are not using conditional formatting.
- Tooltips - the values shown when you point at a shape.
These fields must be empty on the row, otherwise the row belongs to another layer: Image / WKT / GeoJSON, Longitude (X), Latitude (Y), Destination Longitude, Destination Latitude, Circle Size, Heatmap Weight and Cell (H3/S2/A5/Geohash) Weight. See Combine several layers in one map.
You also need the file itself. You can upload it into the report, or link to it. See Upload or link.
How the join works
Every shape in a file carries properties, for example a code and a name. The layer compares the value in Feature Reference with a property of each shape. Where they are the same, the shape is matched to that row.
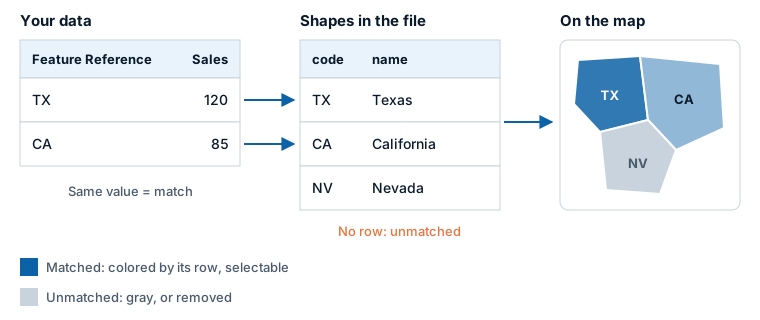
- A matched shape takes the row's formatting, tooltips and data label, and can be selected.
- A shape with no matching row is unmatched. It is drawn in the unmatched colors, or removed if you turn on Remove Unmatched Shapes.
- The comparison is exact.
TXdoes not matchtx, and12does not match012. A stray space in either value stops a match. - If several rows have the same Feature Reference value, the first row is used. If several shapes have the same value, they all take that row's formatting.
The property to compare is set in Property to Match to Feature Reference Field. Left at Any, the layer works it out: it uses a property with the same name as your Feature Reference field if there is one, otherwise the first property whose value matches one of your rows. Naming the property is faster and avoids a match on the wrong property. Property names are case sensitive.
Add the layer
- Add ID and Feature Reference to the visual.
- In the Format pane, open Layer Manager and turn on Open Layer Manager.
- Select Add a layer, then Data layer, then the Shapes (from files) tile.
- In Where is the file?, choose Upload a file or Link to a file or service.
- Upload: set the fill and outline in Style and options, then select Choose a file. The upload window opens. Choose your file, pick the property that matches your data in the Data bind column, and select OK. The Layer Manager comes back when the upload is done.
- Link: paste the
https://link to a GeoJSON file and select Check. Choose the Property to match your data, set the style, then select Add to map and Apply changes.
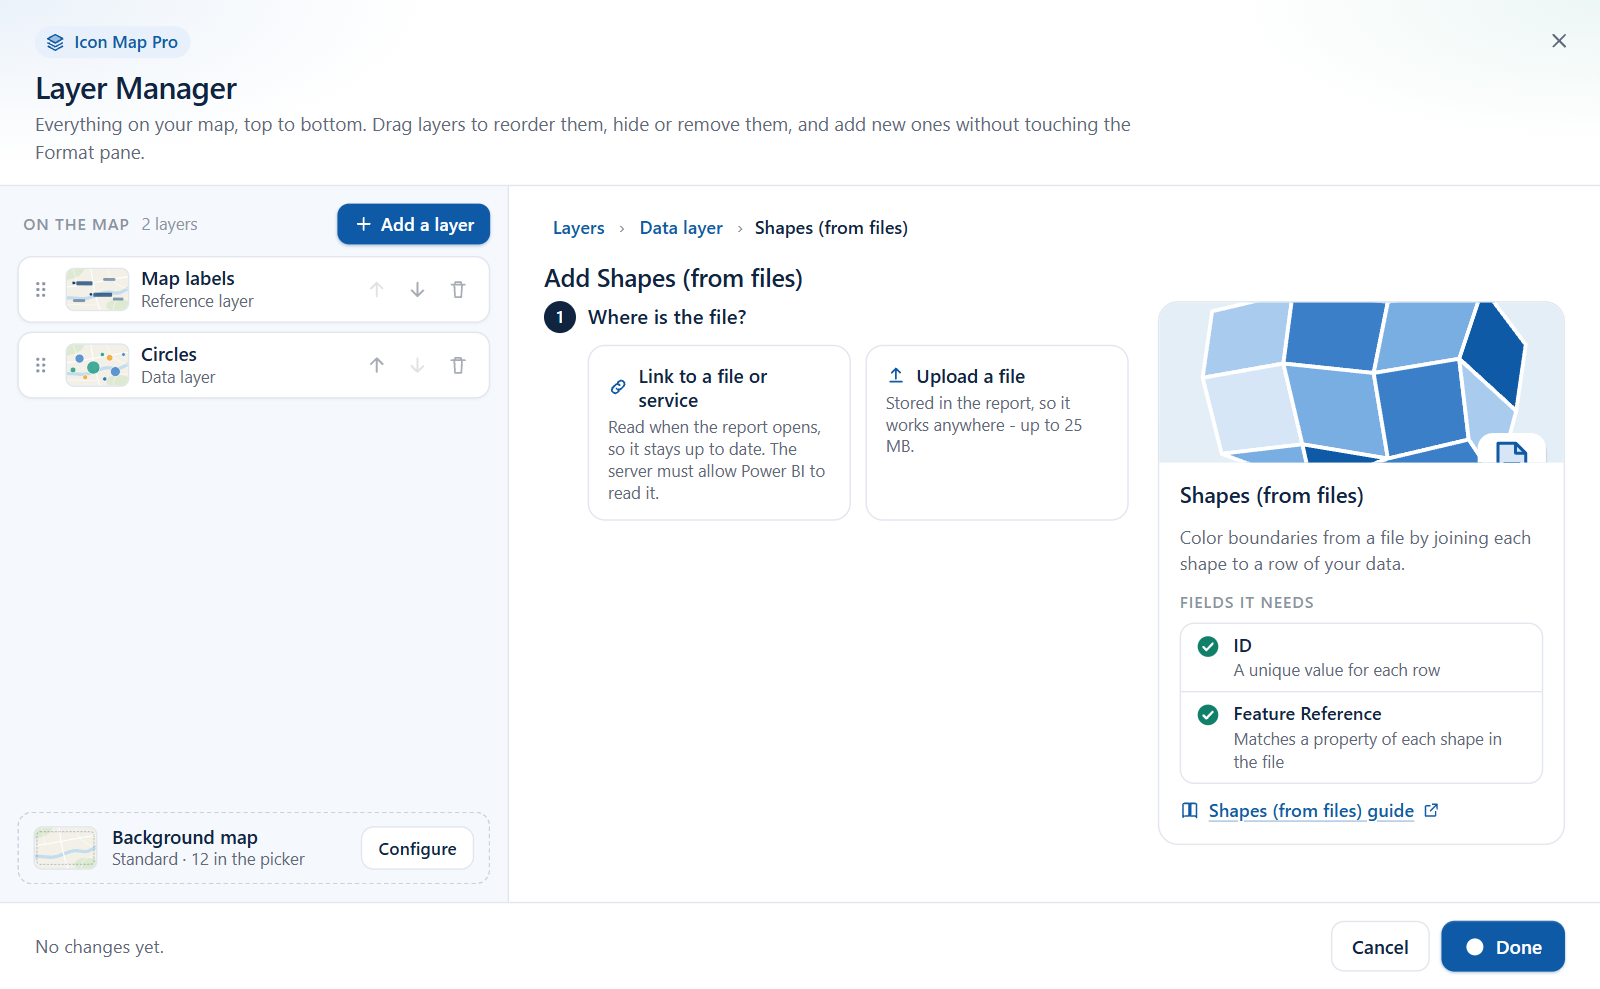
Opening the upload window saves any other changes waiting in the Layer Manager first. You can also pick Shapes (from files) in the "What kind of map are you making?" guide on an empty map. See Add a layer.
To color each shape from your data, select the fx button next to Format pane > Data Layers > Shapes (from files) - Fill Formatting > Fill Color.
Upload or link
| Upload a file | Link to a file | |
|---|---|---|
| Where the file lives | Inside the report. It travels with the report and needs no network. | On a web server. The file is read when the report loads its data, so changes to the file appear in the map. |
| Formats | GeoJSON, TopoJSON, KML, shapefile, IMDF, PMTiles | GeoJSON |
| Simplification | You choose how much to simplify as you upload. | The file is drawn as it is. |
| Needs | Nothing else. | An https:// link, and a server that allows Power BI to read it. |
Format pane > Data Layers > Shapes (from files) - Setup > Source chooses between Uploaded File and URL. It is one setting for all the layer's files.
Files you can upload
| Format | File | Notes |
|---|---|---|
| GeoJSON | .geojson, .json |
A FeatureCollection. |
| TopoJSON | .json |
The first object in the file is read. |
| KML | .kml |
|
| Shapefile | .zip |
The zip must contain the .shp, .dbf and .prj files. |
| IMDF (indoor maps) | .zip |
See Indoor maps. |
| PMTiles | .pmtiles |
A vector tile archive. See PMTiles archives. |
KMZ and CSV files cannot be uploaded to this layer.
Coordinate systems. A shapefile is converted to longitude and latitude using its .prj file. A GeoJSON or TopoJSON file that names its coordinate system in a crs member is converted too. A file with no crs member is taken to be longitude and latitude (WGS84) already. KML is always WGS84.
Size limits
- GeoJSON, TopoJSON, KML and shapefiles: the file can be saved when it is 100 MB or less as uncompressed JSON after simplification. Above that, OK is unavailable and the window shows "File too large to save in the Power BI report. Simplify further or consider using vector tiles or a catalog layer."
- PMTiles: the archive can be at most 25 MB.
Large files slow the report down well before these limits. The upload window suggests a level of simplification that brings the file to 30 MB or less, and a smaller file is better still. For very large boundary sets use Vector tiles or an Icon Map Catalog layer.
The upload window
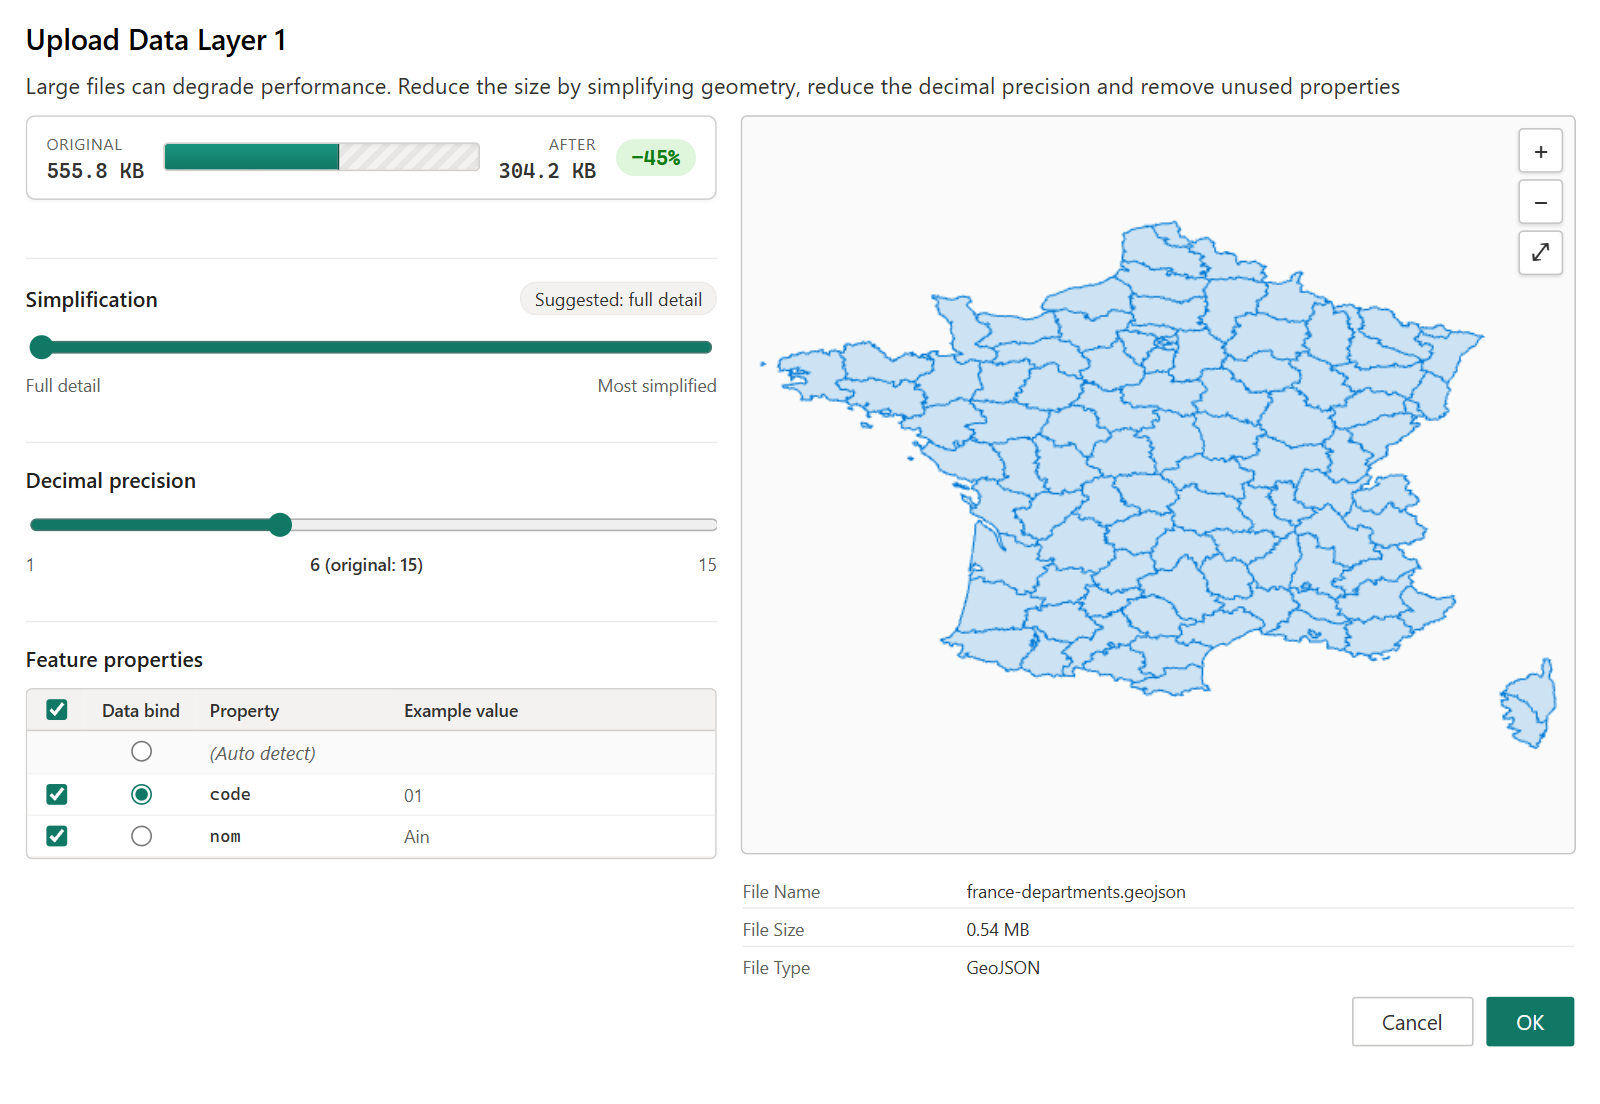
After you drop or choose a file, the window shows a preview that you can zoom and pan, and these controls:
- Simplification - from Full detail to Most simplified. Simplifying removes points from the outlines to make the file smaller. Borders shared by two shapes stay shared. Select the Suggested badge to apply the suggested amount.
- Decimal precision - the number of decimal places kept in each coordinate. Fewer places make a smaller file.
- Feature properties - every property in the file with an example value. Clear the check box of properties you do not need, and they are left out of the stored file. In the Data bind column, pick the property that holds the values in your Feature Reference field, or leave (Auto detect) selected.
- Original and After show the size before and after your choices.
Select OK to store the file in the report. To replace a file, upload another into the same place. Remove existing file in the upload window clears it.
Linking to a file
The link must point to a GeoJSON file on a server that allows Power BI to read it. If the file names a coordinate system in a crs member, it is converted to longitude and latitude. The link accepts conditional formatting, so a measure can supply it.
If the file is on a server that needs an ArcGIS credential, turn on Source is ArcGIS. This is available when the ArcGIS Authentication Type is OAuth2 (Client ID & Secret) or Username & Password. See Connect to ArcGIS.
If the server does not allow Power BI to read the file, download the file and upload it instead.
Color the shapes
From your data with conditional formatting
Leave Fill Color Type on Static / Power BI Conditional Formatting and select the fx button next to Fill Color. You can use a gradient, rules or a field value, as in any Power BI visual. See Conditional formatting. This is the most flexible option, and works for the outline color, transparency and width as well.
From the Feature Weight field
Add a field to Feature Weight and set Fill Color Type to one of these:
- 2 Color Gradient or 3 Color Gradient - shapes are colored between the Start Color, Mid Color and End Color by the Feature Weight value. The range runs from the smallest to the largest value unless you turn on Enter value for start, Enter value for mid or Enter value for end and enter your own.
- Text - shapes are colored by category. Enter up to ten values in Property Value for Fill Color 1 to 10, each with its Fill Color. A shape whose Feature Weight text is one of the values takes that color. The others take the Default Fill Color.
Fill styles, points and 3D
- Fill Style can be Solid, Hatched (diagonal stripes, with Hatch Width) or Pattern (a pattern from the library opened with Show Pattern Library, or an image URL in Pattern / Image URL).
- Point features in the file are drawn as circles. Circle Size sets the radius in pixels.
- Line features are drawn with the outline color, width and transparency.
- Polygon Extrusion Height raises matched polygons into 3D blocks, in meters. It accepts conditional formatting, so the height can come from a measure. Tilt the map to see the height.
Unmatched shapes
Shapes with no matching row are drawn with the settings in Shapes (from files) - Unmatched Formatting, gray by default. They cannot be selected. With Override formatting for unmatched turned off, an unmatched shape that carries its own fill color in the file keeps that color. Turn on Remove Unmatched Shapes to hide them altogether.
Drill down between files
A shapes layer can hold up to five files. Display multiple layers as in Shapes (from files) - Setup decides how they are used:
- Drill-Down - one file is on the map at a time, and Power BI's drill buttons move between them.
- Multiple Layers - all the files are drawn together.
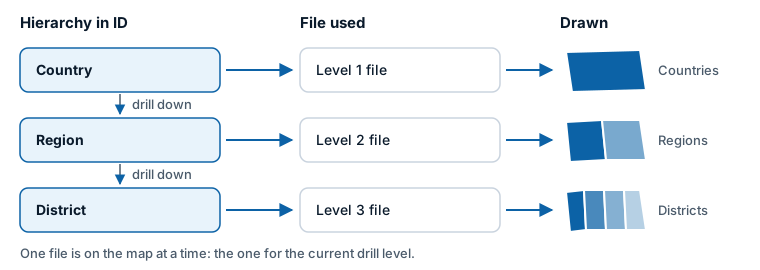
To set up drill-down:
- Put a hierarchy in the ID field well, for example Country, then Region, then District.
- In Shapes (from files) - Setup, leave Display multiple layers as on Drill-Down and set Number of Drill-down Levels to the number of levels.
- Choose a level in Apply settings to:. The groups below then show that level's settings. Upload or link its file, and set its property to match and its formatting.
- Repeat for each level.
When a report user drills down, the map switches to the file for that level. Level 1 is used at the top of the hierarchy, level 2 after drilling once, and so on. Each level has its own file, property to match, formatting and tooltip settings.
For Feature Reference, either add one field that holds the right key at every level, or add one field for each level in the same order as the hierarchy. With several fields, the first is used at level 1, the second at level 2, and so on.
With links, a level that has no link of its own uses the link of level 1.
Several files at once
Set Display multiple layers as to Multiple Layers and set Number of Layers. Each layer has a Feature Reference Field setting that picks which of your Feature Reference fields it is joined to, and its own Z-Index for the drawing order. A row is drawn when it has a value in the Feature Reference field of at least one layer.
In the Layer Manager, adding a second Shapes (from files) layer to a map with one file switches the layer to Multiple Layers. A map already set up for drill-down keeps drill-down, and the new file becomes the next level.
PMTiles archives
A PMTiles archive holds shapes as vector tiles, already simplified for each zoom level. Uploading one lets you store much more detailed boundaries in a report than a GeoJSON file of the same size.
- The archive can be at most 25 MB and must hold vector features, not images.
- In the upload window, choose the Layer to use. An archive can hold several layers, and one is drawn for each uploaded archive. Then choose the Property to match on, or leave Any property.
- There is no simplification or precision control, because the archive is already simplified.
- When matching, spaces around the values are ignored.
- The map zooms to the matched shapes, not to the whole archive.
For archives larger than 25 MB, host the archive and use the Vector tiles layer.
Indoor maps (IMDF)
An IMDF archive is a zip that describes the inside of a building: units, walls, openings, fixtures, levels and amenities. It is imported at full precision, with no simplification. When the file has more than one level, a level picker appears on the map so report users can choose a floor. The shapes keep the file's own colors.
Selection, tooltips and labels
- Click a matched shape to select its row and cross-filter the rest of the report. Hold Ctrl to add to the selection. The shapes you did not select fade to 80% transparency by default, set by Unselected Items Transparency in the Interactivity card. See Selection, cross-filtering and highlighting.
- Pointing at a matched shape shows the fields in Tooltips and the Feature Weight. Add Property to Tooltip adds the matched property. Add All Properties to Tooltip adds every property of the shape.
- Add Tooltips to Unmatched Shapes shows the file's properties on unmatched shapes. Turn on one of the two settings above as well, so there is something to show.
- Matched shapes can carry a data label. See Data labels.
- The map zooms to the matched shapes whose rows have Include in Auto Zoom set to Yes.
Settings
All settings are in Format pane > Data Layers. With more than one level or layer, the group titles include the level or layer number, and the groups show the one chosen in Apply settings to:. Settings marked fx accept conditional formatting.
Shapes (from files) - Setup
| Setting | What it does | Default |
|---|---|---|
| Display multiple layers as | Drill-Down or Multiple Layers. | Drill-Down |
| Number of Drill-down Levels / Number of Layers | How many files, 1 to 5. | 1 |
| Source | URL or Uploaded File, for all levels or layers. | Uploaded File |
| Apply settings to: | The level or layer that the groups below edit. With uploaded files, each entry shows the file name. | 1 |
Shapes (from files) - Configuration
| Setting | What it does | Default |
|---|---|---|
| File or Service Link | The link to the file. Shown when Source is URL. fx | Empty |
| Setting | What it does | Default |
|---|---|---|
| Source is ArcGIS | Sends your ArcGIS credential with the request. Shown when Source is URL. | Off |
| Display File Upload Button | Opens the upload window. Shown when Source is Uploaded File. | Off |
| Feature Reference Field | Which Feature Reference field this layer is joined to. Shown in Multiple Layers mode. | First field |
| Property to Match to Feature Reference Field | The property of each shape that is compared with your Feature Reference value. Any checks every property. | Any |
| Remove Unmatched Shapes | Hides shapes with no matching row. | Off |
| Minimum Zoom | The layer is hidden when the map is zoomed out past this level. | 0 |
| Maximum Zoom | The layer is hidden when the map is zoomed in past this level. | 24 |
| Z-Index | Position in the drawing order. Layers with a higher value draw on top. | 360 |
| Visible | Shows or hides the level or layer. With conditional formatting, a measure can switch it on and off. fx | Yes |
| Add Property to Tooltip | Adds the matched property to the tooltip. | Off |
| Add All Properties to Tooltip | Adds every property of the shape to the tooltip. | Off |
| Add Tooltips to Unmatched Shapes | Shows tooltips on unmatched shapes. | Off |
| Include Tooltip | Shows tooltips on matched shapes. fx | Yes |
| Include in Auto Zoom | Includes matched shapes when the map zooms to fit your data. fx | Yes |
| Selectable | Lets report users select shapes. fx | Yes |
| Circle Size | Radius in pixels of point features in the file. fx | 5 |
| Polygon Extrusion Height | Height to extrude polygons, in meters. fx | 0 |
Shapes (from files) - Fill Formatting
| Setting | What it does | Default |
|---|---|---|
| Fill Color Type | Static / Power BI Conditional Formatting, 2 Color Gradient, 3 Color Gradient or Text. | Static / Power BI Conditional Formatting |
| Fill Color | The fill color. Shown for the static type. fx | Theme color |
| Default Fill Color | The color for shapes with no usable Feature Weight. Shown for the other types. | Theme color |
| Start Color, Mid Color, End Color | The gradient colors. Mid Color is shown for 3 Color Gradient. | Theme colors |
| Enter value for start, Start Value | Sets the value for the start of the gradient yourself. | Off, 0 |
| Enter value for mid, Mid Value | Sets the value for the middle of the gradient yourself. | Off, 50 |
| Enter value for end, End Value | Sets the value for the end of the gradient yourself. | Off, 100 |
| Fill Color 1 to Fill Color 10 | The colors for Text. | Theme colors |
| Property Value for Fill Color 1 to 10 | The Feature Weight text that takes each color. | Empty |
| Fill Transparency | 0 is solid, 100 is invisible. fx | 1 |
| Fill Style | Solid, Hatched or Pattern. fx | Solid |
| Hatch Width | Width of the stripes, 1 to 10. Shown for Hatched. fx | 1 |
| Pattern / Image URL | The pattern or image for Pattern. fx | Empty |
| Show Pattern Library | Opens the pattern library so you can pick a pattern. | Off |
Shapes (from files) - Outline Formatting
| Setting | What it does | Default |
|---|---|---|
| Outline Color | The outline color, and the color of line features. fx | Theme color |
| Outline Transparency | 0 is solid, 100 is invisible. fx | 1 |
| Outline Width | Width in pixels, 0 to 100. fx | 1 |
Shapes (from files) - Unmatched Formatting
| Setting | What it does | Default |
|---|---|---|
| Override formatting for unmatched | Uses the settings below for every unmatched shape, in place of any color the file carries. | On |
| Unmatched Fill Color | Fill color of unmatched shapes. | #CCCCCC |
| Unmatched Outline Color | Outline color of unmatched shapes. | #555555 |
| Unmatched Fill Transparency | 0 is solid, 100 is invisible. | 1 |
| Unmatched Outline Transparency | 0 is solid, 100 is invisible. | 1 |
| Unmatched Outline Width | Width in pixels, 0 to 100. | 1 |
In the Layer Manager
Each file is a row in the Layer Manager, named after the file or link. Select the row to change:
- Source - File or service link, Property to match your data and Hide shapes with no matching row. Replace the link or file swaps the source and keeps the layer's place and style.
- Style - Fill, Outline and Outline width, used when the layer has no color from your data.
- On the map - Visible, Visible at zoom and Every property in the tooltip.
The eye button hides a file without removing it. Only the last file can be removed with the bin button. Files before it can be hidden. See Edit, reorder and remove layers.
Tips and limits
- Nothing is colored. The Feature Reference values do not match the property. Check the case, leading zeros and stray spaces, and set Property to Match to Feature Reference Field to the right property.
- Keep files small. Simplify as far as the map still looks right at the zoom levels you use. It is the biggest single improvement to the speed of a shapes map.
- One row for each shape. If your data has several rows for a shape, summarize them so each Feature Reference value appears once.
- Up to five files, and one layer from each PMTiles archive.
- Dash patterns for outlines are part of the Legacy engine, see the documentation for 1.1.0.9 and earlier.