
Lines
The Lines layer draws a connection from an origin to a destination for every row of your data. Use it for flights, shipments, journeys, migration, network links and any other movement between two places.
What you need
Each row is one line. Add these fields to the visual:
| Field well | What to put in it |
|---|---|
| ID | A unique value for each line. |
| Longitude (X) | The origin longitude. |
| Latitude (Y) | The origin latitude. |
| Destination Longitude | The longitude of the point the line runs to. |
| Destination Latitude | The latitude of the point the line runs to. |
The four coordinate field wells take one numeric field each. Power BI summarizes them for each ID, so choose a summarization that returns the coordinate itself, such as Average.
Optional fields:
- Tooltips - the values shown when you point at a line.
- Circle Size - only if you want a circle at the ends of each line (see Circles at the ends).
These fields must be empty on a line's row, otherwise the row belongs to another layer and no line is drawn: Feature Reference, Image / WKT / GeoJSON, Heatmap Weight and Cell (H3/S2/A5/Geohash) Weight. See Combine several layers in one map.
There is no field well for the line's weight, color or route name. Set Weight for Flow, Color, Width and Route Name from your data with conditional formatting (fx).
Add a lines layer
- Add the five fields above to the visual.
- In the Format pane, open Layer Manager and turn on Open Layer Manager.
- Select Add a layer, then Data layer, then the Lines & flows tile.
- In Style and options, choose a style, a Color, a Width and the zoom range in Visible at zoom.
- Select Add to map, then Apply changes.
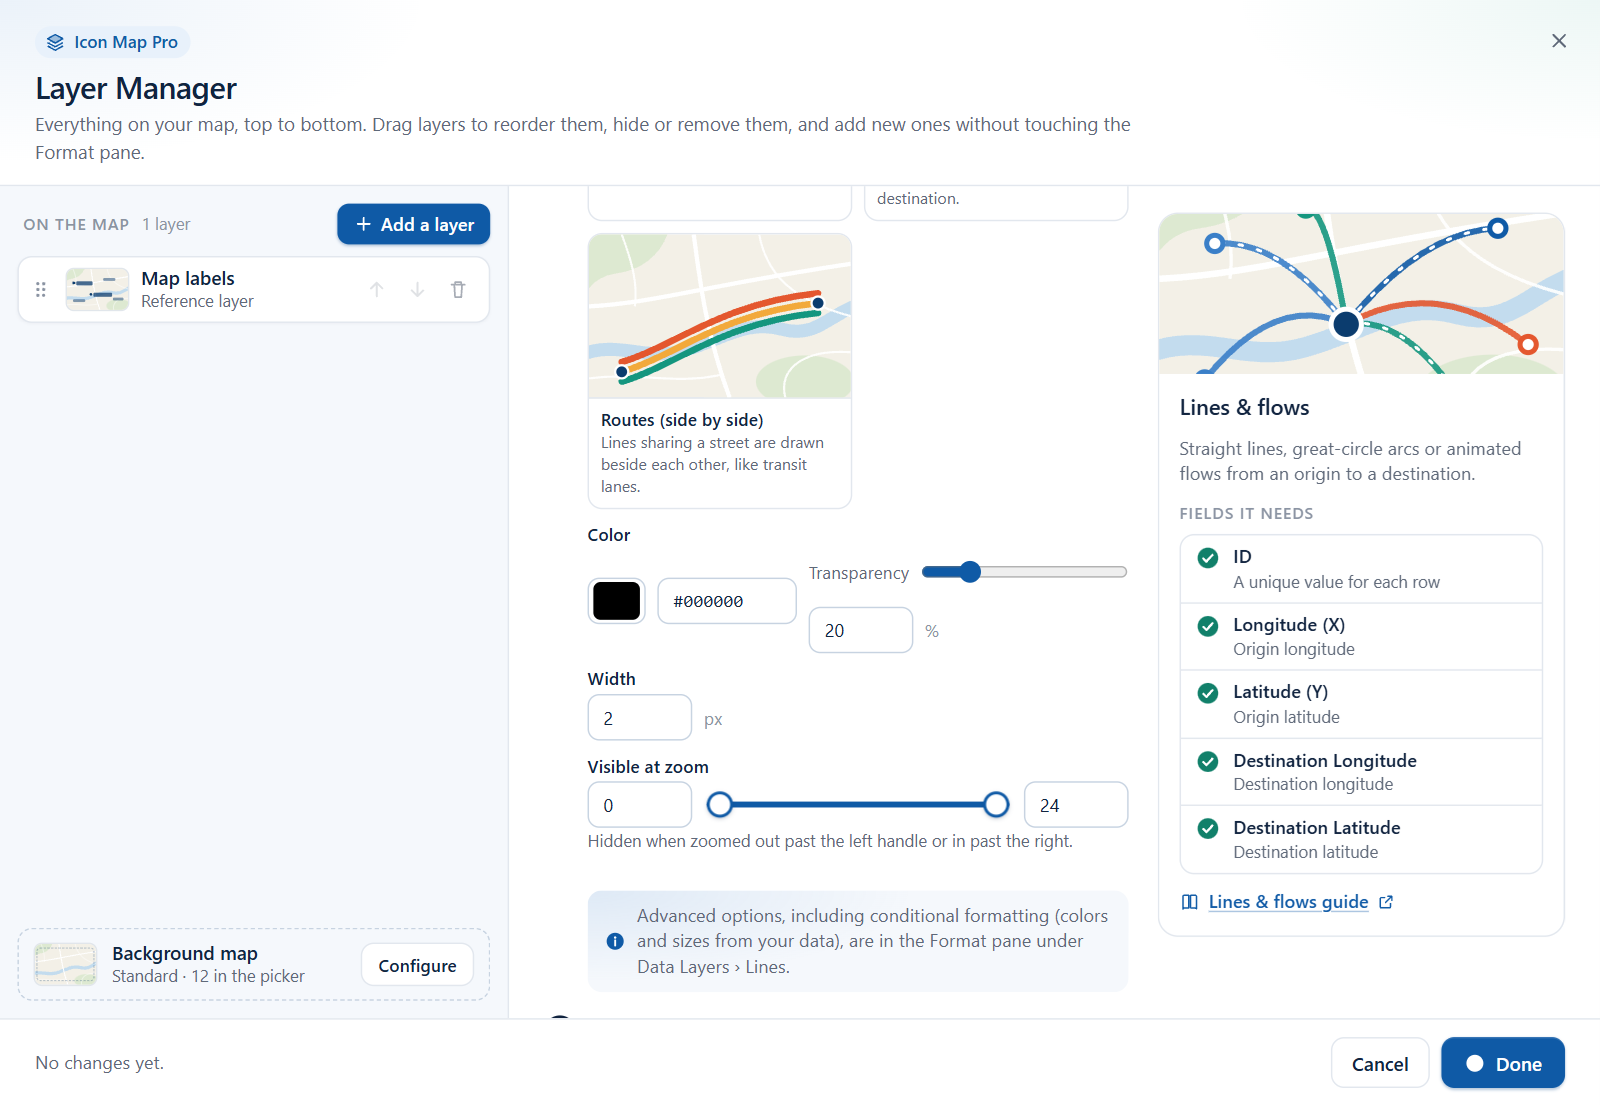
You can also pick Lines & flows in the "What kind of map are you making?" guide that appears on an empty map. It turns the layer on and opens the Layer Manager on it.
The Layer Manager covers the style, color, width and zoom range. To choose a line shape by its exact name, and for every other option on this page, use Format pane > Data Layers > Lines - Formatting. See Add a layer for the wizard in detail.
Line shapes
Format pane > Data Layers > Lines - Formatting > Line Shape decides how each line is drawn and which of the other settings apply. The list is sorted alphabetically in your report language.
| Line Shape | What it draws | Width comes from |
|---|---|---|
| Straight | A straight line on the map. | Width |
| Shortest | The great-circle path, the shortest route over the globe. | Width |
| 3D Arcs | Arcs that rise off the map. | Width |
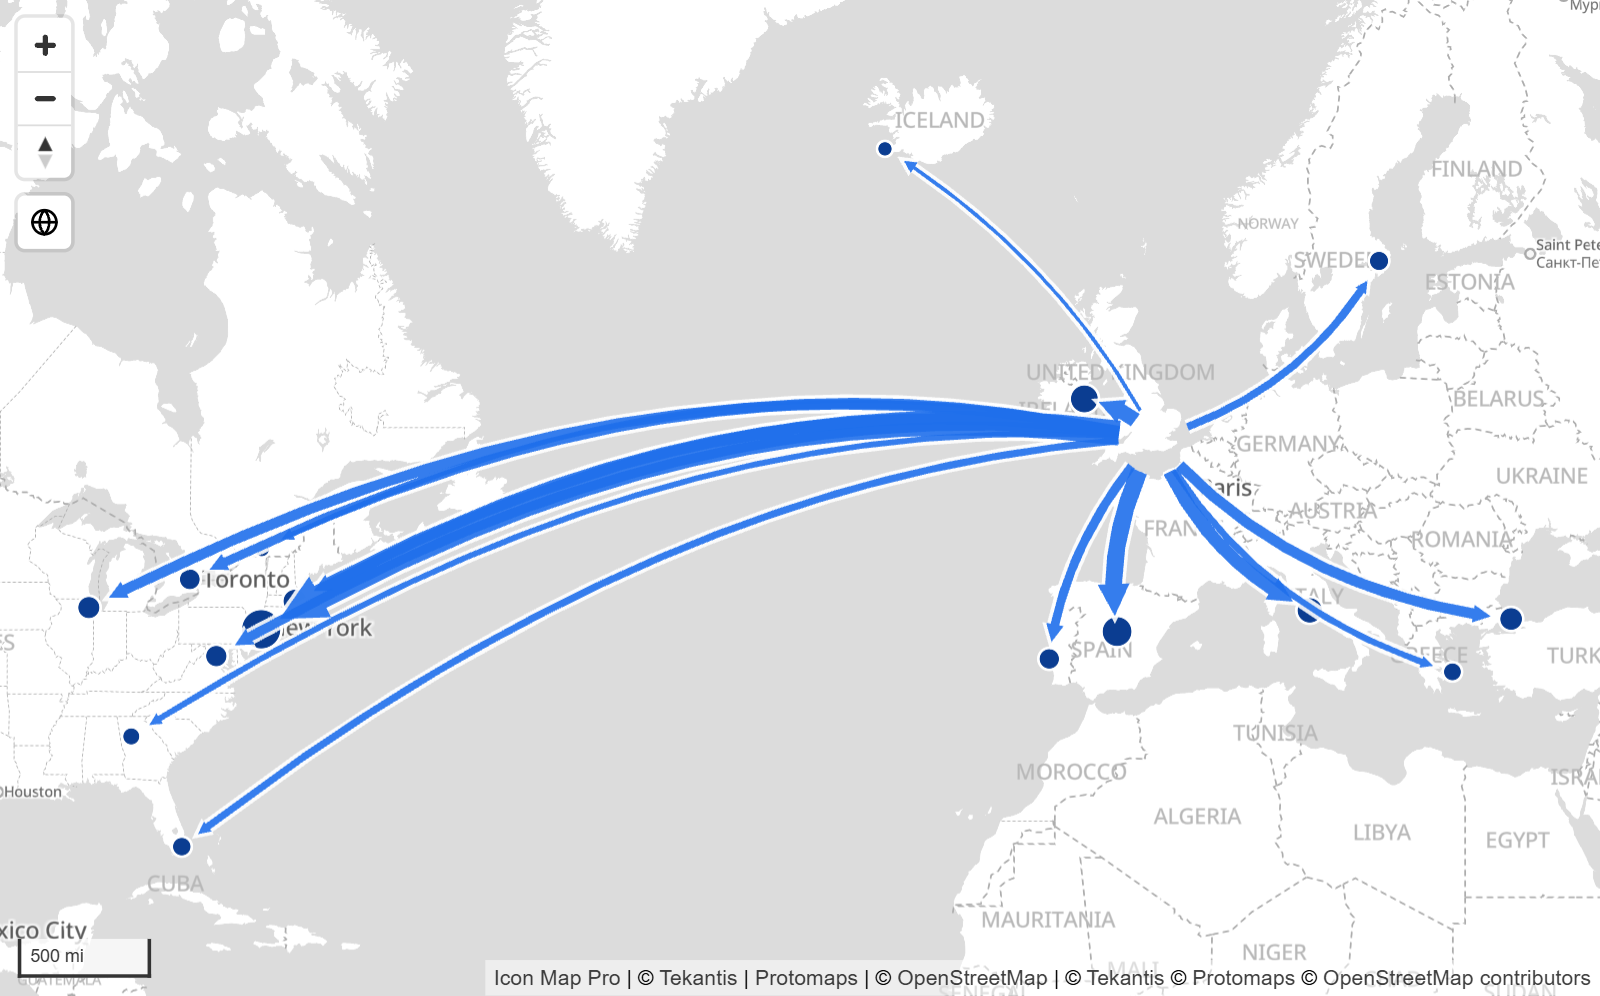
| Flow | Lines from one origin that merge into shared trunks. | Weight for Flow |
| Smoothed Flow | As Flow, with smoother curves and junctions. | Weight for Flow |
| Flow Arcs | One curved arrow for each row. | Weight for Flow |
| Flow Tree | Ribbons that share a trunk and split toward each destination. | Weight for Flow |
| Routes | Lines that share a street, drawn side by side. | Width |
The Curved line shape is part of the Legacy engine, see the documentation for 1.1.0.9 and earlier.
Straight
A straight line on the map between the origin and the destination. A line that crosses the 180 degree meridian is split into two parts.
Every row is its own line, so rows that share the same two points draw on top of each other. Straight lines support everything in the Lines card: per-row color and width, a gradient, dashes and dash animation, blur, line symbols, and images or circles at the ends.
Shortest
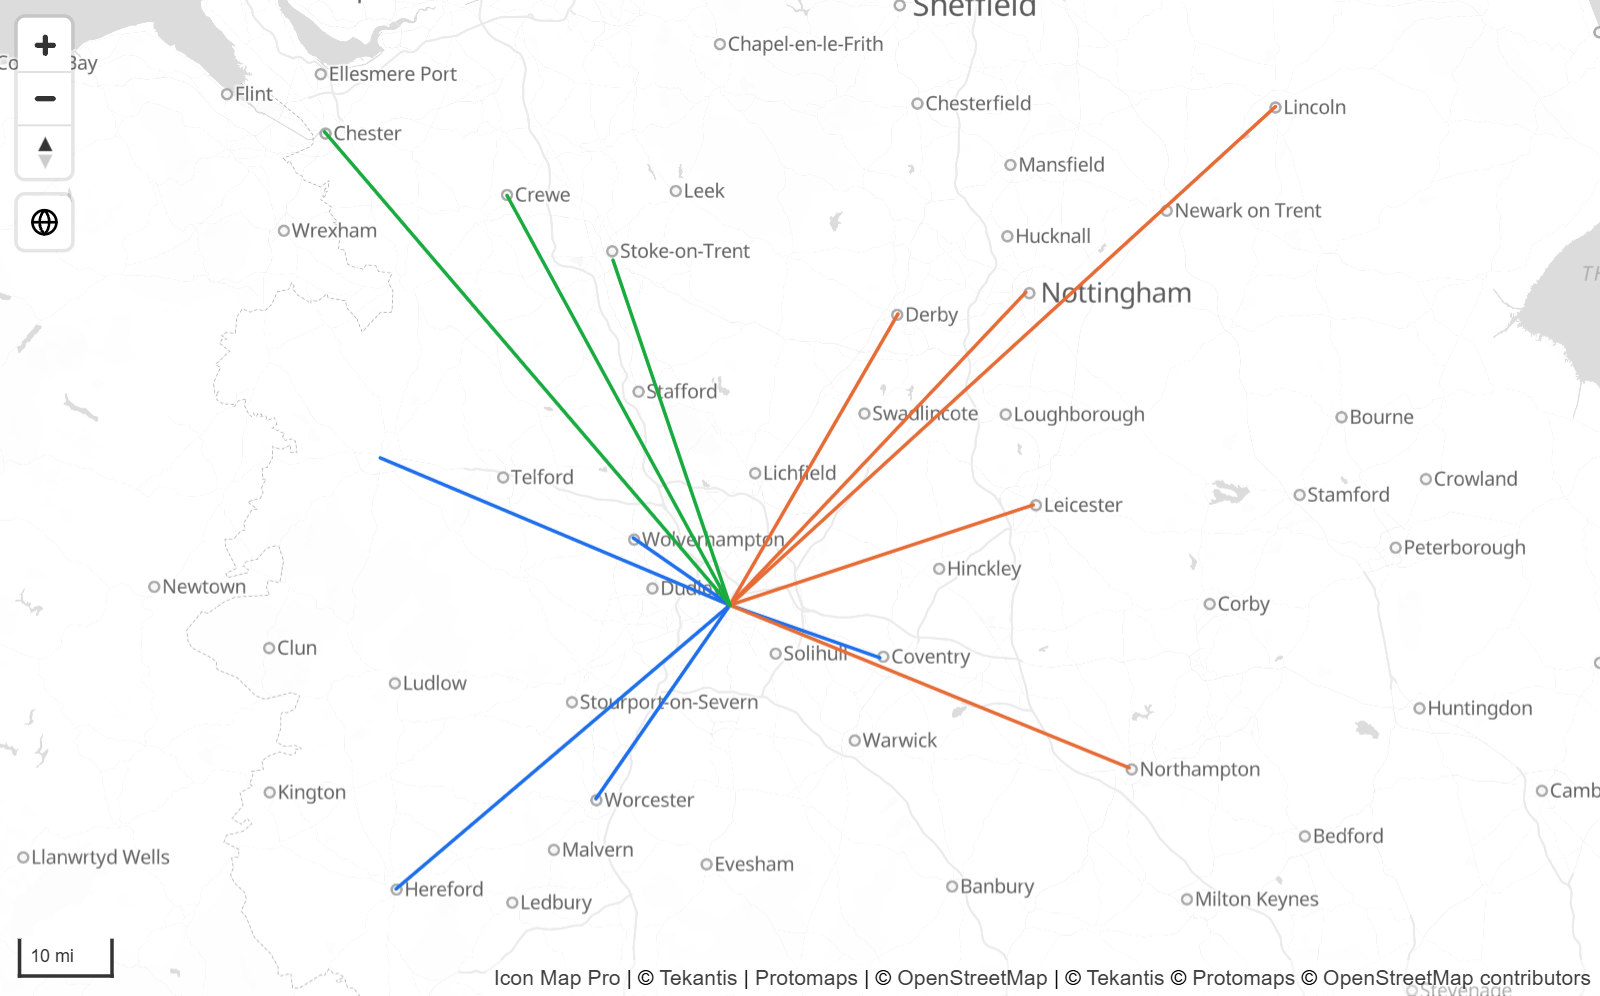
The great-circle path between the two points, as a flight would take. On a flat map the line curves toward the poles. On the globe it is the direct path. The line is drawn in one piece, including across the 180 degree meridian.
Shortest supports the same options as Straight. A row whose origin and destination are the same point draws nothing.
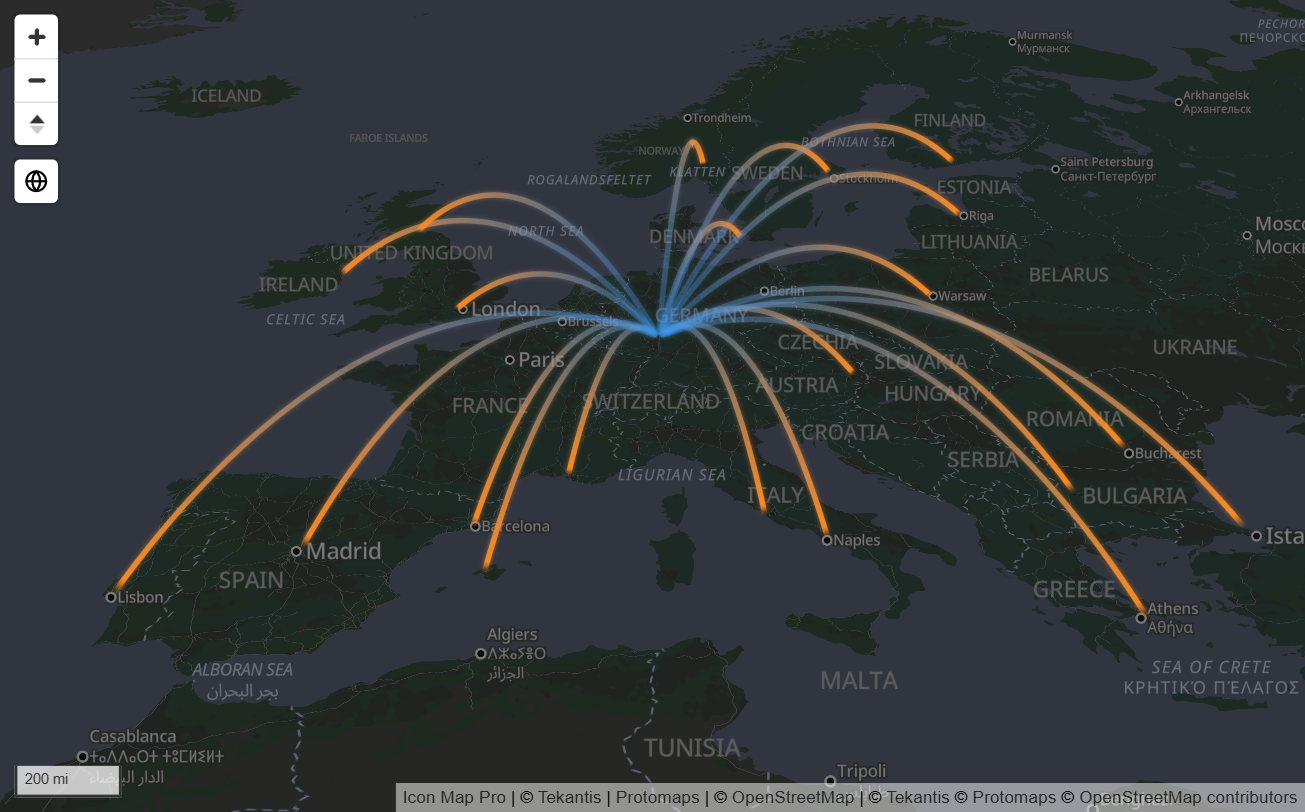
3D Arcs
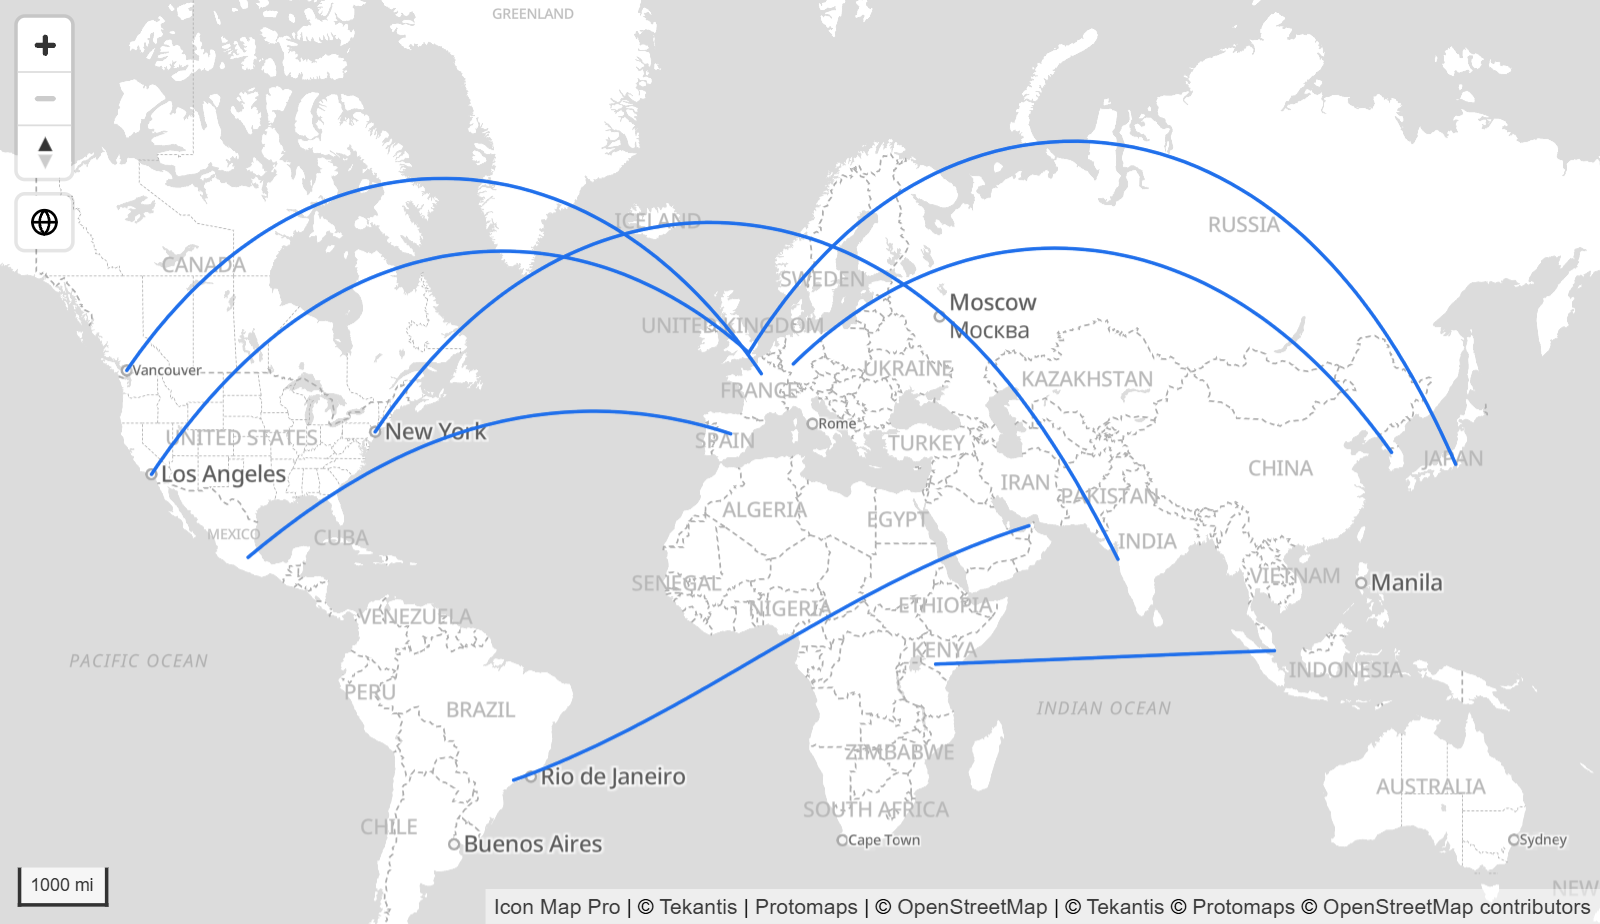
Each row is an arc that follows the great-circle path and rises off the ground, highest in the middle. Longer arcs rise higher. From straight above, an arc looks like a Shortest line, so tilt the map to see the height. See View, zoom and projection for tilt.
Settings that apply only to 3D Arcs:
- Amplitude - how high the arcs rise. 10 is the default, 1 is almost flat, 50 is five times the default height. Accepts conditional formatting.
- Glow - a soft halo around each arc.
- Fade From Origin - each arc starts faint at the origin and reaches full strength at the destination, so the direction is clear.
- Taper From Origin - each arc starts narrow and widens to its destination.
- Comet Speed - a bright head with a fading tail travels along each arc from origin to destination. 0 turns the comets off. At speed 1 a trip takes 12.5 seconds, at speed 10 it takes 1.25 seconds.
With Color Type set to Gradient, every arc runs from Gradient Color 1 at the origin to Gradient Color 2 at the destination. 3D Arcs do not have dashes, blur, an invisible line width or line symbols. Images and circles at the ends are still drawn. On the globe, the parts of an arc behind the Earth are hidden.
Flow
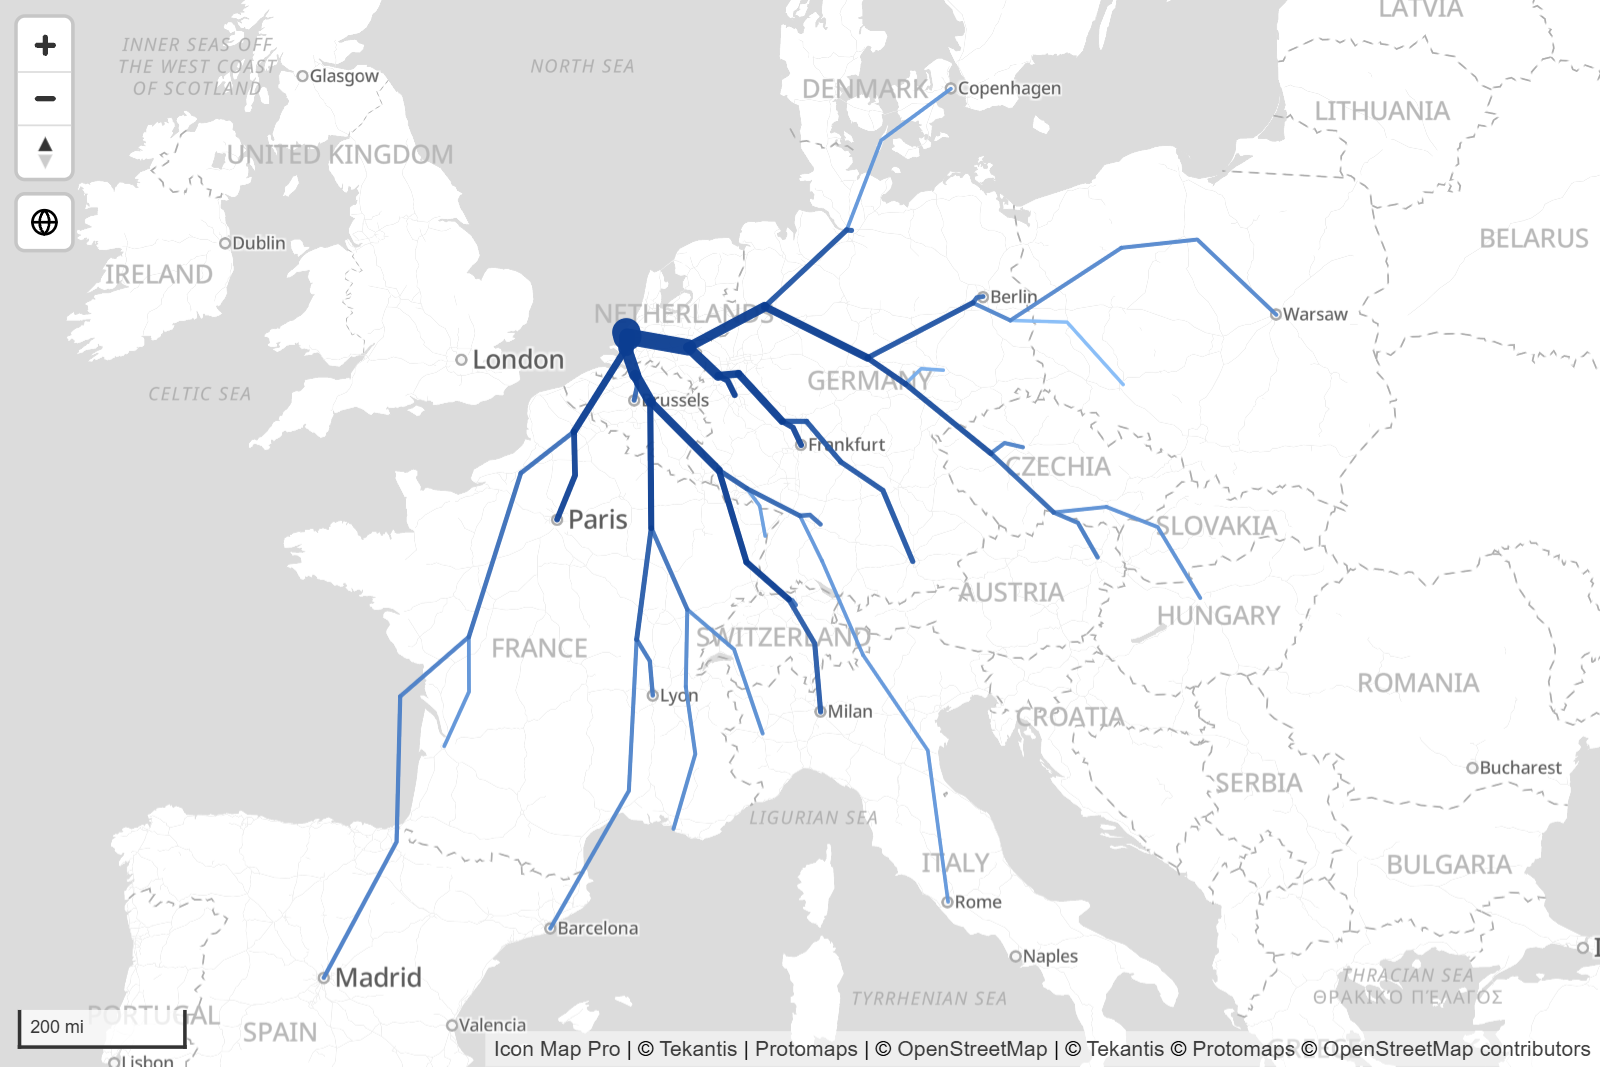
Rows that share exactly the same origin are drawn as one tree. Lines to destinations in a similar direction merge into shared trunks that run back to the origin, so the map shows the volume leaving each place rather than a fan of separate lines.
- Weight for Flow sets how much each row carries. Set it from a measure with conditional formatting. A trunk carries the sum of the rows that run through it.
- Min Width and Max Width set the thinnest and thickest line. Within each origin, the lightest segment is Min Width and the heaviest is Max Width. If every segment has the same weight, all are Min Width.
- Color follows the weight between Gradient Color 1 and Gradient Color 2. The scale is fixed: a weight of 1 or less is Gradient Color 1, a weight of 100 or more is Gradient Color 2, and weights between are blended. It is not fitted to your data, so scale your weight measure into the range 1 to 100 to use the whole color range.
- Transparency and Outline Blur apply to the whole layer.
- Data Label At Destination places each row's data label at its destination. It needs data labels to be set up.
A row whose origin and destination are the same point is skipped.
Smoothed Flow
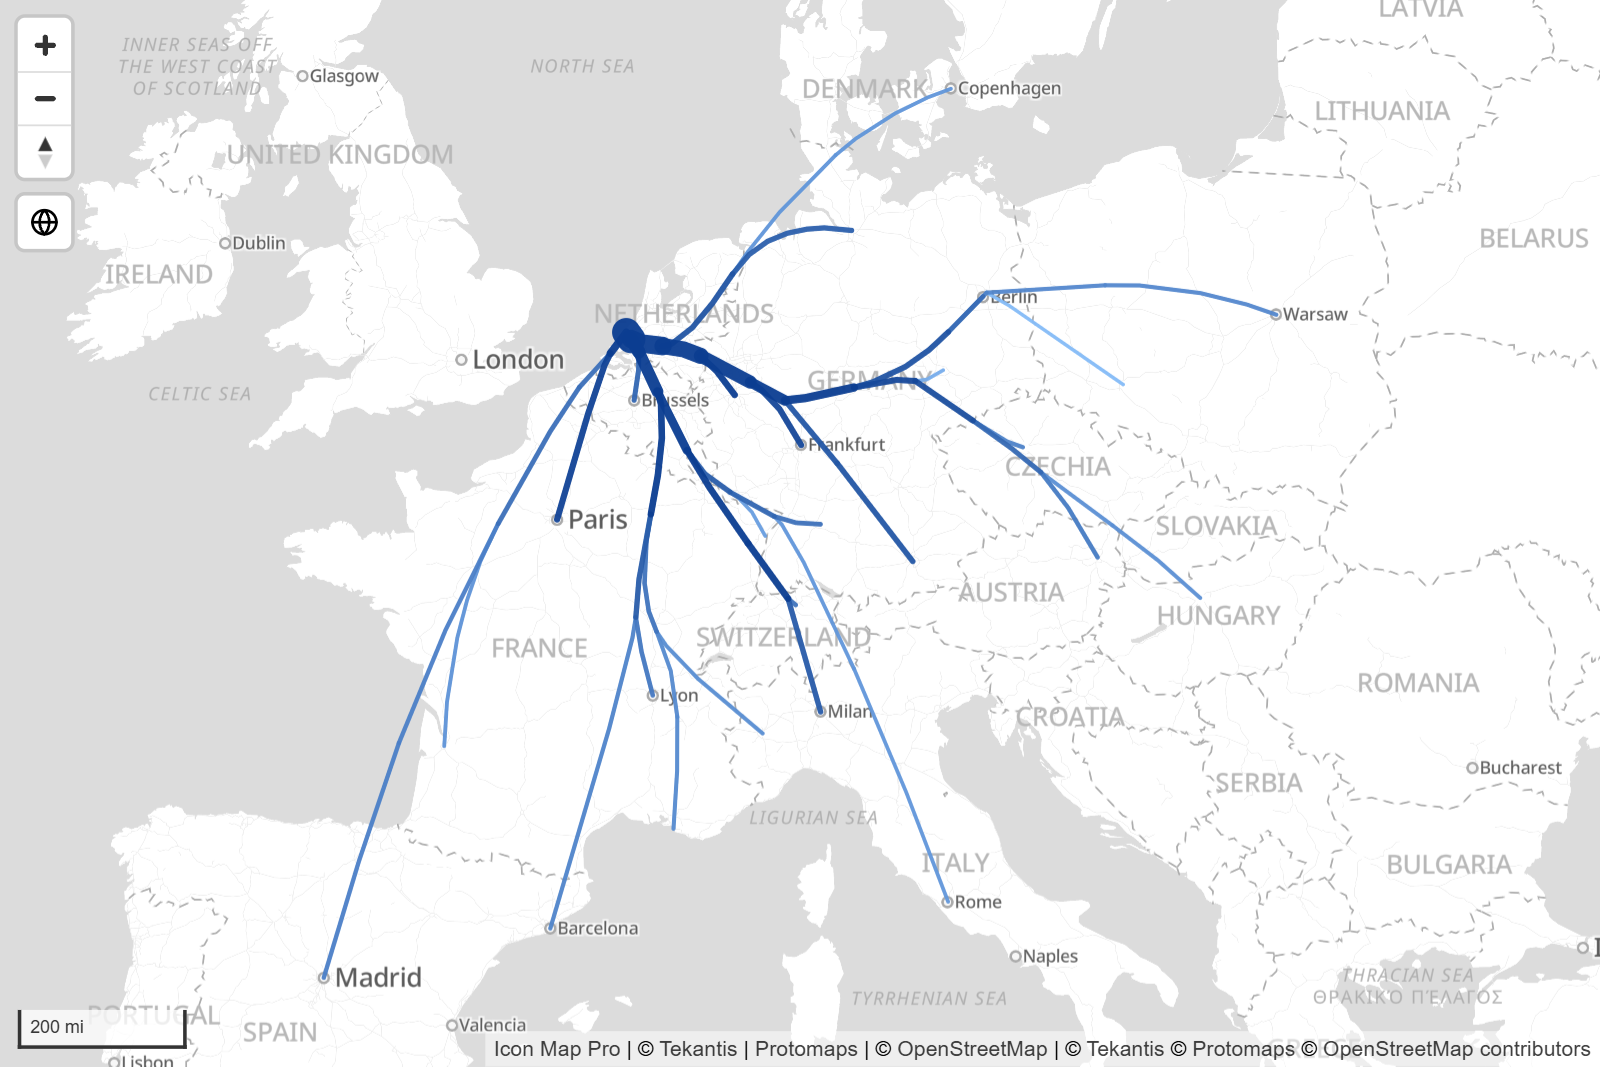
The same data, weights, widths, colors and options as Flow. The trunks and branches are drawn with smoother curves, and junctions are placed by weight, so branches leave the trunks more cleanly. Try both and keep the one that reads better for your data.
Flow Arcs
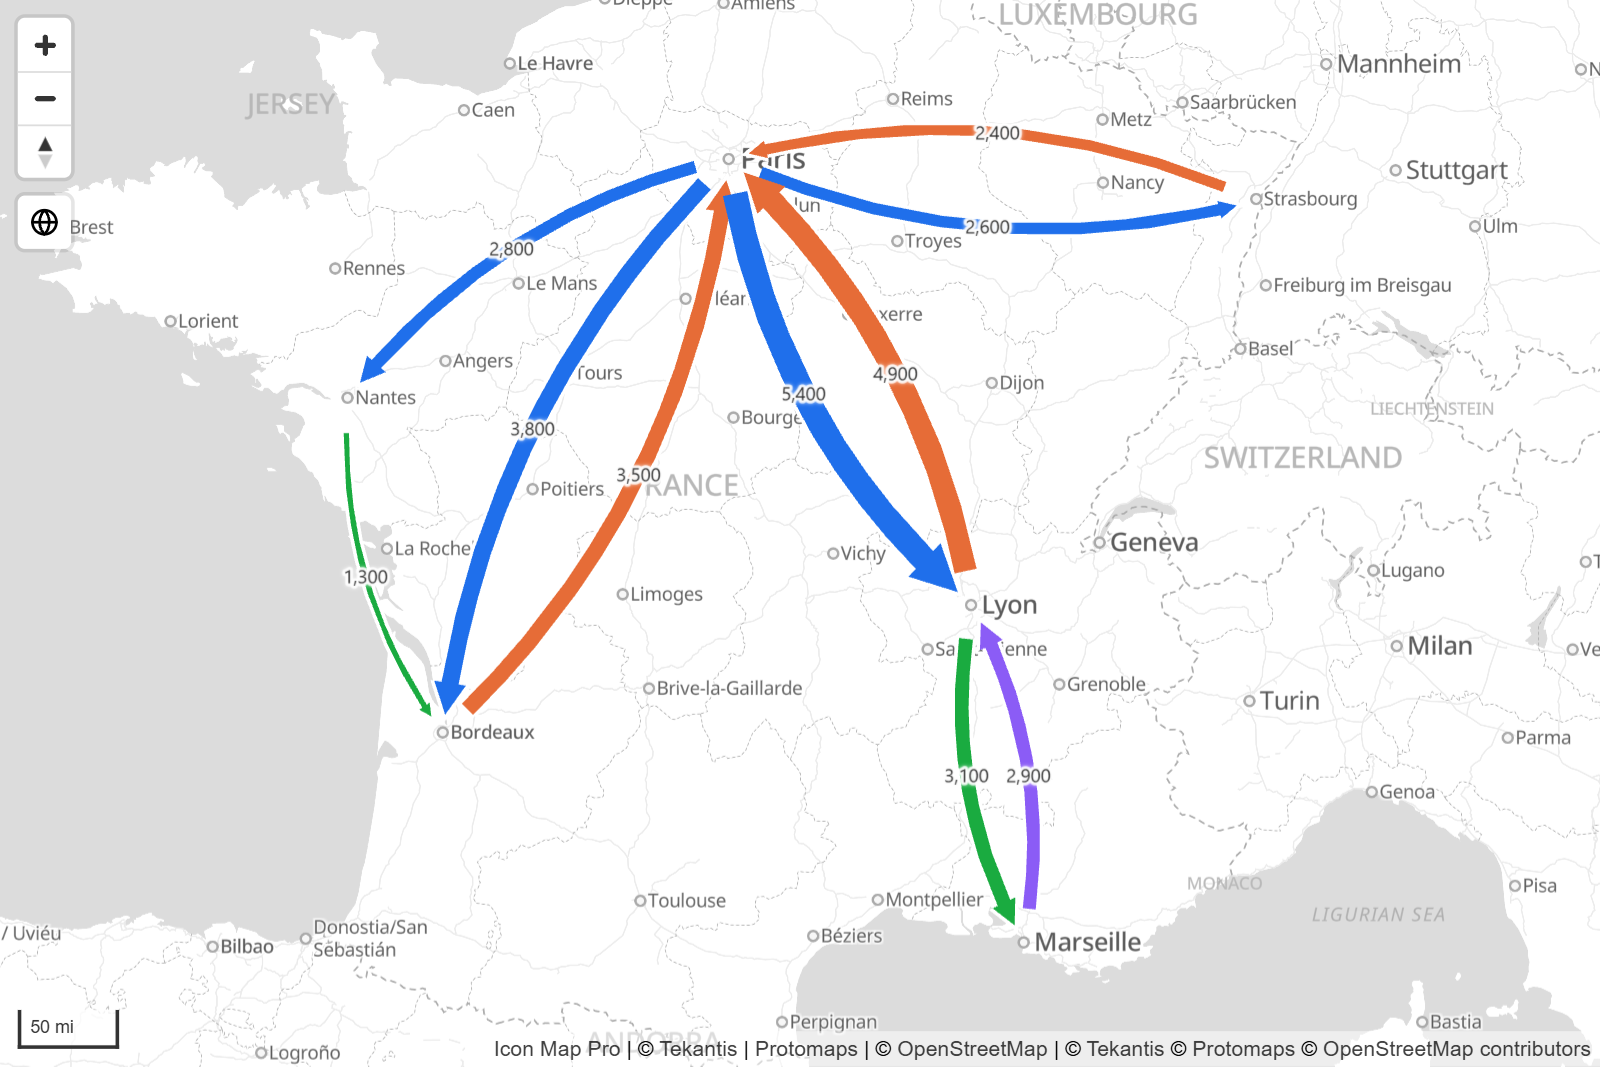
One flat, curved arrow for each row. Nothing is merged, so every origin and destination pair is visible on its own. Arcs bow to the right of the direction of travel, so a flow from A to B and a flow from B to A separate into two arrows.
- Weight for Flow sets each arc's width, between Min Width and Max Width across all rows of the layer.
- Arc Curvature (%) is the height of the bow as a percentage of the distance between the two points.
- With Color Type set to Solid, each row takes its own Color and Transparency. With Gradient, each arc is one flat color picked by its weight between Gradient Color 1 (a weight of 1 or less) and Gradient Color 2 (100 or more).
- Trim at Origin (px) and Trim at Destination (px) stop each arc short of its ends, by the same number of screen pixels at every zoom level. Use them to keep arrows clear of circles or icons at the ends.
- Arrowheads and Arrowhead Size control the head. The size applies to the widest arc and thinner arcs scale down.
- Taper From Origin starts each arc narrow and widens it toward the head.
- Outline Color and Outline Width draw a contrasting outline around the arc and its arrowhead.
- Label Position places the data label: None, Arc Midpoint or Destination.
Flow Tree
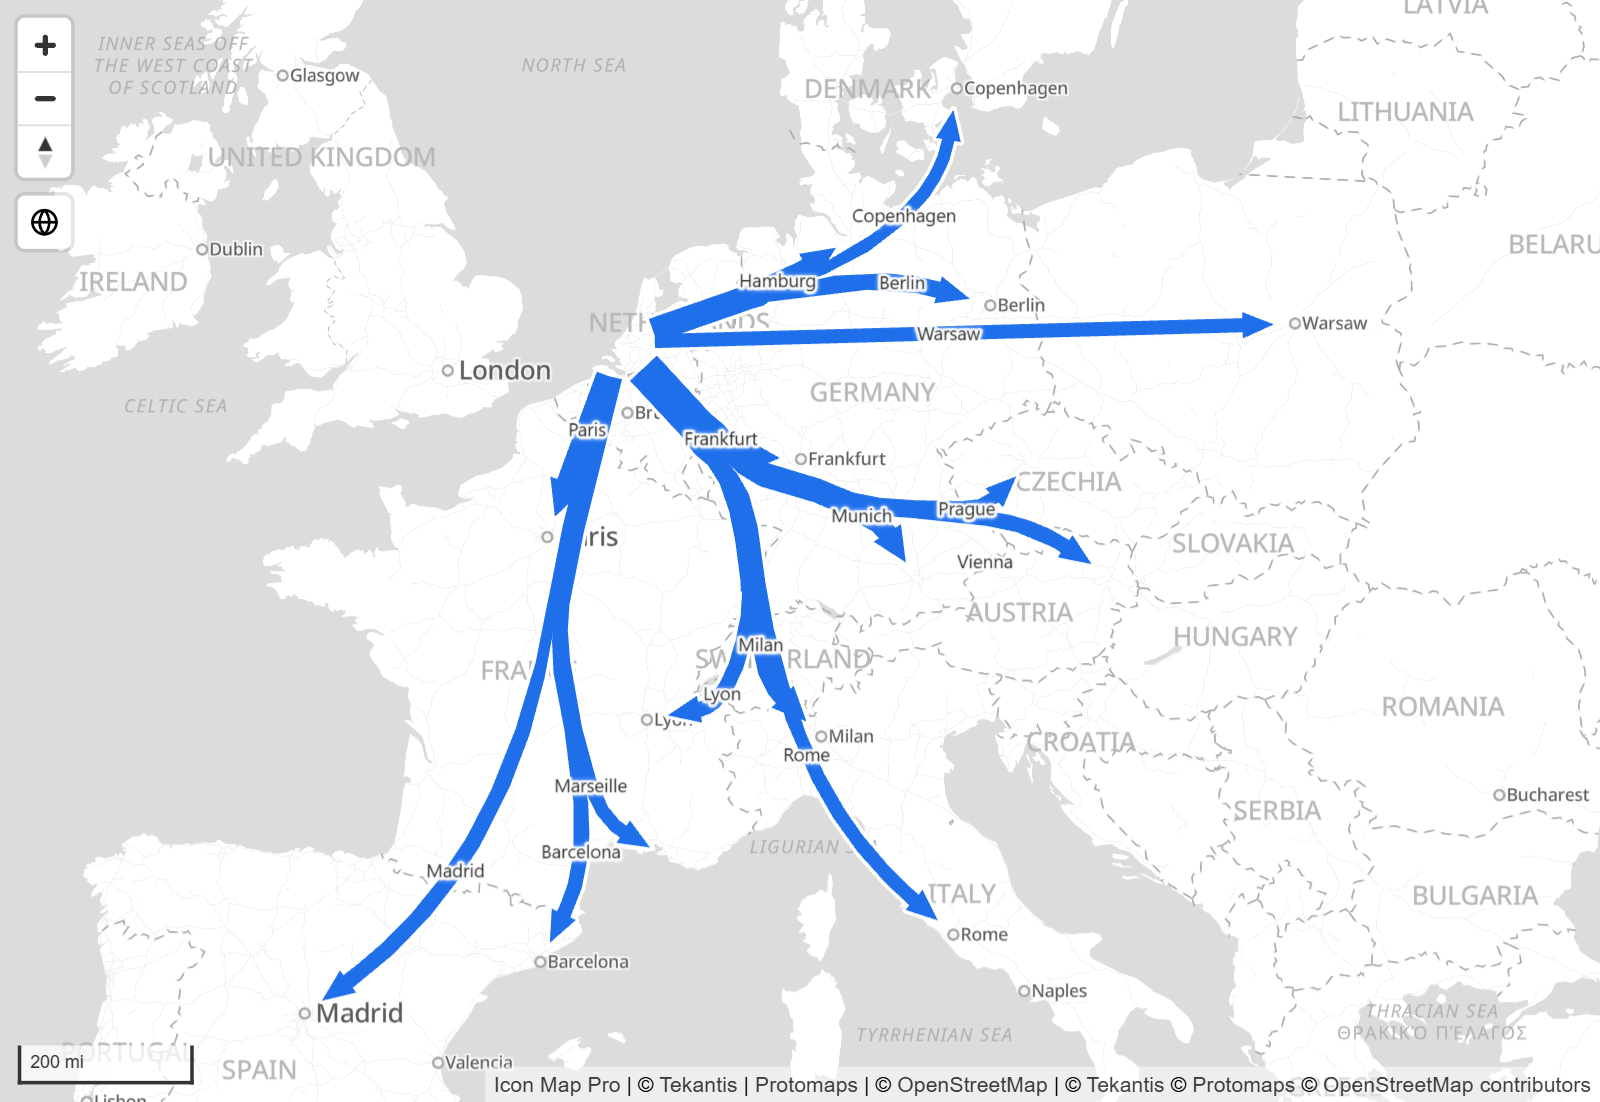
One tree for each origin, drawn as ribbons. Destinations are grouped by direction. Every branch is a smooth curve whose width follows its flow, and where a branch splits, the smaller ribbons leave side by side and fill the width of the parent.
- Weight for Flow sets each row's flow. A branch carries the sum of the rows beneath it.
- The heaviest trunk on the map is Max Width and nothing is narrower than Min Width.
- Grouping decides how eagerly flows are joined: Bundled joins the most flows into shared trunks. Balanced keeps the trunks but lets branches leave earlier, so fewer double back. Fewest Crossings only joins flows next to each other in direction, which is the tidiest but bundles the least.
- A tree has one color. Every ribbon takes the Color and Transparency of the first row of its origin, so use a conditional formatting rule that gives every row of an origin the same color.
- Trim at Origin (px), Trim at Destination (px), Taper From Origin, Arrowheads, Arrowhead Size, Outline Color and Outline Width work as they do for Flow Arcs. The outline runs around the outside of each tree.
- Label Position is None, Midpoint or Destination. Midpoint places each destination's label halfway along its own final branch.
Pointing at a destination's ribbon shows that row's tooltip. Pointing at a shared branch shows the same tooltip fields summarized over every row beneath it. Clicking a destination's ribbon selects its row, and clicking a shared branch selects every row beneath it.
Routes
Lines that share a street are drawn side by side, each in its own color, as on a bus or metro map. Routes has its own page: Routes.
Dashes and animation
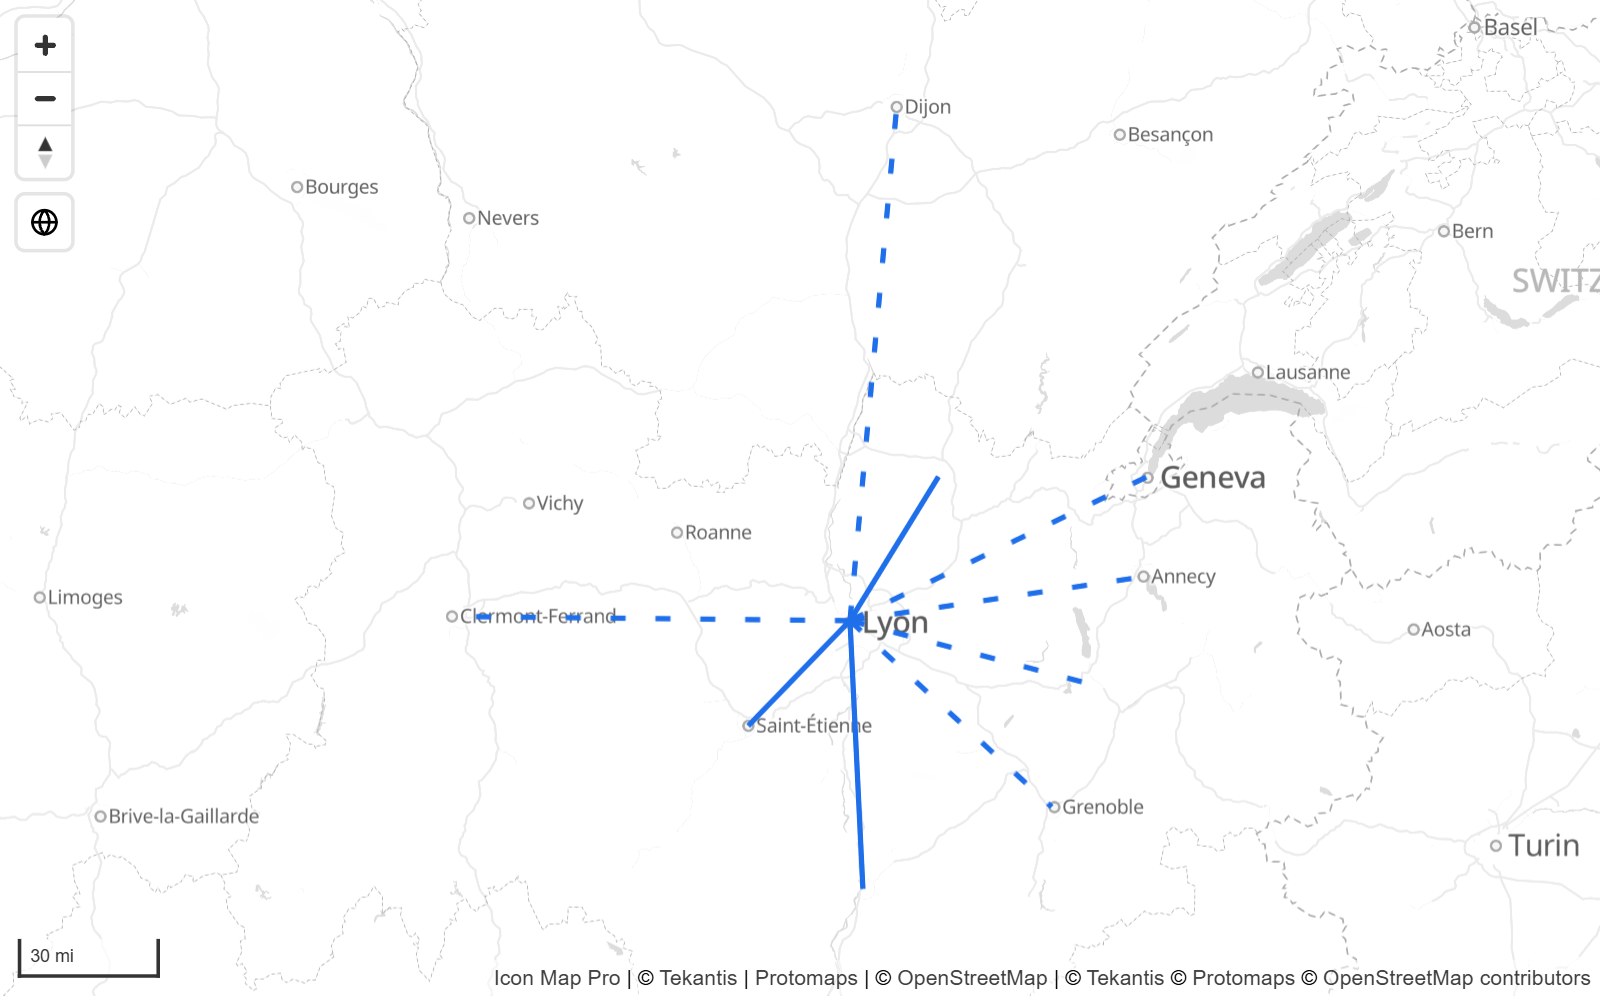
For Straight and Shortest lines with Color Type set to Solid:
- Dash Array is a list of numbers separated by spaces or commas, read as dash, gap, dash, gap, in multiples of the line width. For example
2 4draws a dash two widths long followed by a gap four widths long. It needs at least two numbers. Use conditional formatting to give different lines different patterns. - Dash Animation Speed makes the dashes travel along the line. 0 is still. A negative value reverses the direction. The speed applies to the whole layer.
Dashes cannot be combined with a gradient. When Color Type is Gradient, the dash settings are replaced by a note.
Line symbols
For Straight and Shortest lines you can draw text or a character along each line, for example an arrow that shows direction. Set Include Line Symbol (Straight / Shortest only) to Yes, then choose the Line Symbol Text, color and size.
- Line Symbol Repeat - Yes repeats the symbol along the whole line. No draws it once at the center.
- Line Symbol Orientation - With Line Direction makes the text follow the line from origin to destination, so an arrow character always points at the destination. Keep Upright flips text where needed so it is never upside down.
- Symbol Halo Color, Symbol Halo Width and Symbol Halo Blur add an outline around the symbol.
Images at the ends
Image URL at start and Image URL at end place an image at the origin or destination of each line, for example a plane or a ship. They are drawn for Straight, Shortest and 3D Arcs. Each takes an image URL, a data URI or SVG markup, and accepts conditional formatting, so the image can come from your data.
Each image has its own Image Height, Image Width, Image Rotation and Transparency. The rotation is fixed. It does not follow the direction of the line.
Circles at the ends
Include circle(s) at: draws a circle at the Start, the End or Both ends of each line. The circles are drawn by the Circles layer, so:
- Turn on the Circles layer.
- Add a field to Circle Size.
The circles take the Circles layer's formatting, tooltips and zoom range. This works with every line shape.
Selection, tooltips and labels
- Selection - click a Straight, Shortest or 3D Arcs line to select its row and cross-filter the rest of the report. Hold Ctrl to add to the selection. On a Flow Tree, a destination's ribbon selects its row and a shared branch selects every row beneath it. On Routes, a click selects the whole route. Set Selectable to No to turn this off. See Selection, cross-filtering and highlighting.
- Invisible Line Width - thin Straight and Shortest lines are hard to click. This setting adds a hidden, wider line under each one that takes clicks and tooltips.
- Tooltips - pointing at a Straight, Shortest, 3D Arcs, Flow Tree or Routes line shows the fields in Tooltips. Set Include Tooltip to No to turn them off. See Tooltips.
- Labels - Straight, Shortest and 3D Arcs lines carry their data label at the midpoint. Flow and Smoothed Flow use Data Label At Destination. Flow Arcs and Flow Tree use Label Position. See Data labels.
- Auto zoom - rows with Include in Auto Zoom set to Yes are included when the map zooms to fit your data.
Settings
All settings are in Format pane > Data Layers. Settings marked fx accept conditional formatting.
Lines - Configuration
| Setting | What it does | Default |
|---|---|---|
| Include in Auto Zoom | Includes the lines when the map zooms to fit your data. fx | Yes |
| Include Tooltip | Shows tooltips on lines. | Yes |
| Selectable | Lets report users select lines. fx | Yes |
| Include circle(s) at: | None, Start, End or Both. Needs the Circles layer and a Circle Size field. fx | None |
| Data Label At Destination | Puts the data label at the destination. Flow and Smoothed Flow only. | Off |
| Image URL at start | Image at the origin. fx | Empty |
| Image Height, Image Width (start) | Size of the start image in pixels, 0 to 1000. fx | 30 |
| Image Rotation (start) | Rotation in degrees, 0 to 360. fx | 0 |
| Transparency (start) | Transparency of the start image, 0 to 100. fx | 0 |
| Image URL at end | Image at the destination. fx | Empty |
| Image Height, Image Width (end) | Size of the end image in pixels, 0 to 1000. fx | 30 |
| Image Rotation (end) | Rotation in degrees, 0 to 360. fx | 0 |
| Transparency (end) | Transparency of the end image, 0 to 100. fx | 0 |
| Minimum Zoom | The lines are hidden when the map is zoomed out past this level. | 0 |
| Maximum Zoom | The lines are hidden when the map is zoomed in past this level. | 24 |
| Z Index | Position in the drawing order. Layers with a higher value draw on top. | 409 |
| EPSG | The coordinate system of your coordinates. See Coordinate systems. | 4326 |
The image settings are not shown for Flow Tree and Routes.
Lines - Formatting: shape, color and width
| Setting | What it does | Shown for | Default |
|---|---|---|---|
| Line Shape | How each line is drawn. fx | All | Straight |
| Color Type | Solid or Gradient. | Straight, Shortest, Flow Arcs, 3D Arcs | Solid |
| Gradient Color 1 | Color at the origin, or for the lightest weight. | Flow and Smoothed Flow always. Others when Color Type is Gradient | #0000FF |
| Gradient Color 2 | Color at the destination, or for the heaviest weight. | As above | #FF0000 |
| Color | Line color. fx | Whenever the gradient colors are not shown | Theme color |
| Transparency | 0 is solid, 100 is invisible. fx | All | 20 |
| Width | Line width in pixels, 0 to 100. fx | Straight, Shortest, 3D Arcs, Routes | 2 |
| Weight for Flow | The value each row carries. fx | Flow, Smoothed Flow, Flow Arcs, Flow Tree | 1 |
| Min Width | Width of the lightest flow. | Flow, Smoothed Flow, Flow Arcs, Flow Tree | 2 |
| Max Width | Width of the heaviest flow. | Flow, Smoothed Flow, Flow Arcs, Flow Tree | 20 |
| Outline Blur | Blur applied to the line, 0 to 100. fx | Straight, Shortest, Flow, Smoothed Flow | 0 |
| Invisible Line Width | Width of a hidden line that makes narrow lines easier to click. fx | Straight, Shortest | 5 |
Lines - Formatting: flow arcs and flow trees
| Setting | What it does | Shown for | Default |
|---|---|---|---|
| Grouping | Bundled, Balanced or Fewest Crossings. | Flow Tree | Bundled |
| Arc Curvature (%) | Bow height as a percentage of the distance, 0 to 50. | Flow Arcs | 18 |
| Trim at Origin (px) | Stops each flow this many screen pixels short of its origin. | Flow Arcs, Flow Tree | 20 |
| Trim at Destination (px) | Stops each flow this many screen pixels short of its destination. | Flow Arcs, Flow Tree | 12 |
| Taper From Origin | Starts narrow and widens toward the destination. | Flow Arcs, Flow Tree, 3D Arcs | Off |
| Arrowheads | Draws an arrowhead at the destination. | Flow Arcs, Flow Tree | On |
| Arrowhead Size | Size on the widest flow, 6 to 100. Thinner flows scale down. | Flow Arcs, Flow Tree | 26 |
| Outline Color | Color of the outline around flows and arrowheads. | Flow Arcs, Flow Tree | #FFFFFF |
| Outline Width | Width of the outline, 0 to 20. 0 turns it off. | Flow Arcs, Flow Tree | 2 |
| Label Position | None, Midpoint (Arc Midpoint for Flow Arcs) or Destination. | Flow Arcs, Flow Tree | Midpoint |
Lines - Formatting: 3D arcs
| Setting | What it does | Default |
|---|---|---|
| Amplitude | How high the arcs rise, 1 to 50. fx | 10 |
| Glow | A soft halo around each arc. | On |
| Fade From Origin | Arcs start faint and strengthen toward the destination. | On |
| Comet Speed | Speed of the comets along each arc, 0 to 10. 0 turns them off. | 0 |
Lines - Formatting: dashes and symbols
These are shown for Straight and Shortest.
| Setting | What it does | Default |
|---|---|---|
| Dash Array | Dash pattern, for example 2 4. Needs Color Type set to Solid. fx |
Empty |
| Dash Animation Speed | Makes the dashes travel, -100 to 100. Applies to the whole layer. | 0 |
| Include Line Symbol (Straight / Shortest only) | Draws text along the line. fx | No |
| Line Symbol Text | The text or character to draw. fx | ► |
| Line Symbol Color | Color of the symbol. fx | Theme color |
| Line Symbol Size | Size of the symbol, 1 to 100. fx | 20 |
| Line Symbol Repeat | Repeats the symbol along the line. fx | Yes |
| Line Symbol Orientation | Keep Upright or With Line Direction. | With Line Direction |
| Symbol Halo Color | Color of the outline around the symbol. fx | #FFFFFF |
| Symbol Halo Width | Width of the halo, 0 to 100. fx | 0 |
| Symbol Halo Blur | Blur of the halo, 0 to 100. fx | 0 |
The Routes settings (Route Name, Merge Distance (m), Route Outline Color, Route Outline Width, Route Badges) are described on the Routes page.
In the Layer Manager
Select the Lines & flows row in the Layer Manager to change its style, Color and Transparency, Width and Visible at zoom without opening the Format pane. Drag the row to change the drawing order. Everything else, including conditional formatting, stays in the Format pane. See Edit, reorder and remove layers.
Coordinate systems
By default the coordinates are longitude and latitude in decimal degrees (EPSG 4326). If your data uses a projected coordinate system, such as British National Grid, enter its EPSG number in EPSG, for example 27700. Enter the number only. Put the X value in Longitude (X) and Destination Longitude, and the Y value in Latitude (Y) and Destination Latitude.
EPSG applies to Straight, Shortest, 3D Arcs and Routes. Flow, Smoothed Flow, Flow Arcs and Flow Tree read the coordinates as longitude and latitude in decimal degrees. The setting is not available when the basemap is a custom image.
Circles at the ends of lines use the Circles layer's own EPSG setting.
Tips and limits
- A map has one Lines layer. Every line row is drawn by it.
- A row needs all four coordinates. A row with a blank coordinate is skipped.
- Minimum Zoom and Maximum Zoom apply to Straight, Shortest, Flow Tree and Routes lines.
- Destination Latitude and Destination Longitude are easy to swap. If no flow lines appear, check that the latitudes are between -90 and 90.
- Flow, Smoothed Flow and Flow Tree group rows by origin. Rows only share a tree when their origin coordinates are the same.
- The visual receives 30,000 rows by default. See Data rows and limits.
- To show lines and other layers together, for example stores as circles and deliveries as lines, see Combine several layers in one map.