
Legend
The legend explains the colors, sizes and symbols on the map. Icon Map Pro builds it from the way each layer is really styled, so it stays in step with your formatting.
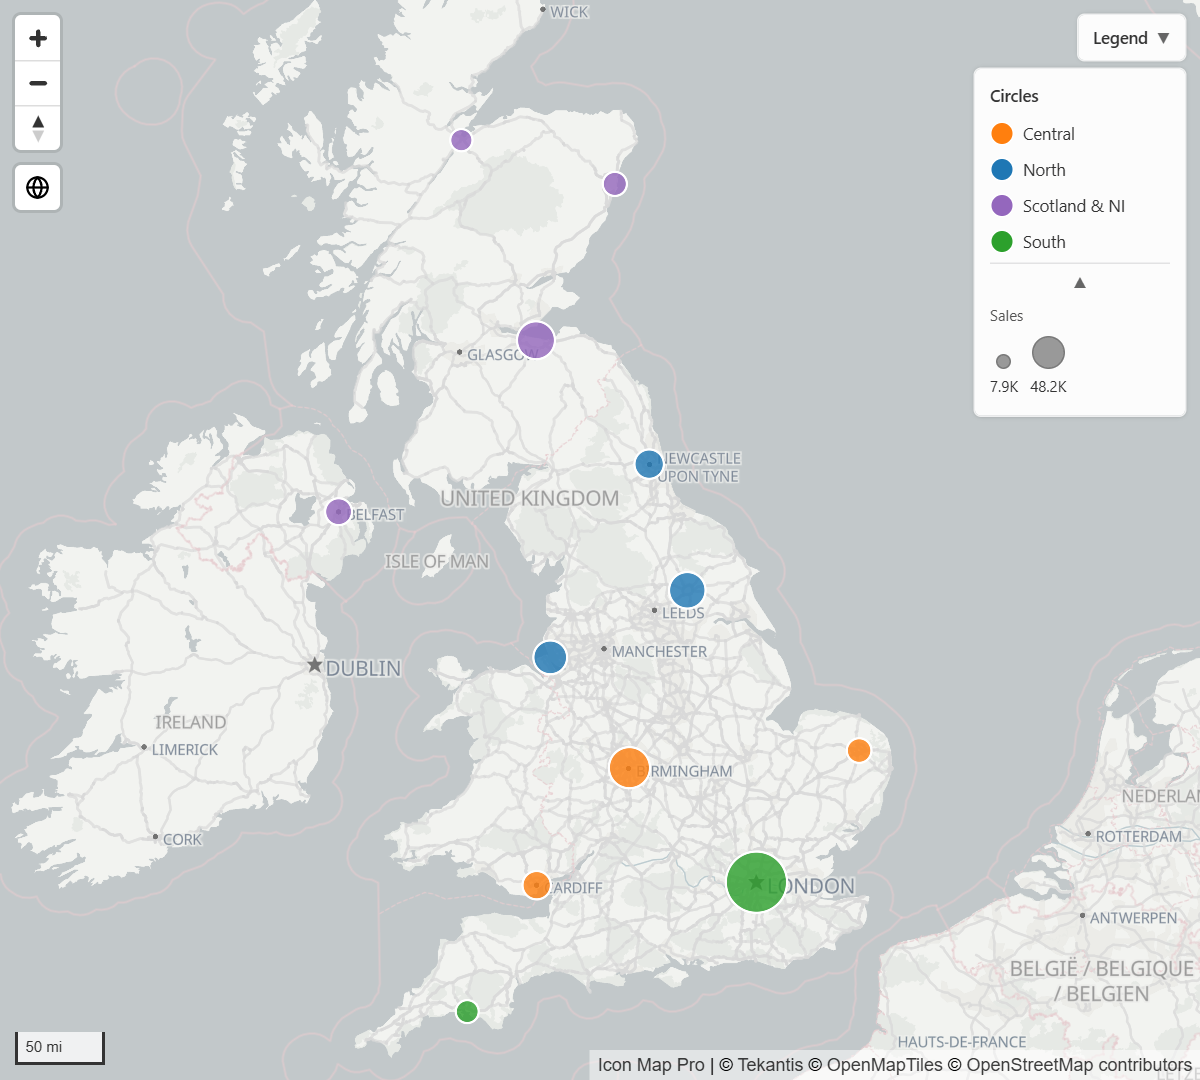
Add a legend
- In the Format pane, switch on the Legend card.
- Choose a Position: one of the four corners of the map.
- Type a Title. It is the label of the button that folds and unfolds the legend.
The legend lists every layer that is switched on and can be explained. To leave a layer out, expand Legend labels and switch off its in legend setting.
What appears in the legend
The legend has one group for each layer, headed by the layer's title when Show layer titles is on. What a group shows depends on the layer and how it is styled.
| Layer | What the legend shows |
|---|---|
| Circles | A color swatch for each category, and a size ramp when circles are sized by a value. Cluster group colors are shown as swatches. |
| Images and icons | The icon or icons in use. When every row has its own icon and no description, a note says icons are set per item. |
| Lines | A sample of the line, a gradient for gradient lines, and a width ramp when the width follows a value. |
| Heatmap | A gradient from Low to High. |
| Cells | A swatch or a gradient. |
| Shapes (from data, from files, vector tiles, ArcGIS layers bound to data) | Fill swatches or line samples. |
| Files and feeds reference layers | A swatch or gradient for each layer. |
| Icon Map Catalog layers | The catalog's own legend: a gradient, swatches or icons for its rules, or an image. |
A group with several categories starts folded: it shows a few swatches without names, then "+N" and an arrow. Select the arrow to expand the group and list every category with its name.
When a layer has more entries than Max categories, the list is cut short and a note such as "+ 8 more" is added.
Colors from conditional formatting
When a layer's color is set with conditional formatting (fx), Power BI gives the map only the finished color of each row, not the rule behind it. The legend works backward from those colors:
- a small number of different colors becomes a list of categories
- a smooth range of colors becomes a gradient
To label the categories, give the layer a description in Legend labels: select fx, then Field value, and pick the field that names each category. If the legend picks the wrong form, or needs better labels at the ends of a gradient, use the settings in Conditional formatting legends.
Show legends in the layer control
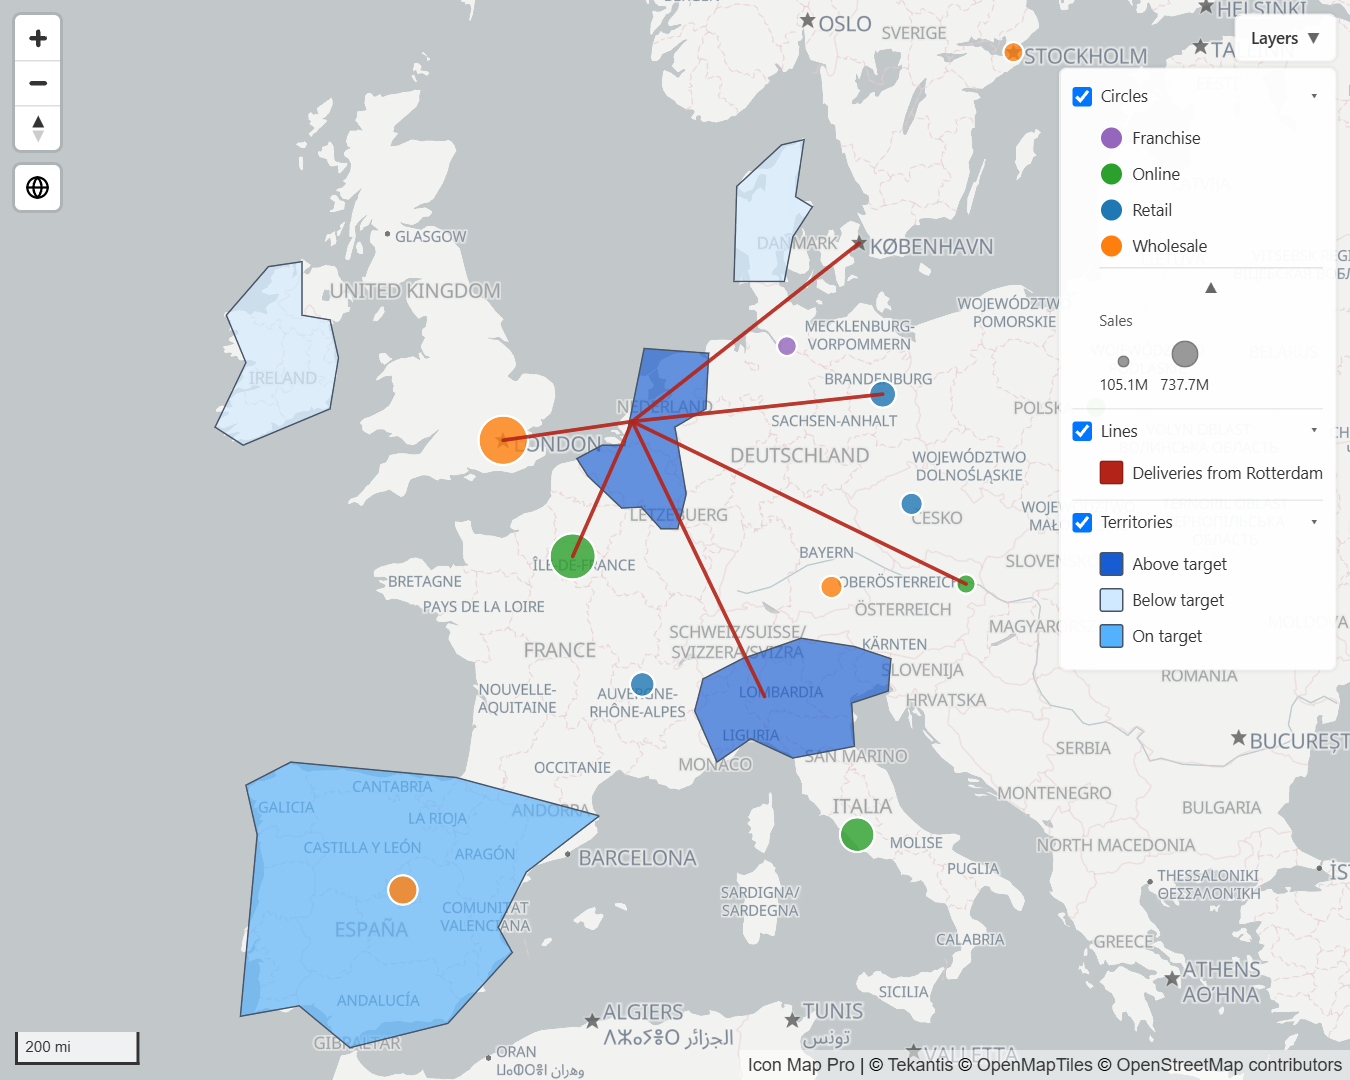
Display mode chooses where legends are drawn:
| Option | Result |
|---|---|
| Panel | A legend panel of its own. This is the default. |
| In layer control | Each layer's row in the layer control gets an arrow. The legend is folded until a reader selects the arrow, then it opens under the row. |
| Both | The panel and the layer control rows. |
In layer control needs the layer control switched on: Format pane > Controls > Layer control > Show layer control. Without it the legend falls back to a panel. See Map controls.
Settings
Legend
| Setting | What it does | Default |
|---|---|---|
| Legend (the card's switch) | Shows the legend. | Off |
| Position | Top left, Top right, Bottom left or Bottom right. | Top right |
| Title | The label of the button that folds and unfolds the legend. With more than one group the button adds the count, for example "Legend (2)". | Legend |
| Start collapsed | The legend opens folded away; readers expand it. | Off |
| Show layer titles | Shows a heading for each layer's group. | On |
| Max categories | The most category swatches shown for one layer, 1 to 50. | 12 |
| Display mode | Panel, In layer control or Both. | Panel |
Left at its default, the title shows "Legend" in the report's language. A title you type is shown as you typed it.
Legend labels
This group appears when at least one layer that can be in the legend is switched on. Each layer gets up to three settings, named after the layer.
| Setting | What it does | Default |
|---|---|---|
| {layer} in legend | Includes the layer in the legend. | On |
| {layer} title | The heading for this layer in the legend and the layer control. | Empty (the layer's own name) |
| {layer} description | Fixed text, or use fx and Field value to label the entries from a field. | Empty |
| Layer name in the settings | in legend | title | description |
|---|---|---|---|
| Circles | Yes | Yes | Yes |
| Icons (the Images / Icons layer) | Yes | Yes | Yes |
| Lines | Yes | Yes | Yes |
| Shapes (from data) | Yes | Yes | Yes |
| Shapes (from files), or Shapes level 1, Shapes level 2 and so on | Yes | Yes | Yes |
| Esri features (an ArcGIS layer bound to data) | Yes | Yes | Yes |
| Heatmap | Yes | Yes | No |
| Cells | Yes | Yes | No |
| Vector tiles | Yes | Yes | No |
| Overlay 1 to Overlay 5 (Files and feeds reference layers) | Yes | Yes | No |
Conditional formatting legends
These settings tune how fx colors are turned into legend entries. They are offered for Circles, Icons, Esri features, Shapes (from data), Lines, Shapes (from files) and Vector tiles. When Shapes (from files) layers are used as levels, the settings are labeled Shapes (all levels), for example Shapes (all levels) mode.
| Setting | What it does | Default |
|---|---|---|
| {layer} mode | Auto decides by the number of different colors. Categories forces a list of swatches, Gradient forces a gradient, None switches this off for the layer. | Auto |
| {layer} gradient field | The field whose values drive the gradient. Select fx, then Field value, and pick it. Leave it empty to let the map detect it from the measures in the visual. | Empty |
| {layer} min label, {layer} max label | Text for the two ends of the gradient. | Empty |
| {layer} value ranges | Labels category swatches with the range of values seen for each color. The ranges are approximate, based on the data present. | Off |
Legends for reference layers
New in 1.1.0.11
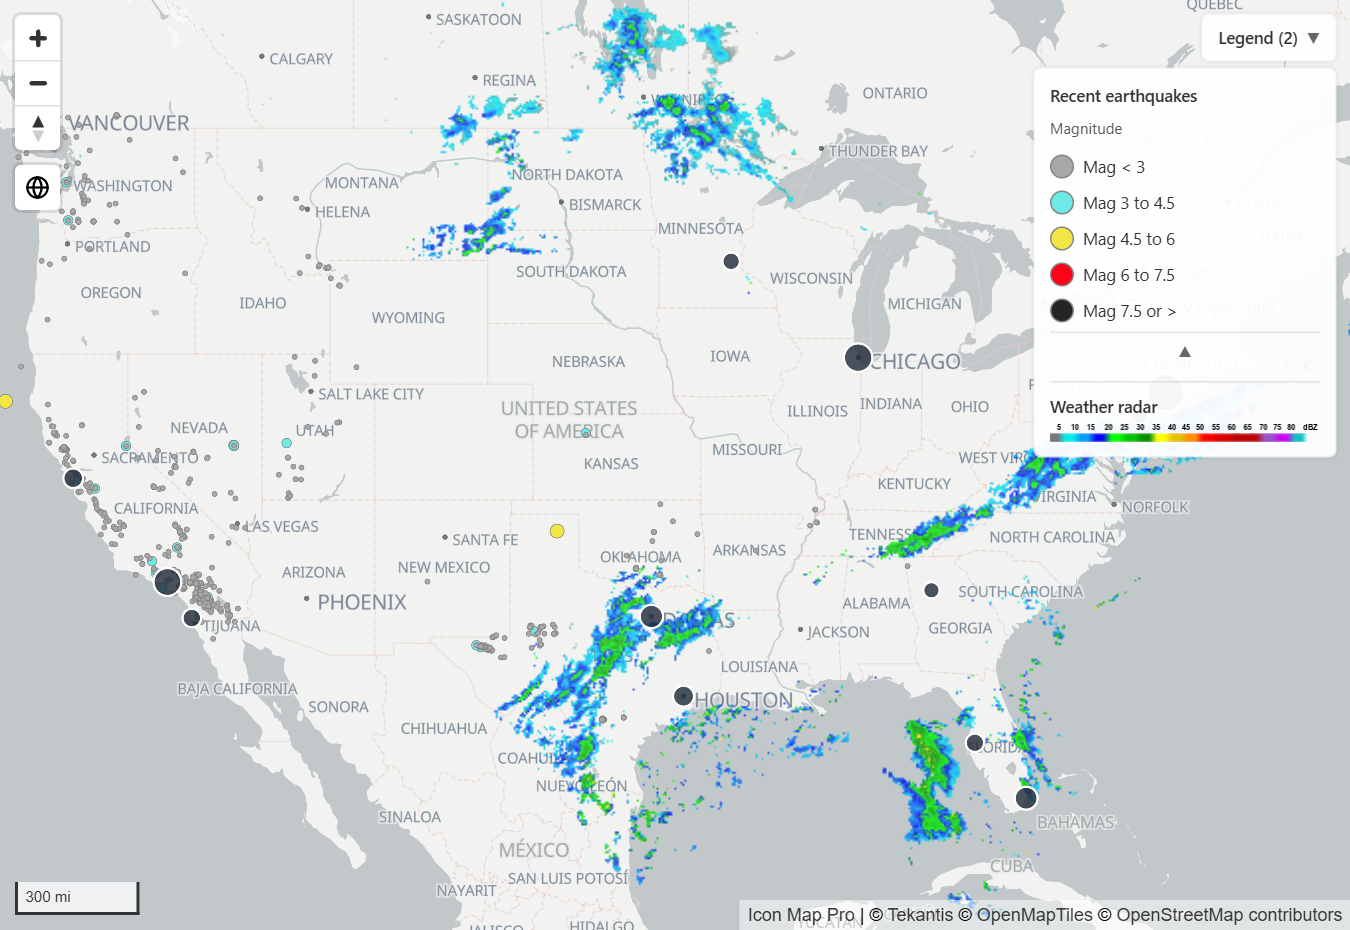
WMS and ArcGIS reference layers bring their own legends, read from the service that publishes them.
| Layer | What the legend shows |
|---|---|
| WMS layer | The legend image the WMS server provides for the layer. Its heading is your title, else the layer's name. |
| ArcGIS feature layer | The symbols of its ArcGIS styling, up to 30 classes. |
| ArcGIS map or image service | The legend published by the service. |
| ArcGIS web map | One group, with a section for each layer in the web map. |
| ArcGIS vector tile service | No legend. |
An ArcGIS layer bound to data that uses Use ArcGIS Symbology also shows its ArcGIS symbols in the legend, in place of the colors from the Format pane.
Each of these layers has two settings under Legend labels:
| Setting | What it does | Default |
|---|---|---|
| WMS layer {n} in legend, ArcGIS Layer {n} in legend | Includes the layer in the legend. | On |
| WMS layer {n} title, ArcGIS Layer {n} title | The heading for the layer in the legend and the layer control. | Empty |
Things to know:
- A WMS legend is shown only for a layer that needs no sign-in, or whose key travels in the link. A layer that signs in another way has no legend.
- A hidden layer has no legend, and a legend follows its layer's visible zoom range.
- ArcGIS legends are read from the service after the map draws, so they can appear a moment after the rest of the legend.
See Raster tiles, WMTS and WMS and ArcGIS layers.
Tips and limits
- The legend sits in a corner of the map and cannot be dragged. If it covers a control, move it to another corner with Position.
- The layer control lets readers show and hide layers. Their choices last for the session only and are not saved with the report.
- Use {layer} title to replace technical names such as Esri features or Overlay 1 with words your readers know.