
Icon Map Catalog layers
The Icon Map Catalog holds ready-made boundary layers, such as countries, states, regions, local authorities and postcodes. Join one to your data and color each boundary from a measure, without finding, preparing or hosting a boundary file yourself.
Catalog layers are read from the Icon Map Catalog service, so they need an internet connection. They are not available when Airgapped Environment is turned on. See Power BI Report Server (on-premises).
What you need
Add these fields to the visual:
| Field well | What to put in it |
|---|---|
| ID | A unique value for each row. |
| Feature Reference | The value that identifies each boundary in the catalog layer, for example a postcode, a state code or a country name. |
A typical table looks like this:
| ID | Feature Reference | Sales |
|---|---|---|
| TX | TX | 120 |
| CA | CA | 85 |
| NY | NY | 64 |
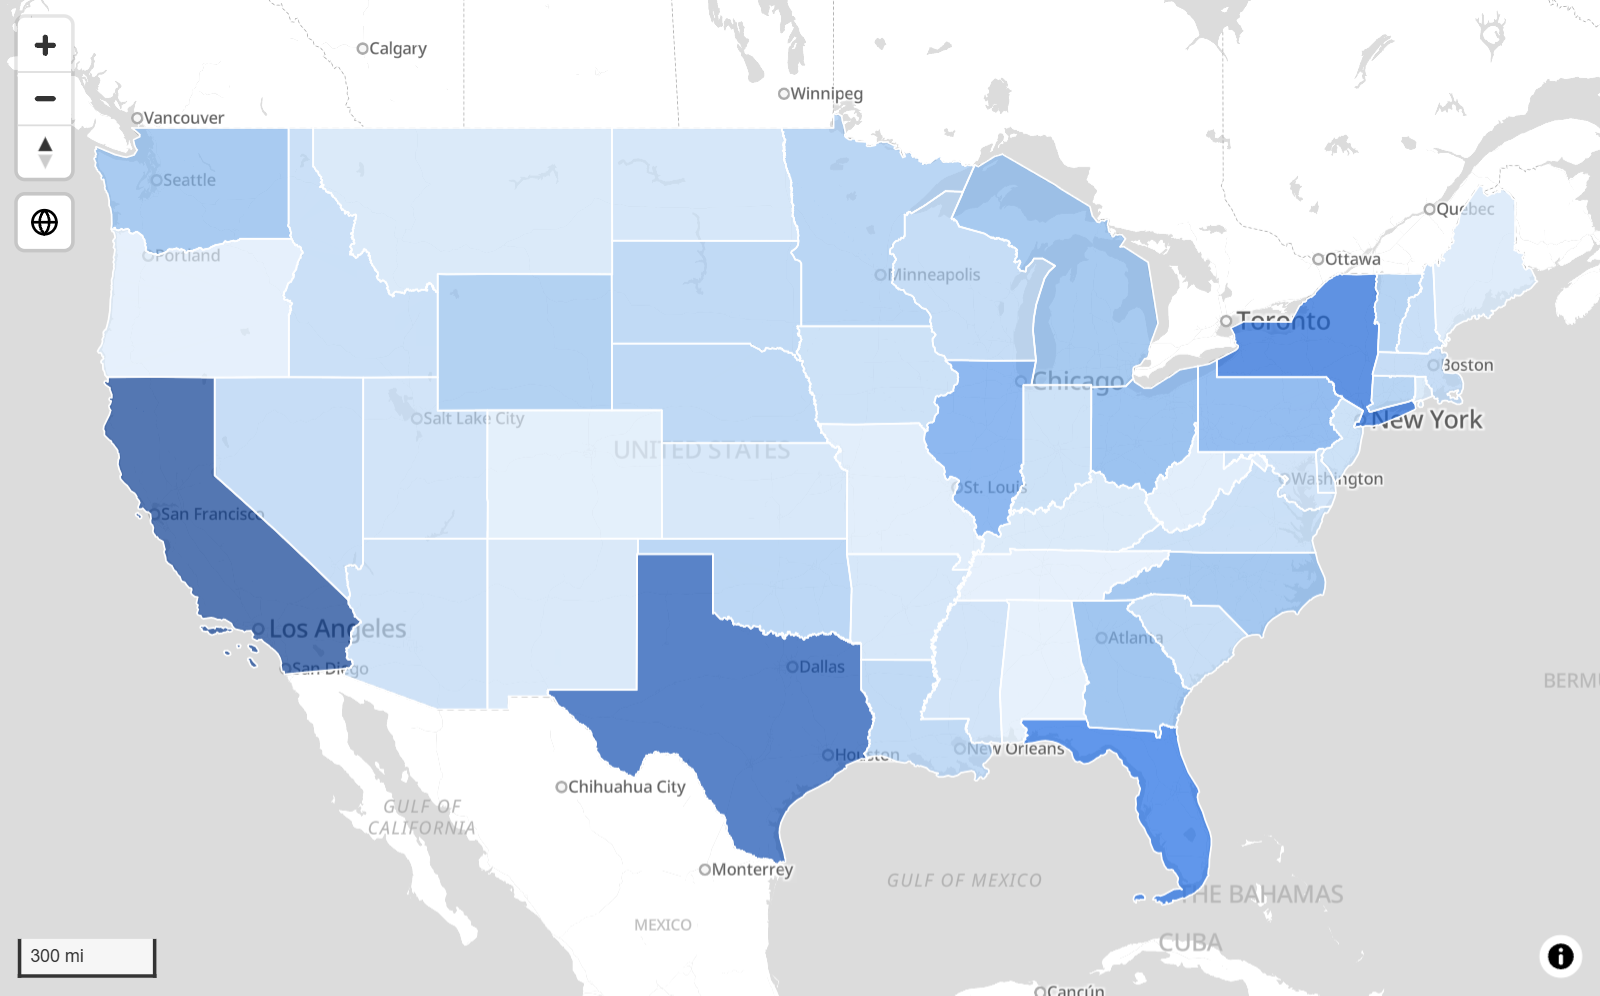
Unlike most data layers, a catalog layer does not need the other field wells to be empty. Any row with a Feature Reference value is offered to every catalog layer that is bound to data, as well as to whichever other layer draws it.
Add a catalog layer
- Add ID and Feature Reference to the visual.
- In the Format pane, open Layer Manager and turn on Open Layer Manager.
- Select Add a layer, then Data layer, then the Catalog layers tile.
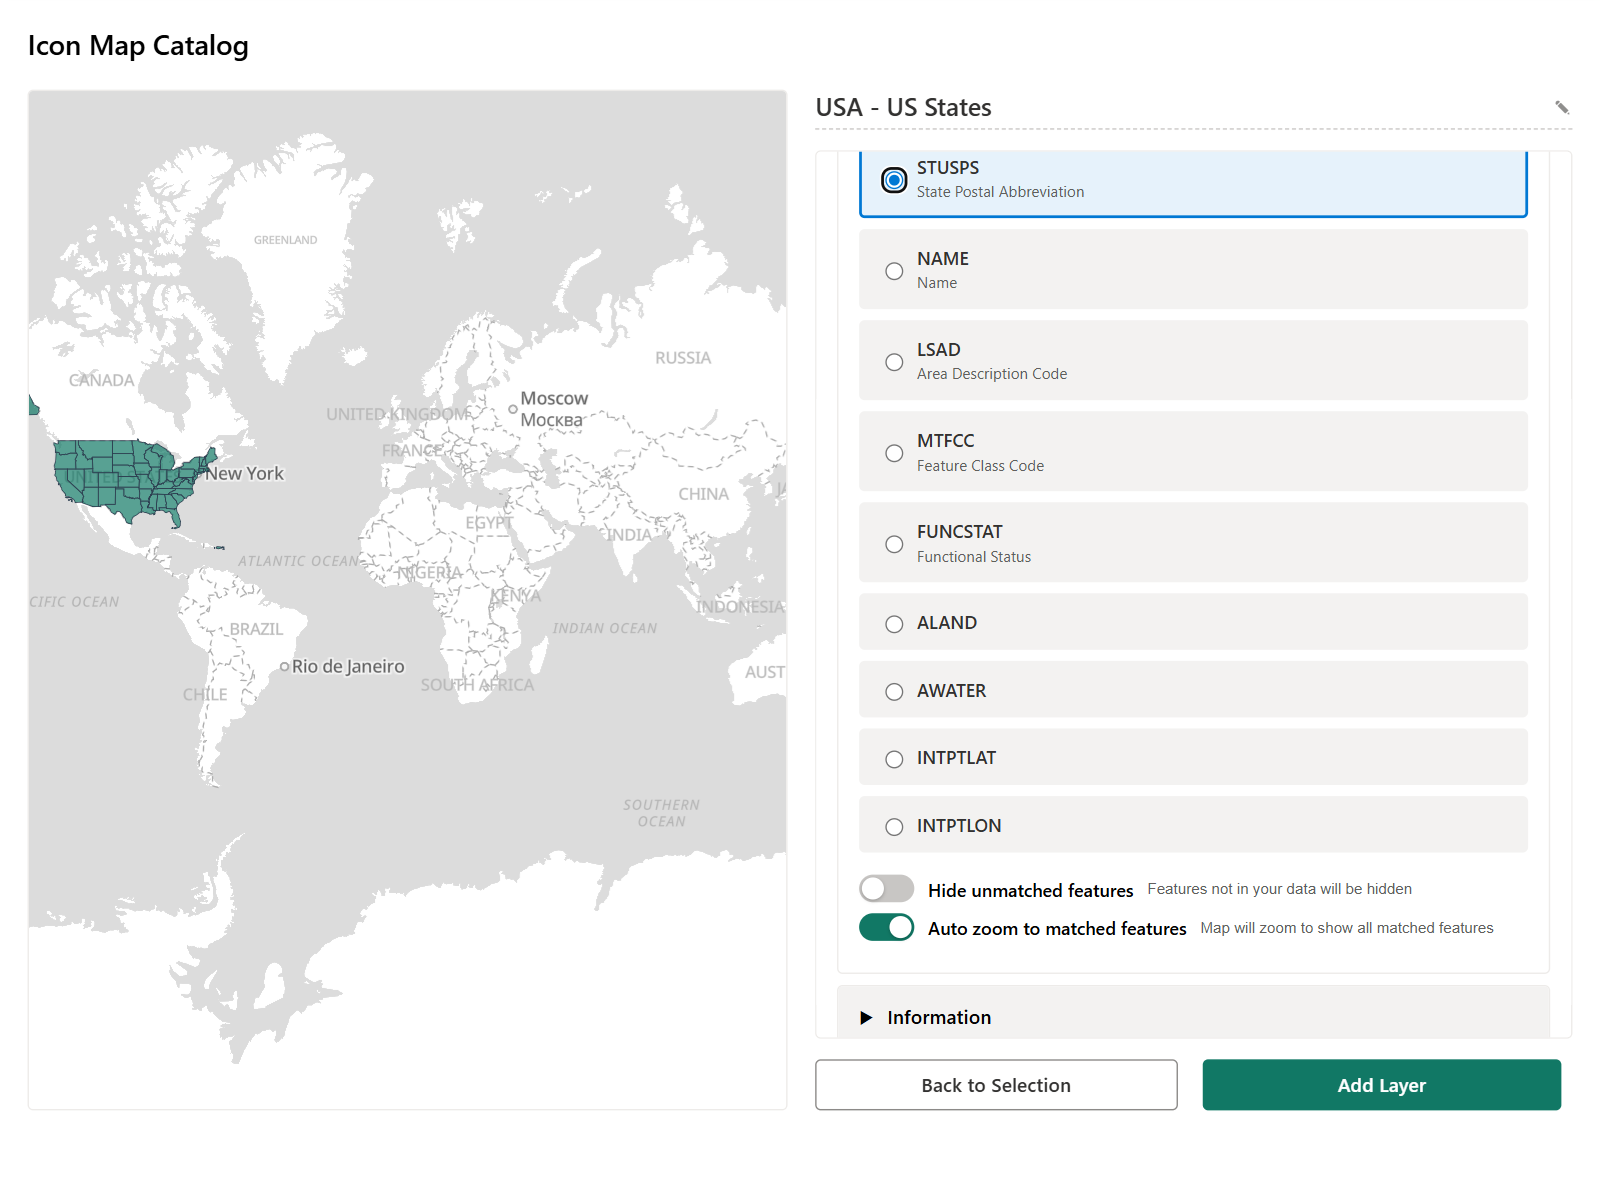
- Select Open the Icon Map Catalog. The catalog opens in its own window.
- Search for the boundaries you need, for example "US states" or "UK postcode districts", and select a layer.
- In the layer's Data Binding section, choose the field of the layer that holds the same values as your Feature Reference field. For US states that is the two-letter state code.
- Select Add Layer. The Layer Manager comes back with the layer on the map.
Opening the catalog saves any other changes waiting in the Layer Manager first. You can also open the catalog from the Format pane: Catalog > Catalog Layers > Configure Layers. See Add a layer.
The catalog window
The catalog window lists the catalog layers already on the map, and lets you add, change and remove them.
- + Add New Layer from Catalog opens the search. The Icon Map Catalog tab holds the public catalog. The Organizational Catalogs tab holds layers your organization has published with Icon Map for Fabric. You sign in to it with your organizational account.
- The search opens on the AI search tab, where you describe what you want in plain words, for example "Latest UK local authority district boundaries". Select Filters to search with filters instead.
- Each layer has sections for its styling, filters and Data Binding.
- Nothing is saved to the report until you select Apply Changes.
Data binding options
In the Data Binding section, choose the field to join on. The join is not automatic: you choose the field of the catalog layer, and the data side is always your Feature Reference field. Then set:
- Hide unmatched features - hides boundaries with no matching row, so only the areas in your data are shown.
- Auto zoom to matched features - zooms the map to the boundaries that match your data.
- Max Zoom for Auto-Zoom - shown only for catalog layers that offer it. How detailed a zoom level the map reads to find your boundaries. Higher values find more features, but can take longer to load.
A catalog layer with no data binding is a reference layer. It is drawn with the styling chosen in the catalog and is not joined to your data. See Reference layers overview.
How the join works
Your Feature Reference value is compared with the chosen field of each boundary, as text. The values must be the same, including case, spaces and leading zeros. 01 does not match 1.
A matched boundary:
- Takes its color and height from the Format pane settings below, which you can drive from your data.
- Shows the fields in Tooltips when you point at it.
- Can be selected, to cross-filter and cross-highlight the rest of the report.
Keep one row for each boundary. If your data has several rows for a boundary, summarize them so each Feature Reference value appears once.
Style with your data
Each catalog layer on the map has its own group in the Catalog card, named after the layer. The settings shown depend on how the layer was set up in the catalog.
| Setting | What it does | Shown when | Default |
|---|---|---|---|
| Layer Visible | Shows or hides the layer. With conditional formatting, a measure can switch it on and off. fx | Always | Yes |
| Fill Color | The fill color of each matched boundary. Select fx to color by a measure. Unmatched boundaries take the color set here. fx | The layer is bound to data and its fill in the catalog is a single color | #DDDDDD |
| Outline Color | The outline color. fx | The layer is bound to data, its outline in the catalog is a single color, and it is not extruded | #000000 |
| Extrusion Height | Raises each boundary in 3D, 0 to 100000. Select fx to set the height from a measure. fx | The layer is bound to data and extruded | 1000 |
| Selected Variant | Chooses which sub-layer of a layer group is shown. Type a variant ID or label, or select fx to bind a field so a slicer can control it. Use Copy values in the catalog window to get the list of IDs. fx | The layer is a group with variants | Empty |
| Filter: followed by the filter's name | The value for a filter set up on the layer in the catalog. Separate several values with commas. fx | The layer has filters | The value set in the catalog |
| Color Data Field | The property of the layer that drives its catalog color scale. fx | The layer is colored by one of its own properties | The property chosen in the catalog |
| Extrusion Data Field | The property of the layer that drives its height. fx | The layer is extruded by one of its own properties | The property chosen in the catalog |
| Z Index | Position in the drawing order. Layers with a higher value draw on top. fx | The layer has a position set | 300 |
Settings marked fx accept conditional formatting.
Coloring from your data needs the layer's fill to be a single color in the catalog. A layer styled in the catalog with a gradient or rules keeps that styling. Set the fill to a single color in the catalog window, then select fx next to Fill Color in the Format pane.
In the Layer Manager
Each catalog layer is a row in the Layer Manager. A layer bound to data is listed as Catalog - joined to your data. Select the row to change Visible, or select Open the Icon Map Catalog to change its styling, filters and data binding. Drag the row to change the drawing order. Catalog layers are removed in the catalog window. See Edit, reorder and remove layers.
Licensing
Some catalog layers are free to use and others need a license. The catalog window shows what each layer needs, and Add Layer is unavailable for a layer that your license does not cover.
Reports that use a license key, for example in Power BI Embedded, enter it in the Format pane under Icon Map Pro, in License Key (for non-user based licensing). See License types and License keys and activation.
Tips and limits
- Nothing is colored. Check that the Feature Reference values match the join field exactly, including case, spaces and leading zeros.
- Some boundaries are missing. Boundary codes change over time. Check that the layer's edition matches the codes in your data.
- A layer that needs a license draws nothing. If the report has no valid license for a layer, the layer is not drawn and no message is shown. Check the license first when a catalog layer is blank.
- A map can hold up to 20 catalog layers, counting data-bound and reference layers together.
- A layer can have up to five filters in the Format pane.
- Each layer's attribution is added to the map's attribution automatically.