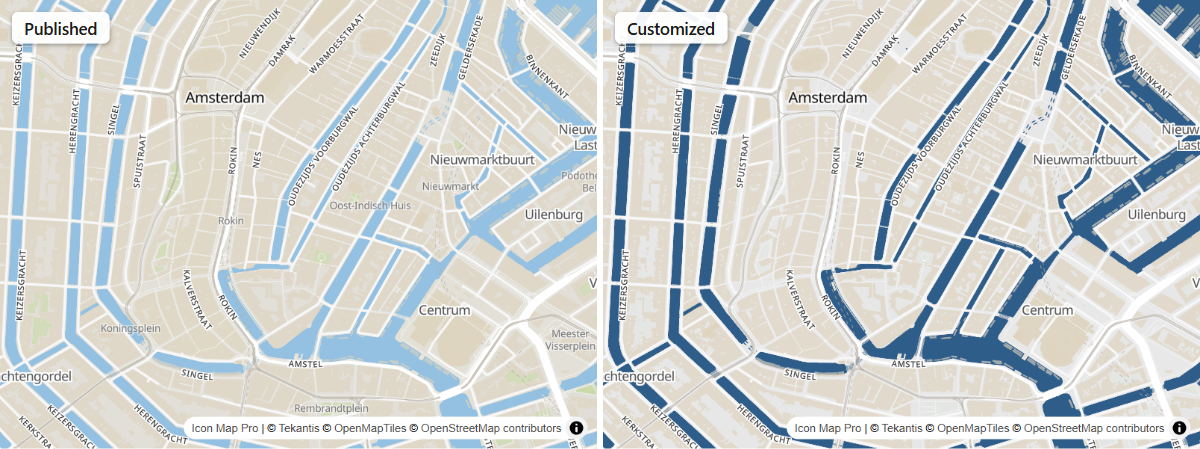
Customize a basemap style
The style editor changes how a basemap looks: recolor the water, hide a kind of road, make labels smaller, fade a layer out as you zoom. Every change shows on a live preview, and only your changes are saved.
Before you start
The style editor is part of the Basemaps dialog, so it is available on maps that use that dialog.
These basemaps can be customized:
- Icon Map styles
- Icon Map Catalog basemaps
- MapLibre style links
- ArcGIS basemaps whose source is ArcGIS style, OpenStreetMap style or Custom style
- Ordnance Survey Vector Tiles
Basemaps made of pictures cannot be customized: ArcGIS tiled services and web maps, Azure Maps, Mappable, the Ordnance Survey raster styles, tile servers, WMS and Blank.
Recolor a basemap: the quick path
- Open the Basemaps dialog and select the basemap in the list.
- Select Customize style. The editor opens over the dialog.
- Select the Colors tab on the left. It lists every color the style draws with.
- Select a color, for example the water blue, and choose a New color. Every layer that uses it changes on the preview.
- Select Done to return to the Basemaps dialog, then Apply changes to save.
The basemap now shows a Customized badge in the list, and its button reads Edit style.
To offer both the original and your version, select Duplicate first and customize the copy.
How your changes are saved
The editor does not save a copy of the style. It saves only the differences between the published style and yours, and applies them each time the map loads the style.
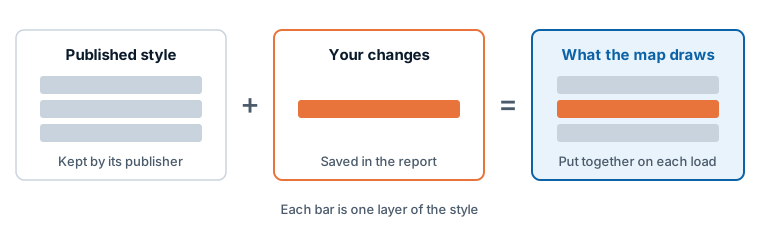
This means a customized basemap keeps following the publisher's updates. If the published style later changes so much that your changes no longer fit, they are dropped and the basemap draws in its published form.
Reset style in the Basemaps dialog removes your changes.
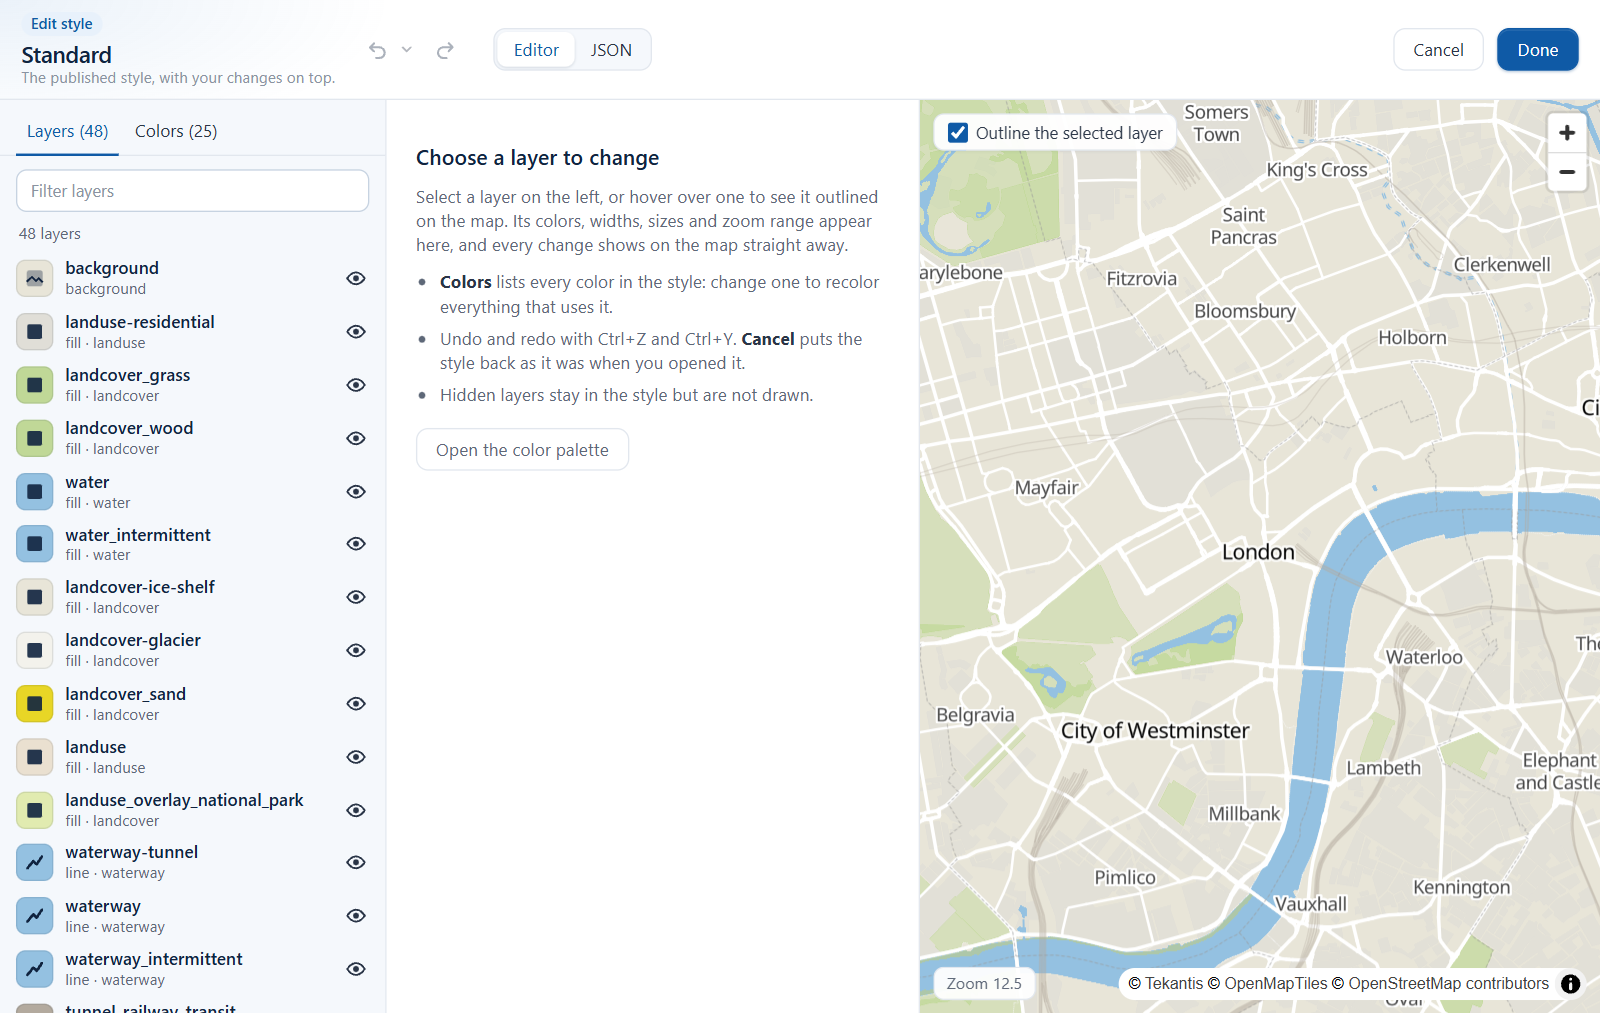
A tour of the editor
| Area | What it holds |
|---|---|
| Left | Two tabs: Layers and Colors, each with a count |
| Middle | The properties of the selected layer, or the selected color |
| Right | The live preview map, which shows its current zoom level |
| Top | Undo, Redo, the undo history, the Editor / JSON switch, Cancel and Done |
Undo and redo with Ctrl+Z and Ctrl+Y. The undo history menu steps back several changes at once. Cancel puts the style back as it was when you opened the editor.
Layers
A basemap style is a list of layers: the background, water, land use, each class of road, buildings, each kind of label. The Layers tab shows them all. The top of the list is drawn first, underneath the rest.
- Type in Filter layers to find a layer by its name, type or the data it draws.
- Hover over a layer, or select it, to outline it on the preview.
- Select the eye on a row to hide or show the layer. Hidden layers stay in the style but are not drawn.
Layers have one of these types: Background, Fill, Line, Symbol (labels and icons), Circle, 3D buildings, Heatmap, Raster and Hillshade. Under each layer's name the list shows its type and the source layer it draws, for example "Line · transportation". The types, like the property names, are shown in the report's language.
Change a layer
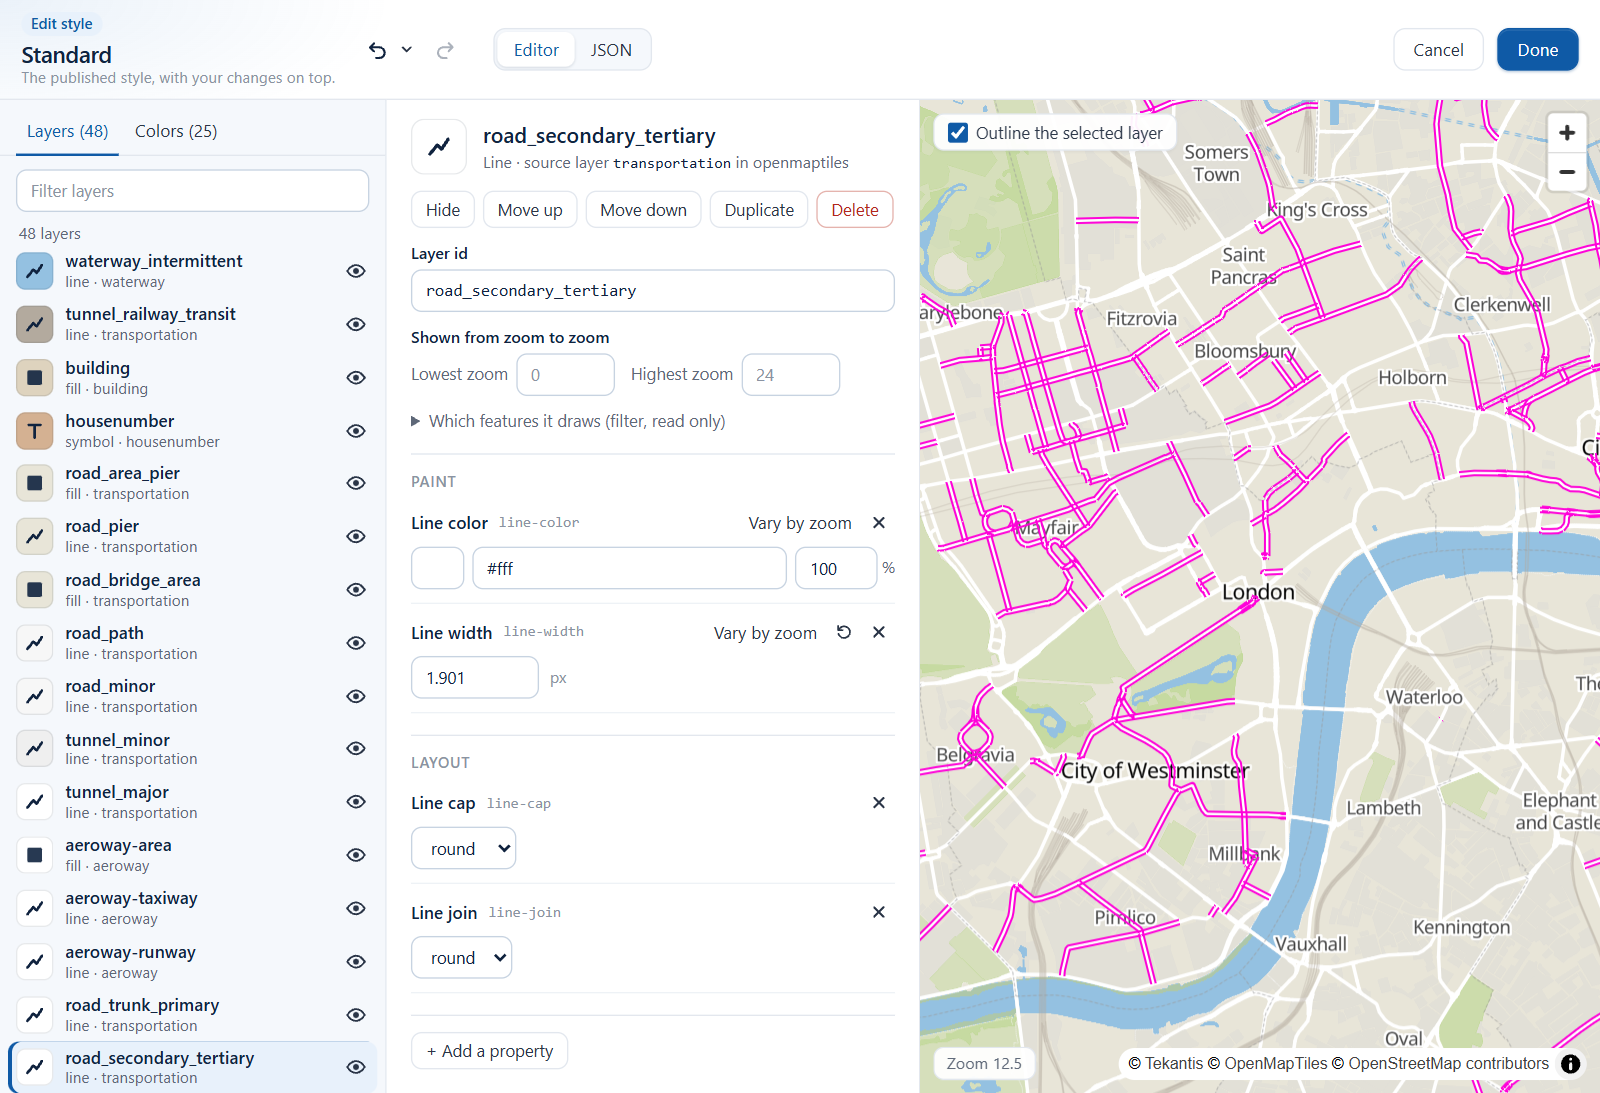
Select a layer to see its properties in the middle.
| Part | What you can do |
|---|---|
| Layer actions | Hide or Show, Move up (draw it earlier, under the layers below it in the list), Move down (draw it later, over the layers above it), Duplicate, Delete |
| Zoom range | Lowest zoom and Highest zoom: the zoom levels between which the layer is shown |
| Paint | How the layer is drawn: colors, opacity, widths, and so on |
| Layout | How the layer is placed: visibility, and for labels the text, fonts and size |
| + Add a property | Adds a property the layer does not set yet. Search by name, for example "opacity" or "halo" |
Property names, such as Fill color or Text halo width, are shown in the report's language. Each property has the control that suits it: a color picker with an opacity, a number box with its unit (such as px, with a slider where the property has a fixed range), a switch, a list of choices or a text box. Beside each property you can go back to the published value, or remove it so the default is used.
A layer's source and its filter are shown but cannot be changed. They are the data the basemap is made from.
Only valid values are applied. If a value is refused, the editor says "Not applied" and gives the reason, and the last valid value stays in place.
Change a value by zoom level
Many properties can change as the reader zooms, for example a road that gets wider as you zoom in.
Select Vary by zoom on a property to turn its single value into a table of stops, each a zoom level and a value. Add a stop adds a row. A small chart shows the ramp and marks the preview's current zoom. One value turns it back, keeping the value at the preview's zoom.
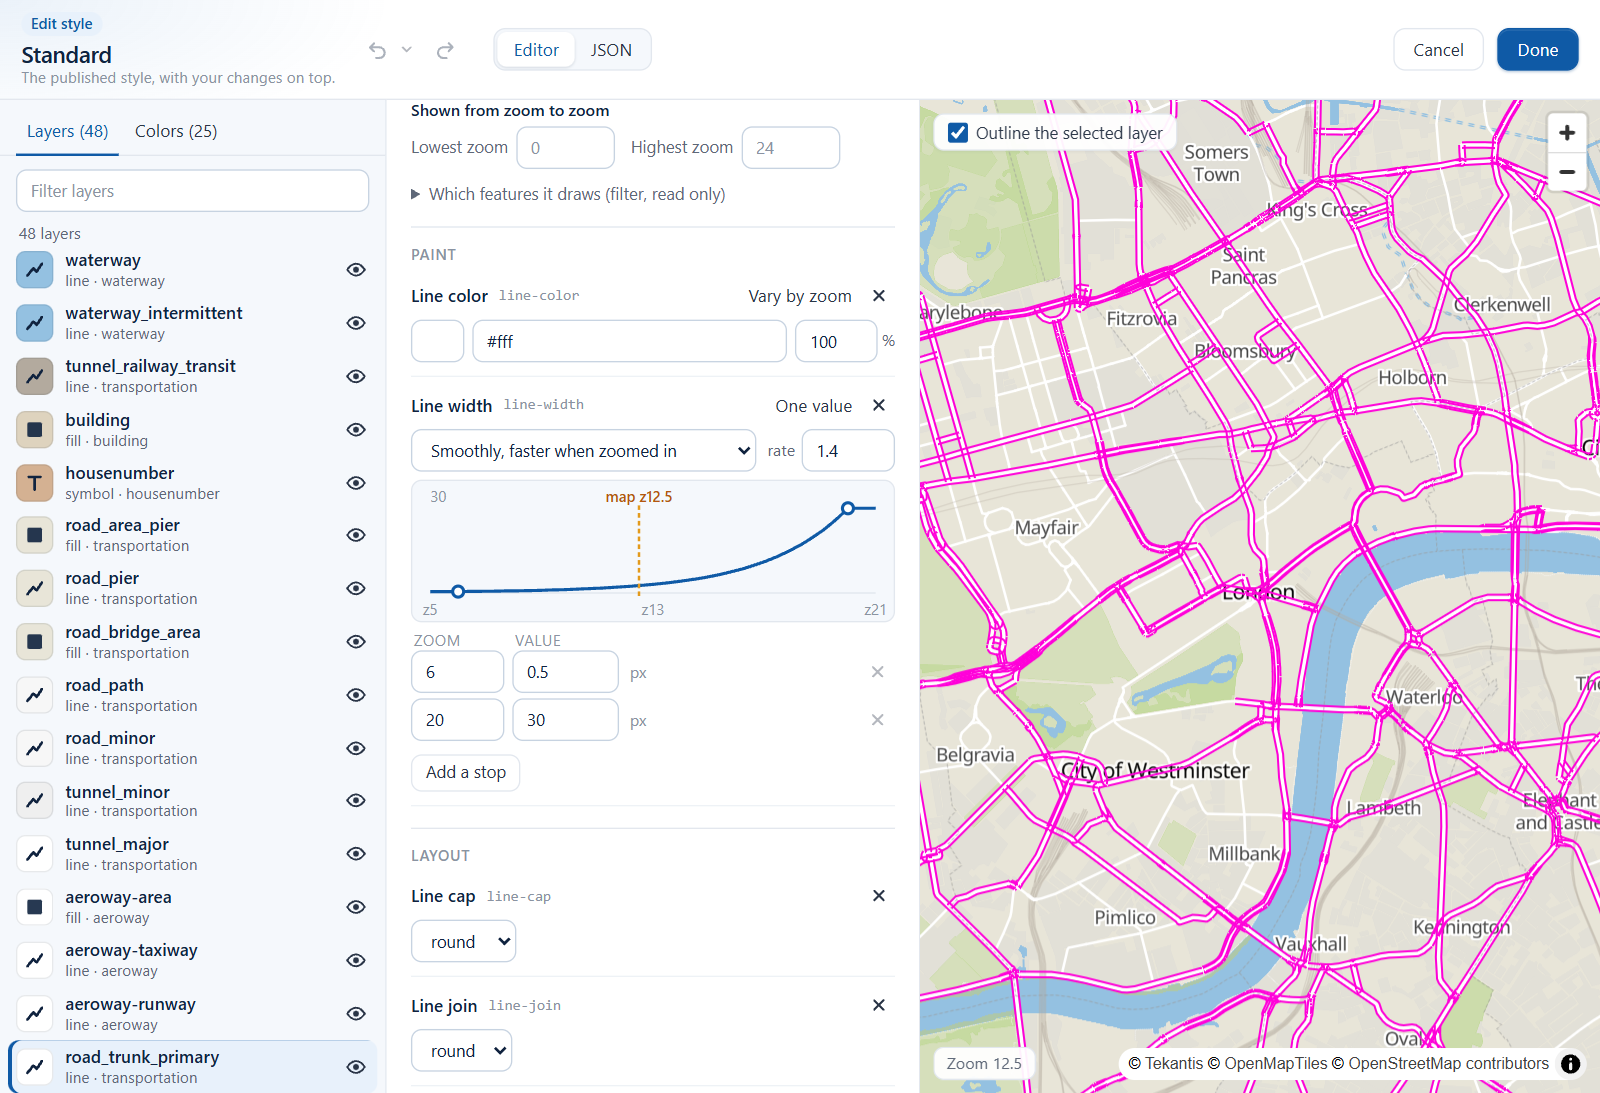
Choose how the value moves between stops:
| Choice | Effect |
|---|---|
| Smoothly (linear) | Changes evenly between stops |
| Smoothly, faster when zoomed in | Changes slowly at first, then faster, at a rate you set |
| In steps | Each value applies from its zoom level up |
| Along a curve (cubic bezier) | Follows a curve you define |
Values that depend on the feature
Some properties set a different value for each category of feature, for example a color per road class. The editor shows these as a table: each row lists the categories and their value, with Everything else as the last row. Use Add a category to add a row.
Colors
The Colors tab lists every color in the style, ordered by hue, with how many times and in how many layers each is used.
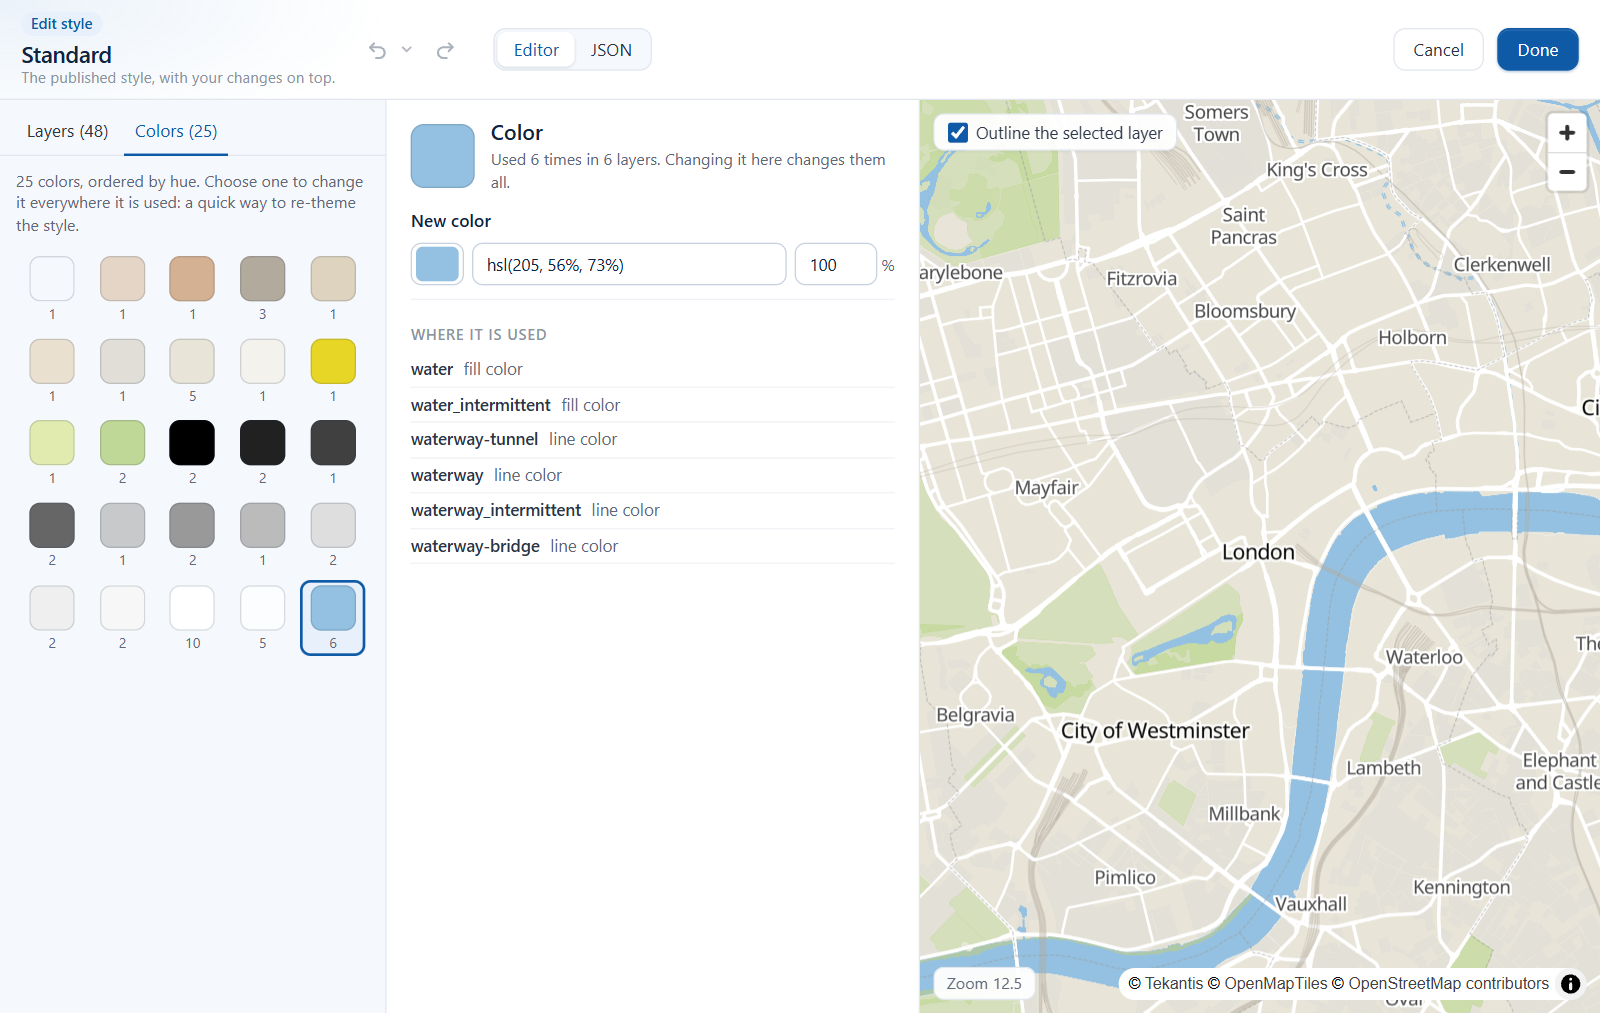
Select a color and set New color. The change applies everywhere the color is used: all the water blues, say, or the halo around every label. Where it is used lists the layers and the properties that use it, by their names in the report's language. This is the fastest way to re-theme a style.
Labels and language
Labels are Symbol layers. You can hide them, or change their font, size, color and halo like any other property.
The editor has no language setting. Place names follow the basemap's Language option in the Basemaps dialog, which starts on Report language. To change the language of place names, choose another language there. See Icon Map basemap styles.
JSON view
Switch from Editor to JSON to see and edit the whole style as text. Valid changes show on the preview as you type.
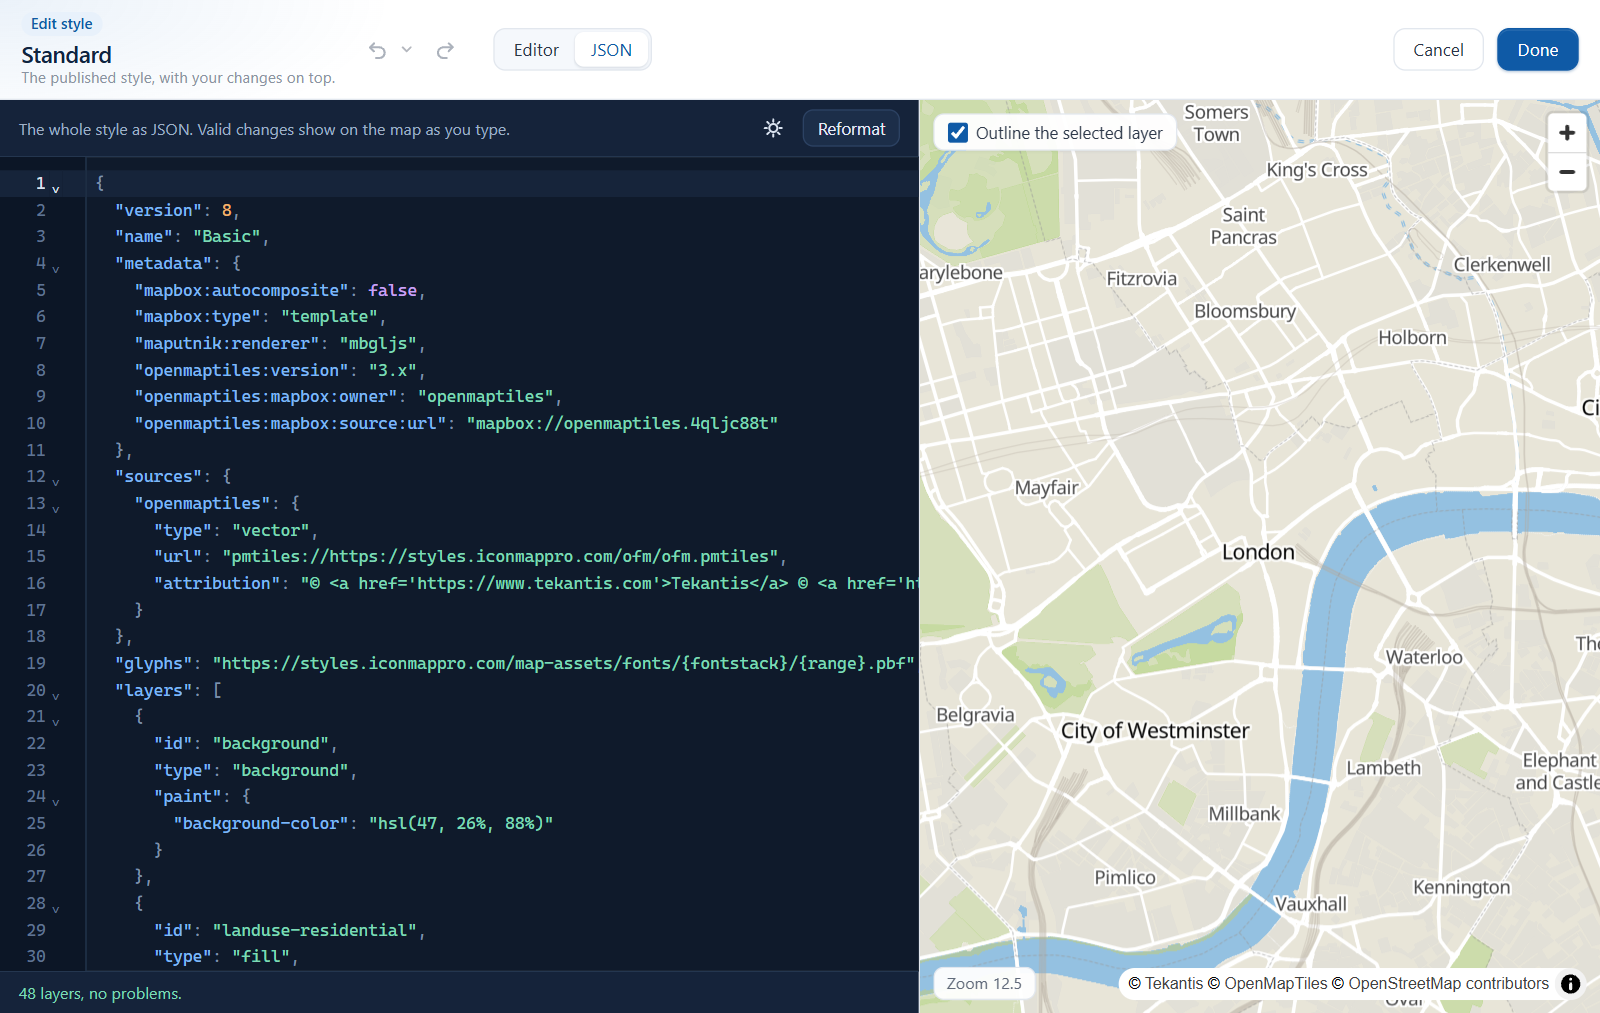
- The editor has line numbers, folding, search and replace, and a light and a dark theme.
- When the JSON has an error, nothing is applied and the status line names the line. Fix the error, or select Reformat to return to the last valid style.
- You cannot switch back to Editor, or select Done, while the JSON has an error.
Problems
If a layer ends up with a value the map cannot draw, a banner counts the problems, and the layer is marked in the list. Layers with problems are left off the map until they are fixed. When you select Done with problems outstanding, the editor asks whether to Keep editing or Keep anyway.
Tips and limits
- The editor changes how existing data is drawn. It cannot add new map data or new tile sources to a style.
- A style cannot be loaded from, or saved to, a file.
- If the editor says "This style cannot be edited here.", the style could not be read inside the dialog. This happens with paid catalog basemaps, and with ArcGIS styles before the report is connected to ArcGIS.
- For a few simple changes to an Icon Map style, such as hiding labels, roads or buildings, the switches under Options are quicker than the editor.