
ArcGIS layers bound to data
This layer draws the features of a layer in ArcGIS Online or ArcGIS Enterprise and joins each one to a row of your data. Use it when your organization already publishes its boundaries, assets or networks in ArcGIS and you want to color and select them from Power BI without exporting files.
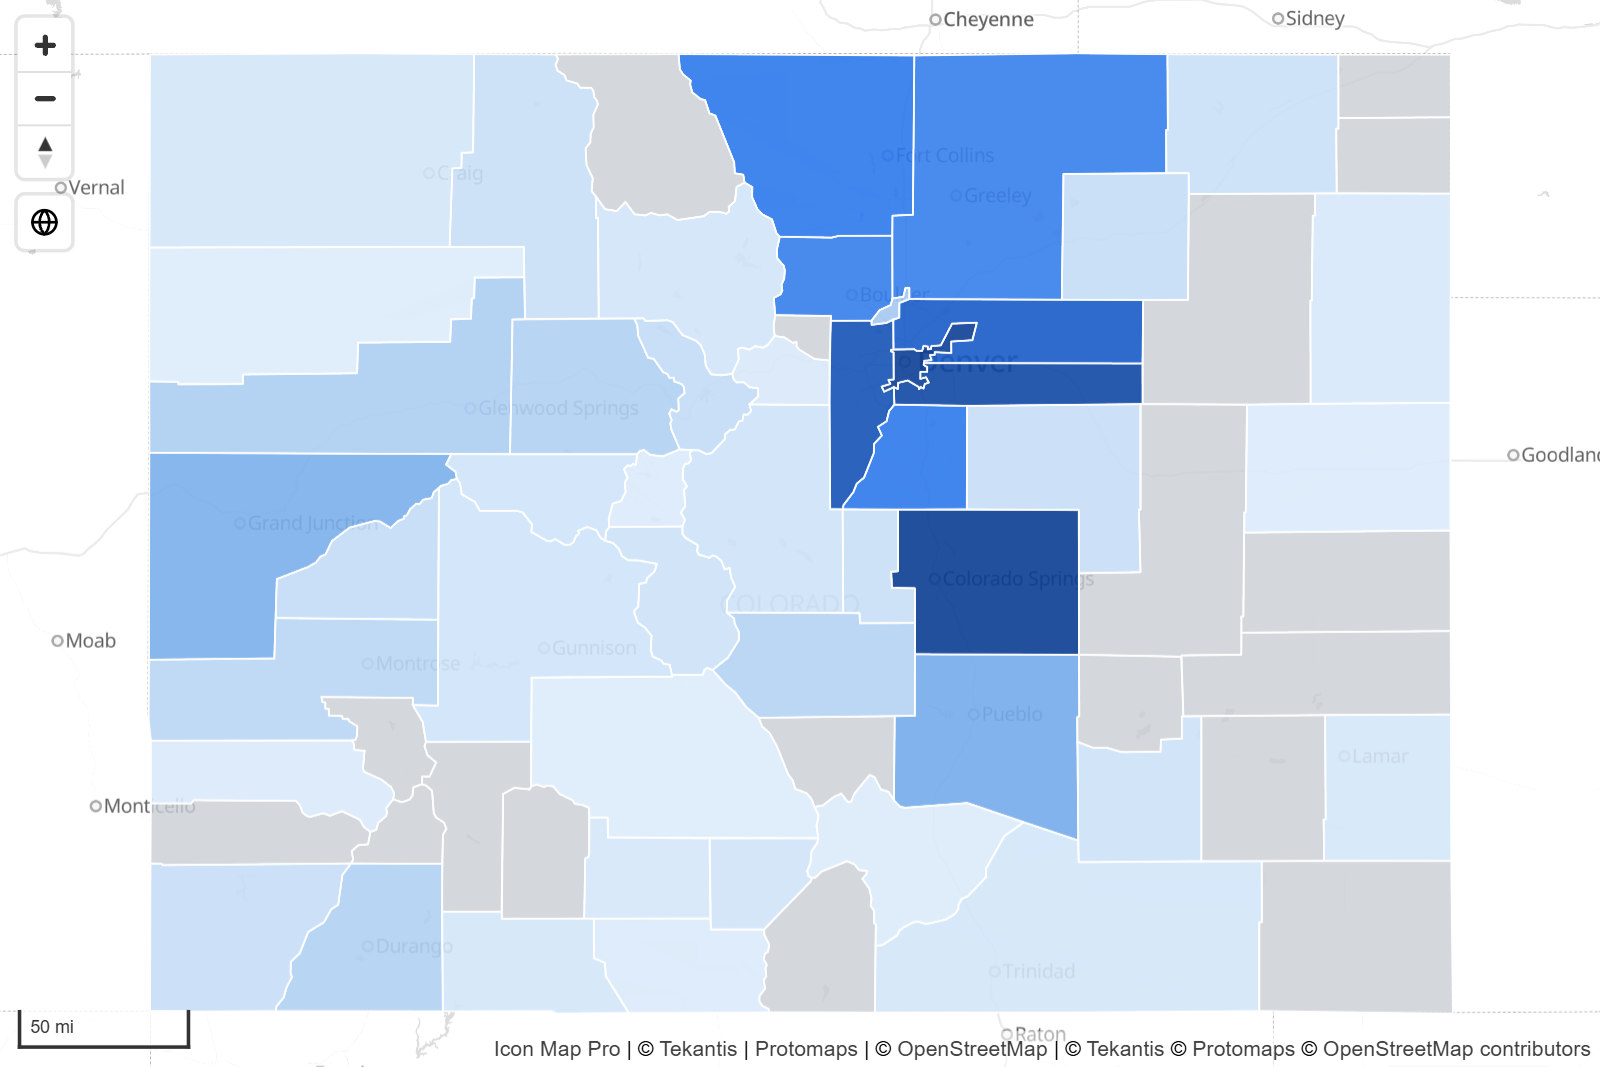
To draw an ArcGIS layer as it is published, without joining it to your data, use an ArcGIS reference layer instead.
What you need
Add these fields to the visual:
| Field well | What to put in it |
|---|---|
| ID | A unique value for each row. |
| Feature Reference | The value that identifies the feature in ArcGIS, for example an asset number or area code. |
You also need the ArcGIS layer, and access to it. Public layers need no credential. For secured layers, set up the connection first, see Connect to ArcGIS.
In the Format pane this layer is called ArcGIS Layer. In the Layer Manager its tile is called ArcGIS feature layer.
Add the layer
- Add ID and Feature Reference to the visual.
- In the Format pane, open Layer Manager and turn on Open Layer Manager.
- Select Add a layer, then Data layer, then the ArcGIS feature layer tile.
- Select Browse ArcGIS. Browse ArcGIS opens in its own window.
- Search for the layer, or paste its URL, item page or item id into the search box. Select it to see a preview.
- Under Join to your data, choose the field that holds your Feature Reference values. The list shows the fields that match your data, each with the percentage of sampled values that match, plus Any property (search every field). The best match is chosen for you.
- Select Use this layer. The Layer Manager comes back with the layer on the map.
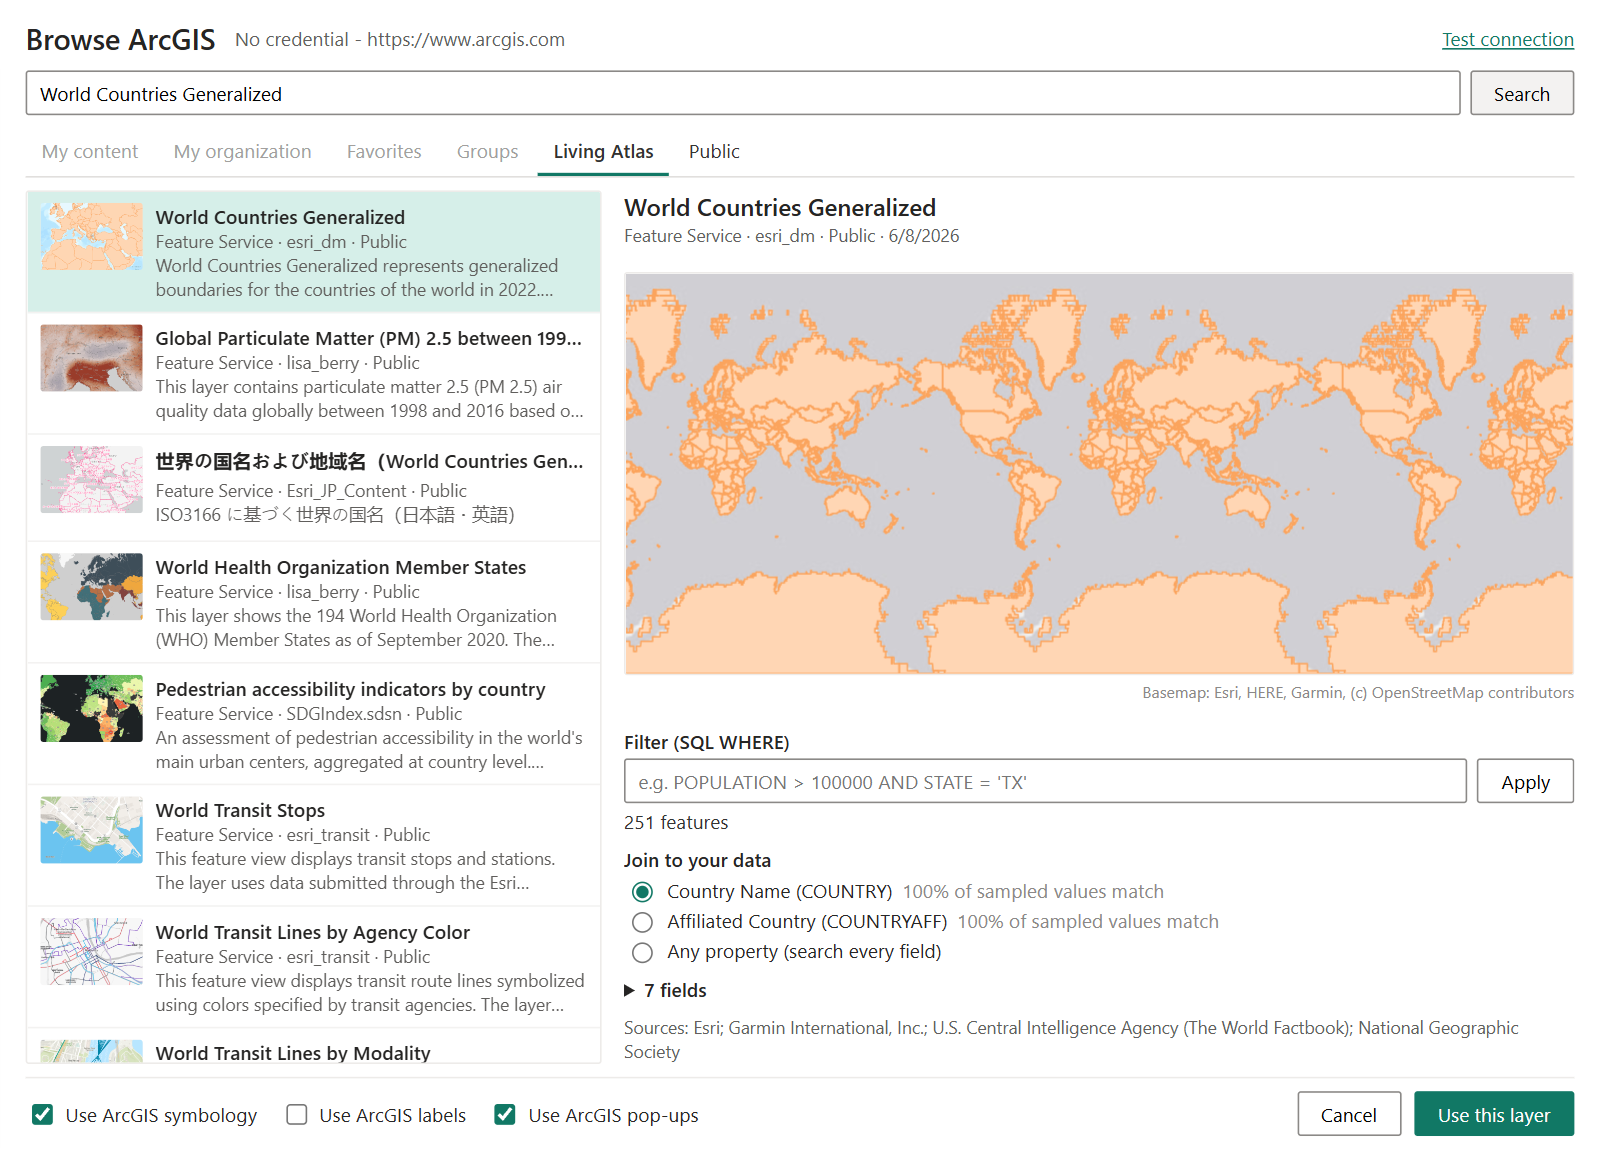
The footer of Browse ArcGIS also has the check boxes Use ArcGIS symbology, Use ArcGIS labels and Use ArcGIS pop-ups.
Opening Browse ArcGIS saves any other changes waiting in the Layer Manager first.
You can do the same from the Format pane: in Data Layers, turn on ArcGIS Layer, then in ArcGIS Layer - Configuration turn on Browse ArcGIS, or paste a link into ArcGIS Layer URL. To color each feature from your data, select the fx button next to ArcGIS Layer - Formatting > Fill Color.
Links you can use
| Link | What is drawn |
|---|---|
A layer, such as .../FeatureServer/3 or .../MapServer/3 |
That layer. |
A service, such as .../FeatureServer or .../MapServer |
The first layer of the service that has features. If the service has several, pick another in Layer. |
An item page, such as https://myorg.maps.arcgis.com/home/item.html?id=... |
The item's layer. |
| An item id (32 characters) | The item, looked up on your Portal URL, or ArcGIS Online when that is empty. |
A vector tile service, .../VectorTileServer |
The tiles, joined to your data. See Vector tile services. |
How the join works
Each ArcGIS feature has attributes. The layer compares your Feature Reference value with an attribute of each feature, as text. Where they are the same, the feature takes that row's formatting and tooltips and can be selected.
- Turn on Match a Specific Property and choose the field in Property to Match. Once the map has read the layer, Property to Match is a list of the layer's fields.
- With Match a Specific Property off, every attribute of every feature is checked, which is slower.
- If several rows have the same Feature Reference value, the first row is used.
- Features with no matching row are drawn in the unmatched colors and cannot be selected. Turn on Remove Unmatched Shapes to hide them.
With Match a Specific Property on, each field in the Property to Match list shows how well it matches a sample of your values, for example "85% match", and the best match is preselected. A note under it reports how many of your Feature Reference values matched a feature. Use it to spot keys that are written differently in your data and in ArcGIS, such as missing leading zeros.
Load only the features you need
A large ArcGIS layer can hold far more features than your report uses. Two settings limit what is requested from ArcGIS:
- Automatically filter - when your data has 350 rows or fewer, and Match a Specific Property is on, only the features that match your rows are requested. With more rows, the whole layer is requested. This works well with drill-down and with slicers that narrow the data.
- ArcGIS SQL WHERE Clause - a filter in ArcGIS SQL, such as
POPULATION > 1000000. It is used when Automatically filter is off and Match a Specific Property is on. It accepts conditional formatting, so a measure can build the filter from the current slicer selection.
Small layers, up to 5,000 features and about 8 MB, are loaded whole. Larger layers are loaded in tiles as you pan and zoom, simplified for the zoom level, so they stay fast.
Decimal Precision and Simplification Factor only matter for some ArcGIS servers, so the Format pane shows each of them only when the layer uses it:
- Decimal Precision is the number of decimal places ArcGIS returns for each coordinate, 0 to 15. Fewer places mean a smaller download and coarser shapes. Five places is about one meter. It is shown when the server sends features as JSON and does not simplify them itself. Layers hosted in ArcGIS Online send them in a compact binary format that ignores it.
- Simplification Factor is how much shapes are simplified, 0 to 100, when a large layer is loaded in tiles from a server that cannot simplify the tiles itself. Layers hosted in ArcGIS Online simplify each tile for the zoom level themselves, and a layer that is loaded whole is drawn as it is.
Both are shown until the map has read the layer. A value you set is kept, and is used again if you change to a layer that needs it.
Use the layer's ArcGIS styling
New in 1.1.0.11
A layer can be drawn with what its publisher set up in ArcGIS:
- Use ArcGIS Symbology draws the layer with its ArcGIS symbols instead of the colors in the Format pane. The styling saved on the item in ArcGIS Online is used when there is one. The layer's ArcGIS legend then appears in the legend. If the ArcGIS styling cannot be drawn, the Format pane colors are used.
- Use ArcGIS Labels draws the labels defined on the layer in ArcGIS, with their fonts, colors and visible zoom range.
- Use ArcGIS Pop-ups adds the layer's pop-up fields to the tooltip, in the pop-up's order, with its field names, number and date formats. Your own Tooltips fields come first.
- Refresh Interval (seconds) reloads the layer from ArcGIS on a timer, for layers that change while the report is open. 0 turns it off, and the shortest interval is 10 seconds.
See ArcGIS layers for what Icon Map Pro can draw from ArcGIS symbology, labels and pop-ups.
Visible zoom range
With Use ArcGIS Symbology on, the layer also keeps the visible range its publisher set in ArcGIS, as it does in the ArcGIS Map Viewer: it is hidden when the map is zoomed out or in past those scales. The range saved on the item in ArcGIS Online is used when there is one. Min Zoom and Max Zoom can narrow the range further, but cannot show the layer outside it.
For example, the states layer of Esri's USA Boundaries 2023 service is visible from 1:75,000,000. With Use ArcGIS Symbology on, it appears from zoom 2. With it off, it appears from zoom 0.
To check a layer's range, open it in the ArcGIS Map Viewer and look at its visible range, or look for Min. Scale and Max. Scale on the layer's page in the ArcGIS REST services directory. To show the layer at every zoom, turn off Use ArcGIS Symbology and color the layer with the Format pane settings.
Vector tile services
New in 1.1.0.11
You can paste a vector tile service, or choose one in Browse ArcGIS. Vector Tile Layer then lists the layers inside the tiles. Choose the one whose shapes should be joined to your data.
Many ArcGIS vector tile services carry shapes only, with no attributes. In that case there is nothing in the tiles to join to. If the service was published from a hosted feature layer, your data is joined to that feature layer instead, and a note in the Format pane tells you so. Otherwise the shapes are drawn without a join, and a note suggests using the feature layer or a vector tile service published with attributes.
ArcGIS symbology, labels and pop-ups are not available for a vector tile join.
Drill down and several layers
The layer can hold up to five ArcGIS layers. Display multiple layers as in the Setup group decides how they are used:
- Drill-Down - one layer is drawn at a time, following Power BI's drill level. Put a hierarchy in ID, set Number of Levels, and give each level its own ArcGIS layer and property to match. For Feature Reference, add one field used at every level, or one field for each level in the order of the hierarchy.
- Multiple Layers - all the layers are drawn together. Each has a Feature Reference Field setting that picks which of your Feature Reference fields it is joined to.
Choose the level or layer to edit in Configure Level: or Configure Layer:.
Selection, tooltips and zoom
- Click a matched feature to select its row and cross-filter the rest of the report. See Selection, cross-filtering and highlighting.
- Pointing at a matched feature shows the fields in Tooltips. Add Property to Tooltip adds the matched property. Add All Properties to Tooltip adds the feature's ArcGIS attributes, or only the one named in Tooltip Property, with Tooltip Title as its label.
- Add Tooltips to Unmatched Shapes shows tooltips on features with no matching row.
- The map zooms to the matched features whose rows have Include in Auto Zoom set to Yes.
Settings
All settings are in Format pane > Data Layers, in the groups ArcGIS Layer - Setup, ArcGIS Layer - Configuration and ArcGIS Layer - Formatting. With more than one level or layer, the titles end with its number, for example ArcGIS Layer - Configuration (Level 2).
Settings marked fx accept conditional formatting.
Setup
| Setting | What it does | Default |
|---|---|---|
| Display multiple layers as | Drill-Down or Multiple Layers. | Drill-Down |
| Number of Levels / Number of Layers | How many ArcGIS layers, 1 to 5. | 1 |
| Configure Level: / Configure Layer: | The level or layer that the groups below edit. | 1 |
Configuration
| Setting | What it does | Default |
|---|---|---|
| ArcGIS Layer URL | The link to the layer, service or item. fx | Empty |
| Browse ArcGIS | Opens Browse ArcGIS to search, preview and choose a layer. | Off |
| Layer | The layer of the service to draw. Shown when the service has more than one. | Current layer |
| Vector Tile Layer | The layer of a vector tile service whose shapes are joined to your data. | Current layer |
| Use ArcGIS Labels | Draws the labels defined on the layer in ArcGIS. | Off |
| Use ArcGIS Pop-ups | Adds the layer's ArcGIS pop-up fields to the tooltip. | Off |
| Refresh Interval (seconds) | Reloads the layer on a timer. 0 turns it off. The minimum is 10 seconds. | 0 |
| Setting | What it does | Default |
|---|---|---|
| Feature Reference Field | Which Feature Reference field this layer is joined to. Shown in Multiple Layers mode, or when more than one Feature Reference field is added. | First field |
| Match a Specific Property | Compares one field instead of every attribute. | Off |
| Property to Match | The ArcGIS field that holds your key. | Empty |
| Add Property to Tooltip | Adds the matched property to the tooltip. | Off |
| Add All Properties to Tooltip | Adds the feature's attributes to the tooltip. | Off |
| Add Tooltips to Unmatched Shapes | Shows tooltips on unmatched features. | Off |
| Remove Unmatched Shapes | Hides features that match no data row. | Off |
| Tooltip Property | A single property to show in the tooltip. Leave blank to show them all. | Empty |
| Tooltip Title | The title shown against that property. Leave blank to use the property name. | Empty |
| Include Tooltip | Shows tooltips on matched features. fx | Yes |
| Include in Auto Zoom | Includes matched features when the map zooms to fit your data. fx | Yes |
| Selectable | Lets report users select features. fx | Yes |
| Visible | Shows or hides the level or layer. With conditional formatting, a measure can switch it on and off. fx | Yes |
| Automatically filter | Requests only the features that match your rows, when there are 350 rows or fewer. | Off |
| ArcGIS SQL WHERE Clause | A filter sent to ArcGIS. Unavailable when Automatically filter is on or Match a Specific Property is off. fx | Empty |
| Use ArcGIS Symbology | Draws the layer with its ArcGIS symbols. | Off |
| Simplification Factor | How much shapes are simplified when a large layer is loaded in tiles, 0 to 100. | 10 |
| Decimal Precision | Decimal places requested for coordinates, 0 to 15. | 5 |
| Min Zoom | The layer is hidden when the map is zoomed out past this level. | 0 |
| Max Zoom | The layer is hidden when the map is zoomed in past this level. | 24 |
| Z-Index | Position in the drawing order. Layers with a higher value draw on top. | 400 |
Simplification Factor and Decimal Precision are shown only when the layer uses them, see Load only the features you need above. With Use ArcGIS Symbology on, Min Zoom and Max Zoom work inside the layer's own visible range, see Visible zoom range above.
Formatting
| Setting | What it does | Default |
|---|---|---|
| Fill Color | Fill color of matched features. | Theme color |
| Outline Color | Outline and line color of matched features. | Theme color |
| Fill Transparency | 0 is solid, 100 is invisible. fx | 1 |
| Outline Transparency | 0 is solid, 100 is invisible. fx | 1 |
| Dash Array | A dash pattern for outlines and lines, as numbers separated by spaces or commas, for example 4 2. One pattern for the whole layer. |
0 (solid) |
| Outline Width | Width in pixels, 0 to 100. fx | 1 |
| Unmatched Fill Color | Fill color of unmatched features. | #CCCCCC |
| Unmatched Outline Color | Outline color of unmatched features. | #555555 |
| Unmatched Fill Transparency | 0 is solid, 100 is invisible. | 1 |
| Unmatched Outline Transparency | 0 is solid, 100 is invisible. | 1 |
| Unmatched Outline Width | Width in pixels, 0 to 100. | 1 |
Fill Color and Outline Color accept conditional formatting, so each feature can be colored from its row.
Polygons are drawn with a fill and an outline, lines with the outline settings, and points as circles of a fixed size.
In the Layer Manager
Each ArcGIS layer is a row in the Layer Manager, named with its ArcGIS title. Select the row to change Visible, Visible at zoom, Use ArcGIS symbology and Use ArcGIS labels. Open Browse ArcGIS lets you choose a different layer or a different field to join on. Colors are set in the Format pane. See Edit, reorder and remove layers.
Tips and limits
- Nothing is colored. The Feature Reference values do not match the chosen field. Compare a few values with the layer's attribute table in ArcGIS. Look for leading zeros, case and spaces.
- The layer is slow. Turn on Match a Specific Property, then use Automatically filter or a WHERE clause so that only the features you need are requested.
- Up to five ArcGIS layers.
- The ArcGIS layer is not available when the basemap is a custom image.
- ArcGIS content can also reach the other data layers: a GeoJSON link with Source is ArcGIS in Shapes from files, or a vector tile service with Source is ArcGIS in Vector tiles.
If the layer disappears when you zoom out, it has a visible range in ArcGIS and Use ArcGIS Symbology is on. See Visible zoom range above.
Clicking a feature of a data layer selects it. Pop-ups that open on click are a feature of ArcGIS reference layers.