
Check your data
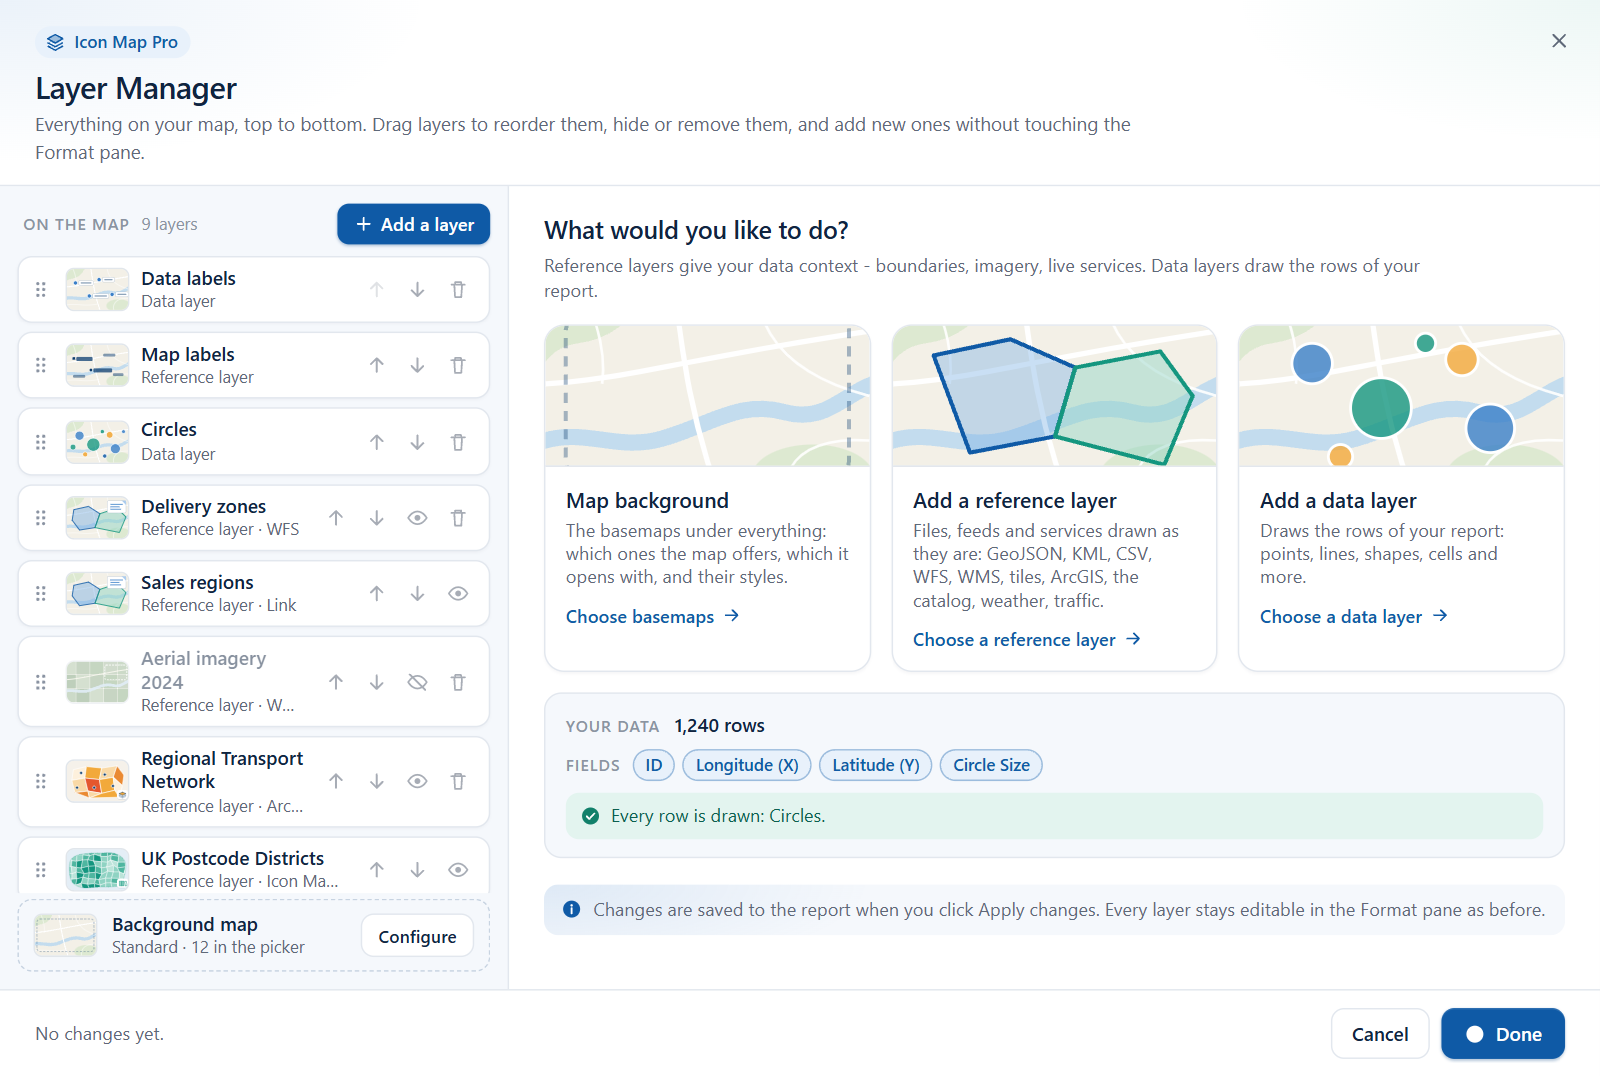
The Layer Manager tells you how many rows your visual has, which layers draw them, and which rows are left out. When a layer is on but draws nothing, it explains why using your own rows, and tells you how to fix it.
The rule behind every message
One table of data feeds every data layer on the map. Icon Map Pro decides, row by row, which layer draws each row:
A row is drawn by the layer whose fields it fills in, as long as that layer is on and the row leaves the fields of other layers empty.
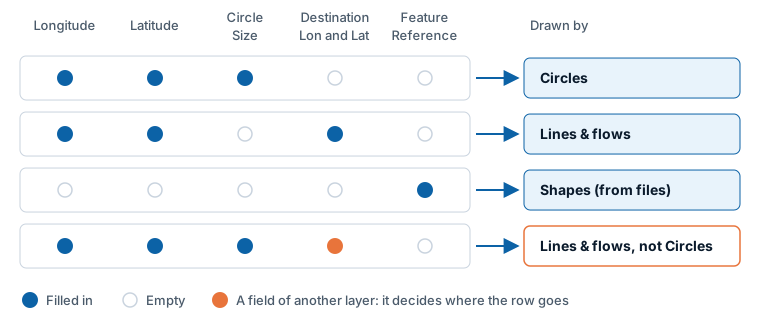
So a row with a longitude, a latitude and a circle size is a circle. Give the same row a destination and it becomes a line, and the Circles layer no longer draws it. Most "my layer is empty" problems come from a field that has a value on every row when it should only have a value on some. A blank text cell counts as empty.
For the full rules and ways to shape your data, see Combine several layers in one map.
The Your data panel
The panel is on the home view of the Layer Manager, below the three cards, and at the top of the data layer picker. It uses the counts the map made the last time it drew.
| Part | What it shows |
|---|---|
| Heading | Your data and the number of rows the visual receives. |
| Fields | A chip for ID and for each field you have added: Longitude (X), Latitude (Y), Destination Longitude, Destination Latitude, Circle Size, Heatmap Weight, Cell Weight, Column Height, Image / WKT / GeoJSON, Feature Reference. |
| Status line | One line that says whether your rows are drawn. See the table below. |
| Layer warnings | One line for each layer that is on but draws nothing, with a See why link that opens that layer. |
| Notes from the map | Home view only: up to 12 messages the map reported the last time it drew. |
The status line
| Status | Meaning | What to do |
|---|---|---|
| "No rows reach the map yet. Add an ID field (and fields for a layer) to the Fields well." | The visual has no rows. Power BI sends no rows until the ID field is filled in. | Add a field to ID, then the fields for the layer you want. |
| "No data layer is on: the 1,240 rows are not drawn." | You have rows, but no data layer is switched on. | Select Add a layer > Data layer. |
| "60 of 1,240 rows reach no layer." | Some rows do not fit any layer that is on. | Select See why. |
| "Every row is drawn: Circles." | Each row is drawn by a layer. | Nothing. |
| "Every row is drawn (Shapes (from files) and Catalog layers); 1,240 rows are drawn by more than one layer." | Each row is drawn, and some by two layers. This is expected when, for example, a catalog layer and a shapes layer both match a row. | Nothing, if that is the map you want. |
| "1,240 rows; the map has not counted them against the layers yet." | The map has the rows but has not yet counted which layers draw them. | Open the Layer Manager again after the map has drawn. |
Warnings on layers
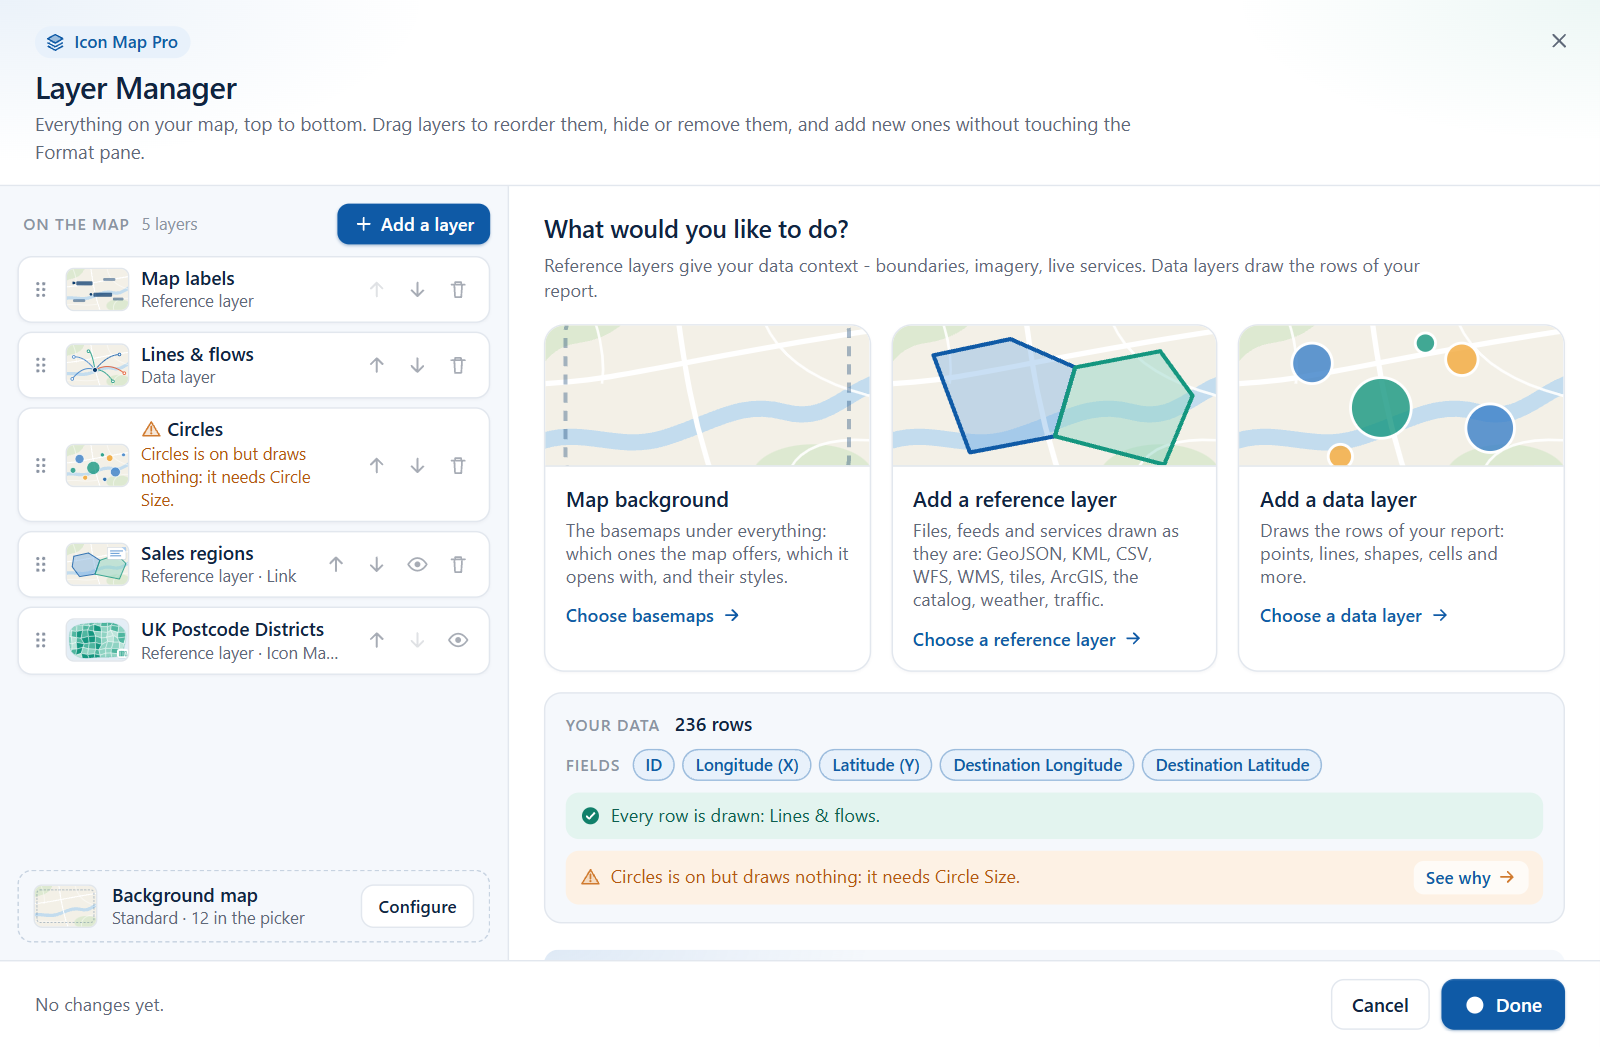
A data layer that is on but draws nothing is marked in three places: a warning icon on its row in the list, a reason in place of the row's detail line, and a line in the Your data panel. The reason is one of:
| Reason | Meaning |
|---|---|
| "Circles is on but draws nothing: it needs Circle Size." | A field the layer needs is not in the visual. |
| "Circles is on but draws nothing: the rows also fill in Destination Longitude." | The rows have a value in a field that belongs to another layer. |
| "Circles is on but draws nothing: Circle Size has no values." | The field is in the visual, but it is empty on the rows. |
| "Circles is on but no rows reach it." | No row fits the layer. |
Select the row, or See why, to open the full explanation.
Why a layer draws nothing
Open a data layer from the list. Under its heading, the editor shows one of these:
- "Drawing all 1,240 rows" - every row is drawn by this layer.
- "Drawing 1,180 of 1,240 rows" - with See the rows it skips, and why below it. Select it to open the explanation for the rows left out.
- The explanation itself, when the layer draws none of your rows.
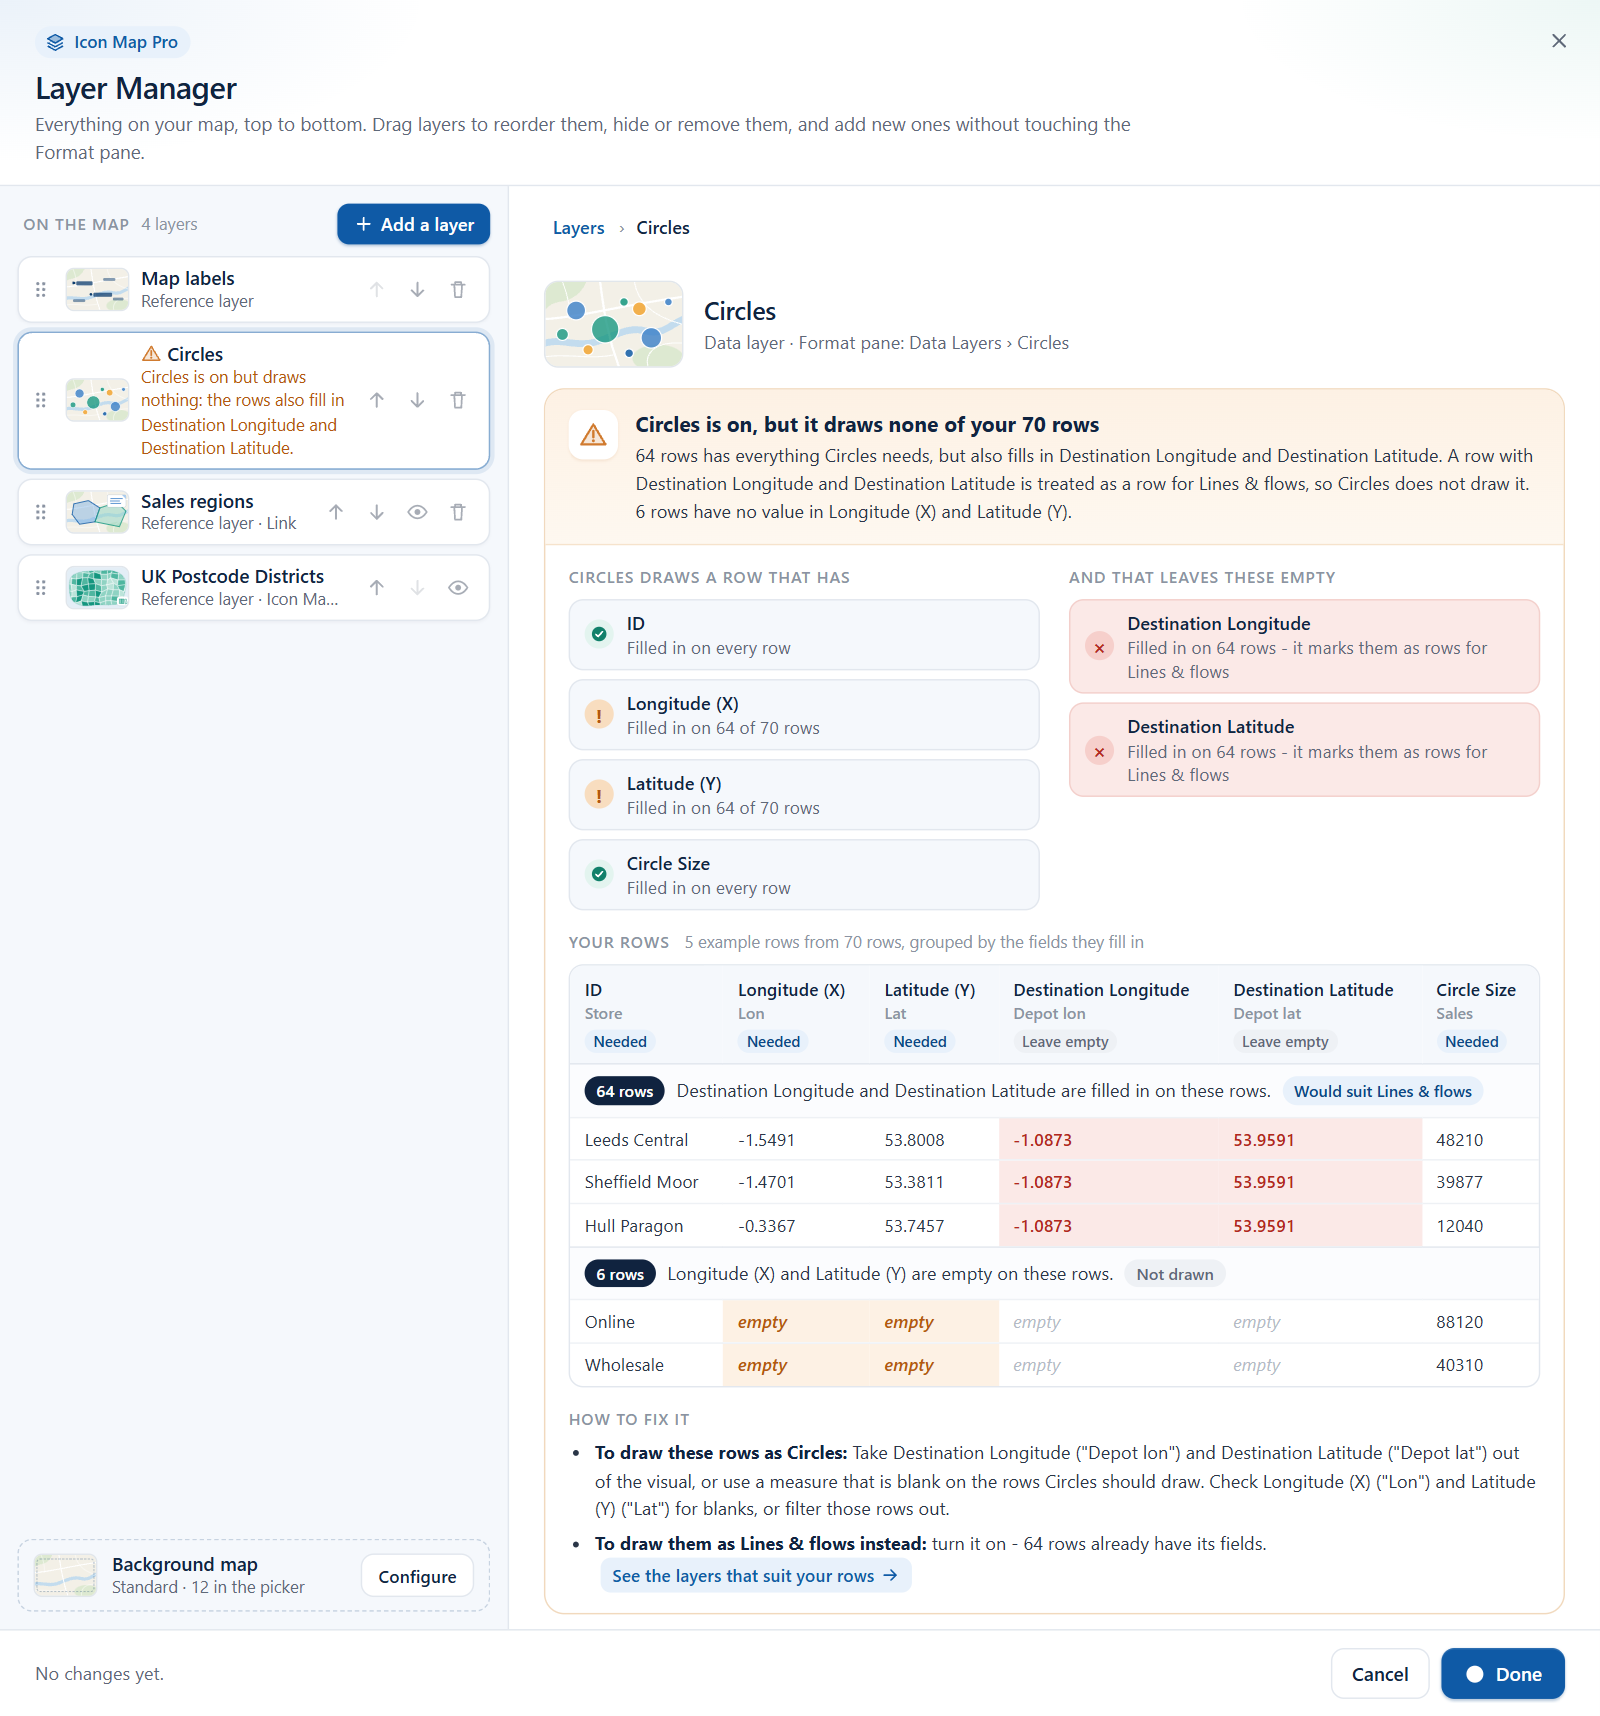
The explanation has up to five parts.
1. The headline
A sentence that says what is happening, for example "Circles is on, but it draws none of your 1,240 rows" or "Circles skips 60 rows", followed by the reason in plain words:
Every row has everything Circles needs, but also fills in Destination Longitude. A row with Destination Longitude is treated as a row for Lines & flows, so Circles does not draw it.
That is the wording when every row is affected. When only some rows are, the sentence gives the number of rows that have everything the layer needs but also fill in the other field, and a second sentence can follow for rows left out for a different reason, such as "6 rows have no value in Longitude (X) and Latitude (Y)."
Other reasons you may see:
| Reason | Meaning |
|---|---|
| "Circles also needs Circle Size, and no field is in it yet." | Add the field in the Build pane. |
| "Circles only draws rows that leave Feature Reference empty." | The rows fill in a field the layer needs to be empty. |
| "Circle Size has no value on any row." or "60 rows have no value in Circle Size." | The field is in the visual but blank on those rows. |
| "The rows fill in the right fields, but the values did not pass Circles's checks - for example a coordinate out of range, or text where a number is expected." | The fields are right but the values are not usable. |
2. The checklist
Two lists of fields, each with a mark:
| List | Marks |
|---|---|
| Circles draws a row that has - the fields the layer needs | "Filled in on every row", "Filled in on 1,180 of 1,240 rows", "Empty on every row" or "Not in the visual yet" |
| And that leaves these empty - fields of other layers that are in your visual | "Empty on every row", or "Filled in on 1,240 rows - it marks them as rows for Lines & flows" |
3. Example rows
A table of rows from your own report, under Your rows or The rows it skips. Rows are grouped by which fields they fill in, with up to eight groups and three example rows in each.
- Each column is a field, shown with its Icon Map name, the name of your own column or measure, and a tag: Needed or Leave empty.
- Each group starts with the number of rows like it, the reason ("Destination Longitude is filled in on these rows."), and what happens to them: Drawn by another layer, Would suit a layer that is off, or Not drawn.
- The cells that decide the outcome are highlighted: a value where the layer needs the field empty, or "empty" where the layer needs a value.
- Long values are shortened. Rows in other, smaller groups are counted below the table but not shown.
4. How to fix it
One suggestion for each thing you might want:
| You want | Suggestion |
|---|---|
| To draw these rows as this layer | "Take Destination Longitude out of the visual, or use a measure that is blank on the rows Circles should draw.", "Add a field to Circle Size in the Build pane.", "Check Circle Size for blanks, or filter those rows out." or "Check the values in the example rows." |
| To draw them as another layer instead | Add the fields that layer still needs in the Build pane, and turn it on. If the rows already have its fields: "turn it on - 1,240 rows already have its fields", with the link See the layers that suit your rows, which opens the data layer picker. |
| Or leave them as they are | The rows are already drawn by another layer. If that is the map you want, turn this layer off. |
5. Want both layers?
When the field that stops a layer belongs to another layer that is also on, you probably want both layers from one table: some rows as circles, others as lines. The card Want both Circles and Lines & flows? explains how.
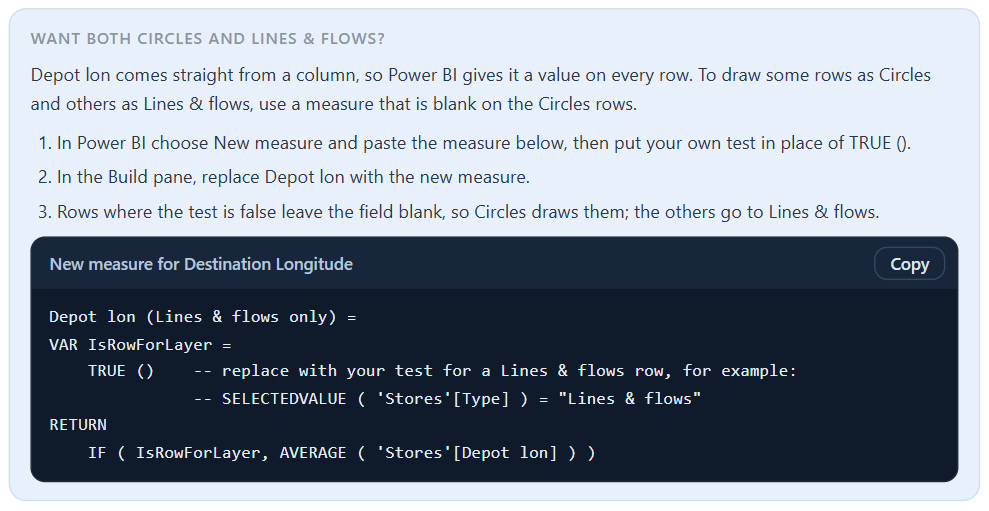
A column you drop into a field well has a value on every row, so every row looks like a line. The way out is a measure that returns a value only on the rows meant for the second layer, and blank on the others. The card writes that measure for you, using your own table name, column name and aggregation:
Depot lon (Lines & flows only) =
VAR IsRowForLayer =
    TRUE ()    -- replace with your test for a Lines & flows row, for example:
               -- SELECTEDVALUE ( 'Stores'[Type] ) = "Lines & flows"
RETURN
    IF ( IsRowForLayer, AVERAGE ( 'Stores'[Depot lon] ) )
The measure sits under a heading that names the field it is for, such as "New measure for Destination Longitude", with a Copy button. If the button changes to "Selected - press Ctrl+C", press Ctrl+C.
To use it, follow the three steps on the card:
- In Power BI choose New measure and paste the measure, then put your own test in place of
TRUE (): an expression that is true on the rows the second layer should draw. - In the Build pane, replace the column in the field well with the new measure.
- Rows where the test is false leave the field blank, so the first layer (Circles here) draws them. The others go to the second layer (Lines & flows here).
If the field is already a measure of your own, the card does not write a new one. It tells you that your measure must return BLANK() on the rows the first layer should draw.
When rows reach no layer
If the status line says that some rows reach no layer, select See why. The data layer picker opens. Whenever some rows reach no layer and the map has example rows, the picker shows the explanation for the whole map above the tiles, however you opened it: "None of your 1,240 rows are drawn" or "60 rows are not drawn". It lists each layer that is on with the reason it leaves the rows alone, shows the example rows, and suggests fixes in the same way as for a single layer.
This explanation takes the place of the short advice under What to do, which the picker gives only when the map has no example rows to show:
| Advice | Meaning |
|---|---|
| "Circles is on but needs Circle Size: add it to the Fields well." | A layer that is on is missing a field. |
| "Circles is on and draws 1,180 of 1,240 rows: the others have no value in ID, Longitude (X), Latitude (Y), Circle Size." | Some rows are blank in one of the fields the layer needs. The line lists every field the layer needs. |
| "Lines & flows would draw 60 rows - turn it on below." | A layer that is off fits the rows. Up to three are suggested. |
| "Those rows have no value in the fields a turned-on layer needs. Check the rows for blanks, or add a layer that fits them." | No layer fits the rows as they are. |
The tiles below then show, for each layer type, how many rows it draws or would draw. See Add a layer.
Fields each layer needs empty
A layer skips a row that has a value in any of the fields in the last column.
| Layer | Fields its rows fill in | Fields its rows must leave empty |
|---|---|---|
| Circles | ID, Longitude (X), Latitude (Y), Circle Size | Destination Longitude, Destination Latitude, Image / WKT / GeoJSON, Feature Reference, Heatmap Weight, Cell Weight |
| Images & icons | ID, Longitude (X), Latitude (Y), Image / WKT / GeoJSON | Destination Longitude, Destination Latitude, Feature Reference, Heatmap Weight, Cell Weight, Circle Size |
| Heatmap | ID, Longitude (X), Latitude (Y), Heatmap Weight | Destination Longitude, Destination Latitude, Circle Size, Image / WKT / GeoJSON, Feature Reference, Cell Weight |
| 3D columns | ID, Longitude (X), Latitude (Y), Column Height | Destination Longitude, Destination Latitude, Circle Size, Image / WKT / GeoJSON, Feature Reference, Cell Weight, Heatmap Weight |
| Cells from points | ID, Longitude (X), Latitude (Y), Cell Weight | Destination Longitude, Destination Latitude, Circle Size, Heatmap Weight, Image / WKT / GeoJSON, Feature Reference |
| Cells from cell IDs | ID, Cell Weight | The same, and Longitude (X) and Latitude (Y) |
| Lines & flows | ID, Longitude (X), Latitude (Y), Destination Longitude, Destination Latitude | Feature Reference, Image / WKT / GeoJSON, Heatmap Weight, Cell Weight |
| Shapes (from files) | ID, Feature Reference | Image / WKT / GeoJSON, Longitude (X), Latitude (Y), Destination Longitude, Destination Latitude, Heatmap Weight, Cell Weight, Circle Size |
| Shapes (from data) | ID, Image / WKT / GeoJSON | Longitude (X), Latitude (Y), Destination Longitude, Destination Latitude, Heatmap Weight, Cell Weight, Feature Reference, Circle Size |
| Vector tiles | ID, Feature Reference | Image / WKT / GeoJSON, Heatmap Weight, Cell Weight |
| Catalog layers | ID, Feature Reference | None |
| ArcGIS feature layer | ID, Feature Reference | None |
"Cell Weight" is the field the Build pane calls Cell (H3/S2/A5/Geohash) Weight.
Tips and limits
- The counts and example rows come from the last time the map drew while you were editing. After changing fields or filters, let the map draw before you open the Layer Manager.
- The example rows are a sample: at most eight groups of three rows. They show the pattern, not every row.
- Longitude and latitude fields should be summarized as Average, not Sum, when they come from a column.
- A field that comes straight from a column has a value on every row. To feed two layers from one table, use measures that are blank on the rows meant for the other layer, or shape the table so each row only fills in the columns for its own layer.
- The row limits of the visual apply before any of this. See Data rows and limits.