
Combine several layers in one map
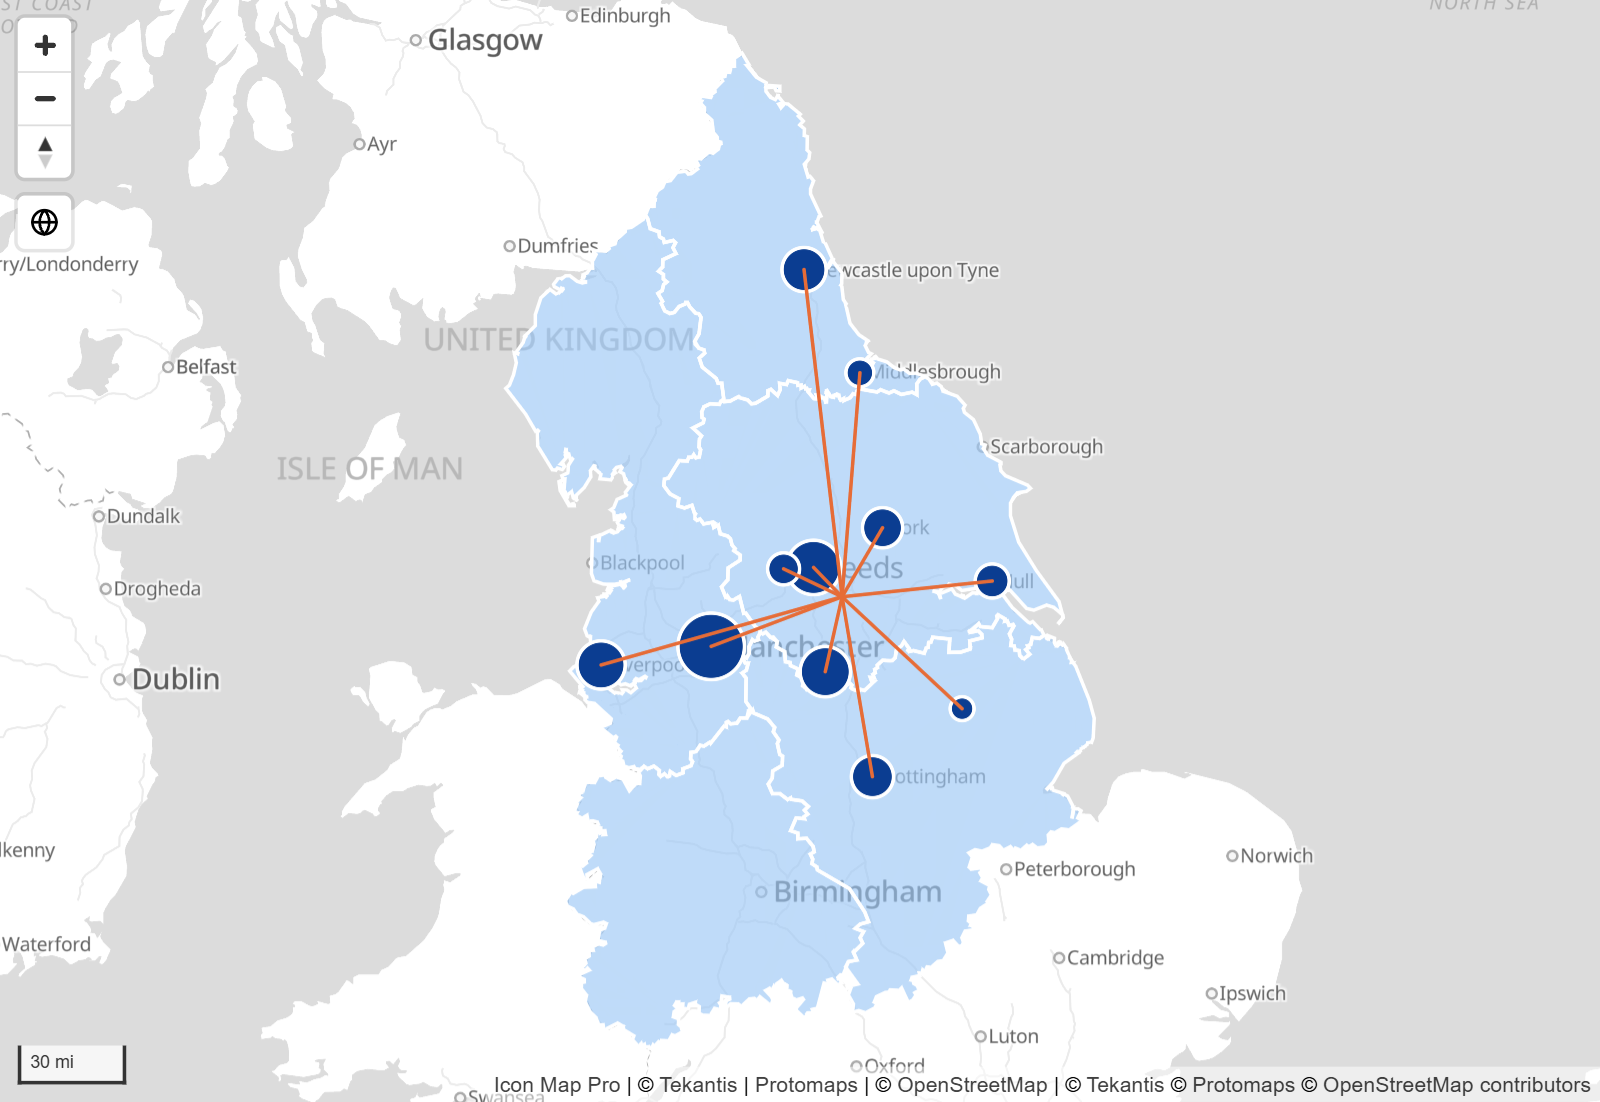
One Icon Map Pro visual can draw several data layers at once, for example stores as circles, deliveries as lines and sales regions as shapes. All of them come from one table. This page explains how each row finds its layer, how to build that table, and what to check when a layer draws nothing.
The rule
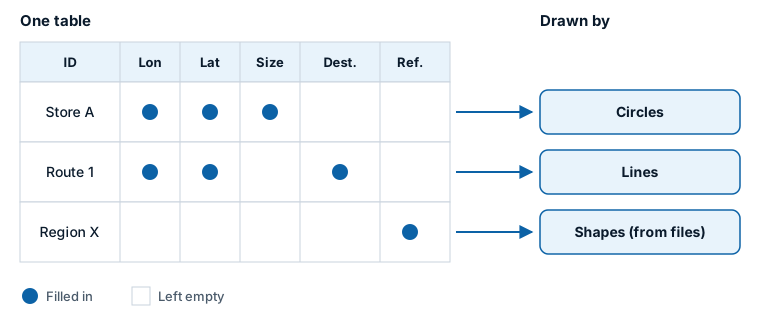
A row is drawn by the layer whose fields it fills in.
There is one set of field wells, and every data layer reads it. The visual looks at each row and asks which fields have a value:
- A row with a longitude, a latitude and a circle size is a circle.
- A row with a longitude, a latitude and a destination is a line.
- A row with only a feature reference is a shape from a file.
Two more things must be true for a row to be drawn:
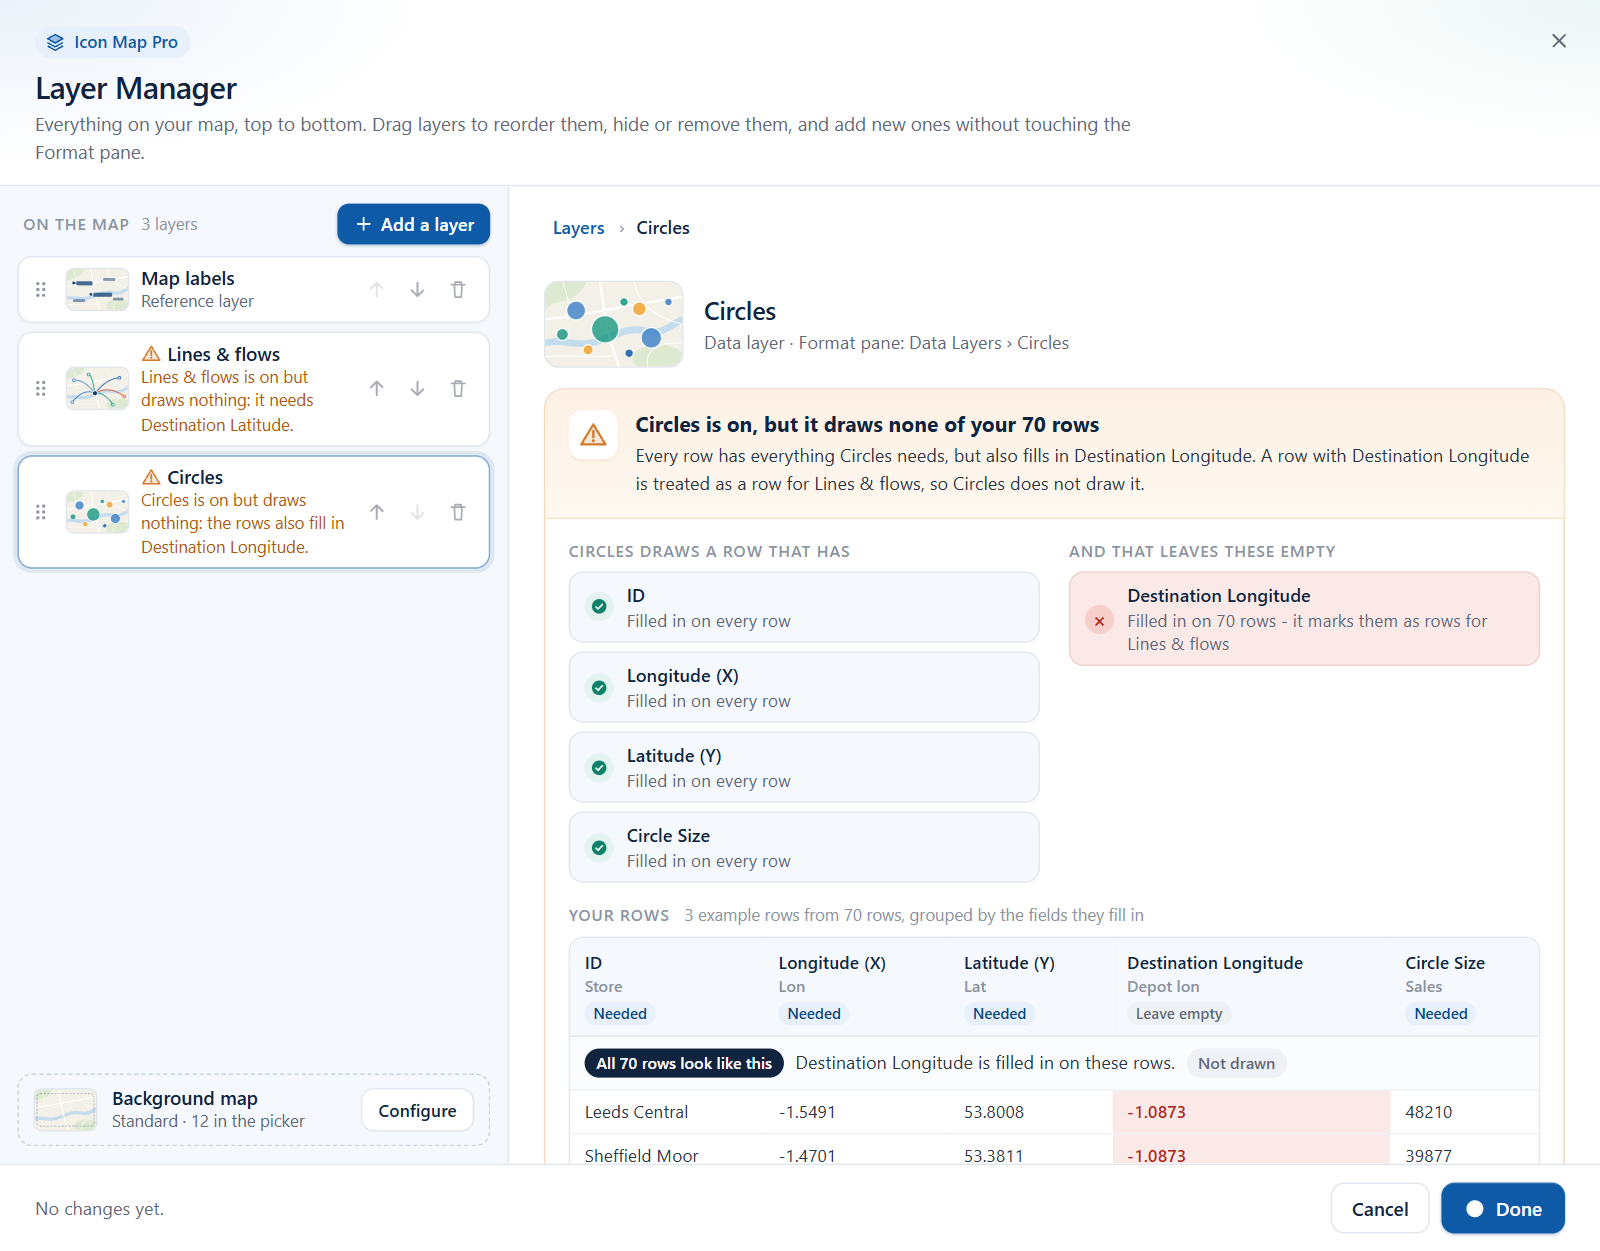
- The fields of other layers are empty on that row. A store row that also has a destination is no longer a circle. It is treated as a line.
- The layer is turned on. A row that fits a layer which is turned off is not drawn.
So to show several layer types on one map, keep them in one table, give each row only the fields for its own layer, and leave the others empty.
Empty and blank
A field is empty on a row when:
- It is null in the data, or a measure returns
BLANK(). - It is a text value with nothing in it, or only spaces. Tables that come from CSV files, Excel or Power Query often hold empty text instead of null. Icon Map Pro treats both the same way.
- No field has been added to that field well at all.
Zero is a value, not blank. A row with a Circle Size of 0 still has a circle size.
If you add a column such as Sales to Circle Size, every row that has a Sales value gets a circle size, including the rows you meant as lines or shapes. Use a column that is blank on those rows, or a measure that returns blank for them. See Measures that are blank for other rows.
What each layer needs
Every layer needs ID. "Cell Weight" in this table is the Cell (H3/S2/A5/Geohash) Weight field well, and "Destination" means both Destination Longitude and Destination Latitude.
| Layer | Fill in | Leave empty |
|---|---|---|
| Circles | Longitude (X), Latitude (Y), Circle Size | Destination, Image / WKT / GeoJSON, Feature Reference, Heatmap Weight, Cell Weight, Column Height |
| Images and icons | Longitude (X), Latitude (Y), Image / WKT / GeoJSON | Destination, Feature Reference, Heatmap Weight, Cell Weight, Circle Size |
| Heatmap | Longitude (X), Latitude (Y), Heatmap Weight | Destination, Circle Size, Image / WKT / GeoJSON, Feature Reference, Cell Weight |
| 3D columns | Longitude (X), Latitude (Y), Column Height | Destination, Circle Size, Image / WKT / GeoJSON, Feature Reference, Cell Weight, Heatmap Weight |
| Cells from coordinates | Longitude (X), Latitude (Y), Cell Weight | Destination, Circle Size, Heatmap Weight, Image / WKT / GeoJSON, Feature Reference |
| Cells from cell IDs | Cell Weight (the ID is the cell ID) | Longitude (X), Latitude (Y), and the fields in the row above |
| Lines | Longitude (X), Latitude (Y), Destination | Feature Reference, Image / WKT / GeoJSON, Heatmap Weight, Cell Weight |
| Shapes from data | Image / WKT / GeoJSON | Longitude (X), Latitude (Y), Destination, Heatmap Weight, Cell Weight, Feature Reference, Circle Size |
| Shapes from files | Feature Reference | Image / WKT / GeoJSON, Longitude (X), Latitude (Y), Destination, Heatmap Weight, Cell Weight, Circle Size |
| Vector tiles | Feature Reference | Image / WKT / GeoJSON, Heatmap Weight, Cell Weight, Circle Size |
| Catalog layers | Feature Reference | Nothing |
| ArcGIS layers | Feature Reference | Nothing |
Points worth knowing:
- Tooltips, Cluster Group, Feature Weight and Daylight Date & Time never decide which layer a row goes to. Fill them in on any row.
- Lines with circles. A line row may have a Circle Size. With Include circle(s) at: set in the Lines settings, circles are drawn at the ends of the line.
- Circle or column. A row with both a Circle Size and a Column Height is neither. Fill in one of them.
- Images and shapes share a field well. A row with an image and coordinates is an image. A row with WKT or GeoJSON text and no coordinates is a shape.
- Feature Reference is shared. Shapes from files, vector tiles, catalog layers and ArcGIS layers all join on Feature Reference. A row with a feature reference is offered to each of these layers that is turned on, so the same row can color a boundary in more than one of them.
A worked example: stores and deliveries
You want stores as circles sized by sales, and deliveries as lines from a depot to each store. The table needs one row for each store and one row for each delivery:
| ID | Type | Longitude | Latitude | Destination Longitude | Destination Latitude | Size |
|---|---|---|---|---|---|---|
| Store Leeds | Store | -1.549 | 53.801 | 120 | ||
| Store York | Store | -1.081 | 53.959 | 85 | ||
| Delivery 1001 | Delivery | -1.356 | 53.683 | -1.549 | 53.801 | |
| Delivery 1002 | Delivery | -1.356 | 53.683 | -1.081 | 53.959 |
- The store rows fill in the coordinates and Size, and leave the destination empty. Circles draws them.
- The delivery rows fill in the coordinates and the destination, and leave Size empty. Lines draws them.
Add the fields to the visual, each column to the field well of the same name, with Size in Circle Size. Then turn on both layers.
In the Layer Manager, select Add a layer, then Data layer. The tiles for Circles and Lines & flows show Fields ready, with the number of rows each would draw. Add them both, then select Apply changes.
To add sales regions as a third layer, add a row for each region that fills in only the feature reference, and add that column to Feature Reference:
| ID | Type | Longitude | Latitude | Destination Longitude | Destination Latitude | Size | Region code |
|---|---|---|---|---|---|---|---|
| Region North | Region | E12000001 |
Then turn on Shapes from files and add the file of regions.
Build the table
In most models the stores, deliveries and regions are separate tables. Power BI needs them as one table for the visual, so combine them. Give every row a unique ID: if a store and a delivery could share an ID, add a prefix.
Power Query: append the tables
Give the columns the same names in each query, then use Append Queries as New. Columns that a query does not have are filled with null, which is what the map needs.
let
    StoreRows = Table.SelectColumns(Stores, {"ID", "Type", "Longitude", "Latitude", "Size"}),
    DeliveryRows = Table.SelectColumns(
        Deliveries,
        {"ID", "Type", "Longitude", "Latitude", "Destination Longitude", "Destination Latitude"}
    ),
    MapItems = Table.Combine({StoreRows, DeliveryRows})
in
    MapItems
DAX: a calculated table with UNION
UNION stacks tables whose columns are in the same order. Use BLANK() for the columns a row type does not use.
Map Items =
UNION (
    SELECTCOLUMNS (
        Stores,
        "ID", "Store " & Stores[Name],
        "Type", "Store",
        "Longitude", Stores[Longitude],
        "Latitude", Stores[Latitude],
        "Destination Longitude", BLANK (),
        "Destination Latitude", BLANK (),
        "Size", Stores[Sales]
    ),
    SELECTCOLUMNS (
        Deliveries,
        "ID", "Delivery " & Deliveries[Delivery No],
        "Type", "Delivery",
        "Longitude", Deliveries[Depot Longitude],
        "Latitude", Deliveries[Depot Latitude],
        "Destination Longitude", Deliveries[Store Longitude],
        "Destination Latitude", Deliveries[Store Latitude],
        "Size", BLANK ()
    )
)
Measures that are blank for other rows
When the value for a field well comes from a column that has a value on every row, wrap it in a measure that returns blank for the rows of other layers. IF with no third argument returns BLANK():
Store Size =
IF (
    SELECTEDVALUE ( 'Map Items'[Type] ) = "Store",
    SUM ( 'Map Items'[Sales] )
)
Put the measure in Circle Size in place of the column. Store rows get a size and are drawn as circles. Delivery rows get a blank and are drawn as lines. The same pattern works for any field well, for example a destination that is blank unless the row is a delivery:
Delivery Destination Longitude =
IF (
    SELECTEDVALUE ( 'Map Items'[Type] ) = "Delivery",
    AVERAGE ( 'Map Items'[Destination Longitude] )
)
Choose layers with a slicer
Because the layer follows the data, a slicer can turn layers on and off for report users. Add a slicer on the Type column of the example table. Selecting Store shows only the circles, and selecting Delivery shows only the lines, because the other rows are filtered out before they reach the map.
Check what each layer draws
The Layer Manager shows how your rows were shared out. Open it from Format pane > Layer Manager > Open Layer Manager.
- The Your data panel lists the fields you have added and says whether every row is drawn, for example "Every row is drawn: Circles, Lines & flows." or "12 of 240 rows reach no layer."
- A layer that is turned on but draws nothing has a warning on its row. Select See why to see example rows, the field that sends them elsewhere, and how to fix it.
- When two layers compete for the same rows, the explanation includes a ready-made DAX measure, written with your own table and column names, that is blank on the rows of one layer. Select Copy, create a new measure from it, and use it in place of the field.
See Check your data.
When no row reaches any turned-on layer while you are editing, the map shows the "What kind of map are you making?" guide. It lists each layer type with the fields it needs and marks the ones your fields already fit. See Choose a layer type.
Common mistakes
| What you see | Likely cause | Fix |
|---|---|---|
| Circles is on but nothing is drawn | Every row also has a destination, so the rows are lines. | Leave the destination blank on circle rows, or turn on Lines if lines are what you want. |
| Lines is on but nothing is drawn | The rows have a Feature Reference, an image or WKT value, a Heatmap Weight or a cell weight. | Make those fields blank on line rows. |
| Shapes are drawn but the circles have gone | A column in Feature Reference has a value on the circle rows too. | Use a column or measure that is blank on circle rows. |
| Shapes from files draws nothing | The shape rows also have coordinates or a Circle Size. | Leave them blank on shape rows. |
| One layer type is missing | The layer is not turned on. | Turn it on under Data Layers in the Format pane. |
| A row is neither a circle nor a column | It has both a Circle Size and a Column Height. | Fill in only one. |
| Rows of two types merge into one | Two rows share an ID, so Power BI groups them into one row with the fields of both. | Make the IDs unique, for example with a prefix for each type. |
| A blank was expected but the row has a value | The field holds 0, or a column with a value on every row. | Return BLANK() from a measure for those rows. |
Tips and limits
- The drawing order of the layers is set by each layer's Z Index. See Data layers overview.
- All layers share the visual's row limit. See Data rows and limits.
- A map that needs context rather than data, such as a boundary outline or a weather layer, does not need rows at all. Use a reference layer.