
View, zoom and projection
These settings decide what part of the world the map shows and how readers can move around it: whether the map zooms to your data, how far readers can zoom and tilt, and whether the map is flat or a globe.
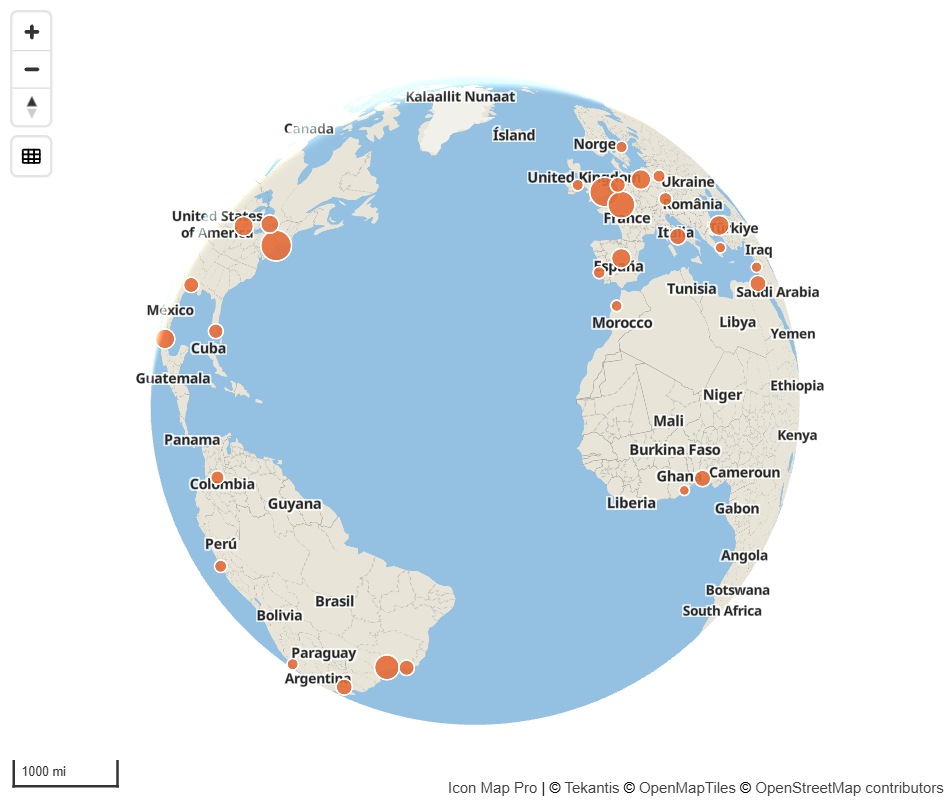
The two ways a map chooses its view
A map is in one of two modes.
- Fit to data. With Auto Zoom on (the default), the map moves to frame the data it is showing. When a slicer or filter changes the data, the map frames it again.
- A fixed view. With Auto Zoom off, the map opens at the view you set: a center, a zoom level, a tilt and a rotation.
Both are set in Format pane > Map > Zoom.
Set a fixed view
- In Format pane > Map > Zoom, switch Auto Zoom off.
- While editing the report, pan, zoom, tilt and rotate the map to the view you want.
The map writes the view to Default Latitude, Default Longitude, Default Zoom Level, Default Pitch and Default Bearing as you move it. You can also type the values. This happens only while you are editing the report. A reader moving the map changes nothing.
Fit to data, once
To frame the data when the report opens and then leave the view alone, keep Auto Zoom on and switch on Only Zoom on Initial Load.
Where the settings are
Every setting on this page is in the Format pane, on the Map and Controls cards.
On maps that use the Basemaps dialog, most of them are also on the dialog's View and zoom tab, with plainer names. Both places change the same settings, so they always agree. See The Basemaps dialog for how to open it.
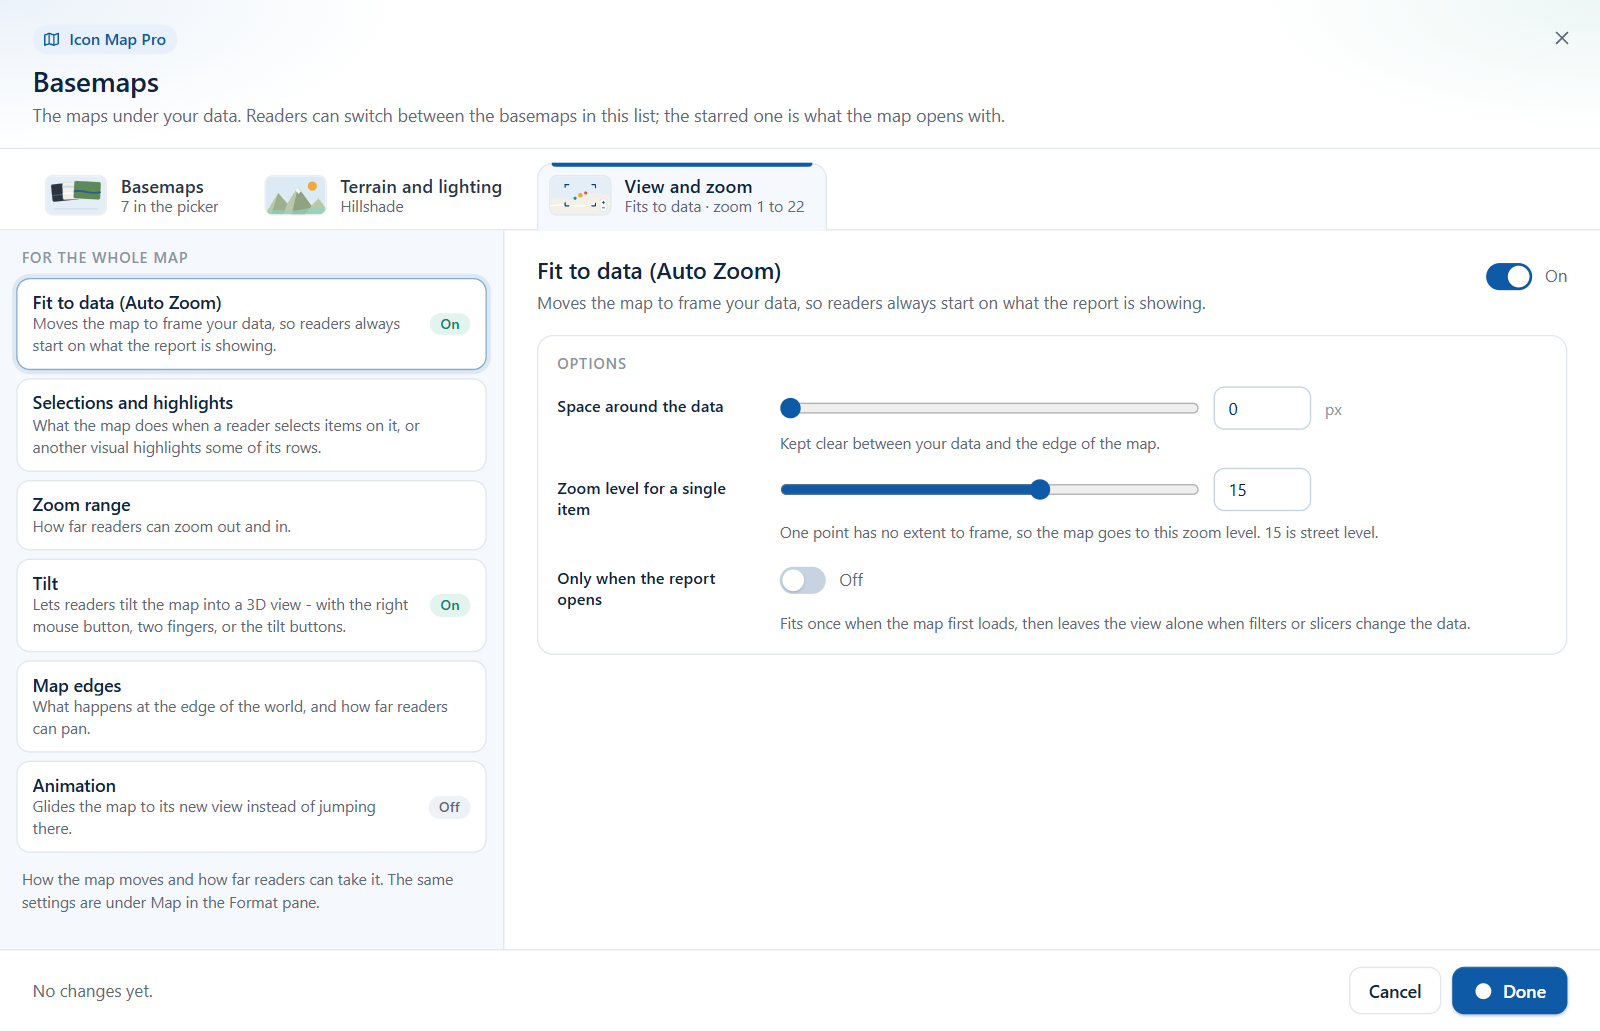
| Section in the dialog | Setting in the dialog | Setting in the Format pane |
|---|---|---|
| Fit to data (Auto Zoom) | The section's switch | Auto Zoom |
| Space around the data | Zoom Padding (px) | |
| Zoom level for a single item | Zoom Level When Single Item | |
| Only when the report opens | Only Zoom on Initial Load | |
| Selections and highlights | Zoom to selected items | Zoom to Selected Items |
| Zoom back out afterwards | Reset zoom after unselect | |
| Zoom to cross-highlighted items | Zoom to Cross-Highlighted Items | |
| Zoom range | Farthest out | Min Zoom Level |
| Closest in | Max Zoom Level | |
| Tilt | The section's switch | Allow Tilt |
| Steepest tilt | Max Pitch | |
| Map edges | Wrap the world | World Copies |
| Keep readers inside an area | Limit Map to Bounding Box | |
| West edge, East edge, North edge, South edge | The four bound settings | |
| Animation | The section's switch | Enable Animation |
| Duration | Duration (seconds) |
Lock Zoom and the default view settings (Default Latitude, Default Longitude, Default Zoom Level, Default Pitch, Default Bearing) are only in the Format pane.
Zoom
Format pane > Map > Zoom
| Setting | What it does | Default |
|---|---|---|
| Min Zoom Level | How far out readers can zoom. 0 shows the whole world, 5 is about a country | 1 |
| Max Zoom Level | How far in readers can zoom. 15 is street level. Up to 24 | 22 |
| Zoom Level When Single Item | When the data is a single point there is nothing to frame, so auto zoom goes to this level. Supports conditional formatting (fx) | 15 |
| Auto Zoom | Moves the map to frame your data | On |
| Zoom Padding (px) | Space kept between the auto-zoomed data and the edge of the map, 0 to 300 pixels | 50 on maps added as a new visual in 1.1.0.10 or later, 0 on earlier maps |
| Only Zoom on Initial Load | Auto zooms once when the map first loads and leaves the view alone on later data updates | Off |
| Lock Zoom | Stops every automatic move of the map: auto zoom, zoom to selection and zoom to highlight | Off |
| Zoom to Selected Items | Selecting items on the map zooms in to frame them | Off |
| Reset zoom after unselect | When the selection is cleared, the map returns to the view of all the data | Off |
| Zoom to Cross-Highlighted Items | When a reader selects something in another visual, the map zooms to the rows it highlights | On |
| Default Latitude | The center of the fixed view | 51.5072 |
| Default Longitude | The center of the fixed view | -0.1276 |
| Default Zoom Level | The zoom level of the fixed view | 10 |
| Default Pitch | The tilt of the camera in degrees. Tilting the map while editing updates it | 0 |
| Default Bearing | The rotation of the camera in degrees, -180 to 180. Rotating the map while editing updates it | 0 |
New in 1.1.0.11 Two more settings control tilt:
| Setting | What it does | Default |
|---|---|---|
| Allow Tilt | Lets readers tilt the map. Off keeps the camera at the Default Pitch | On |
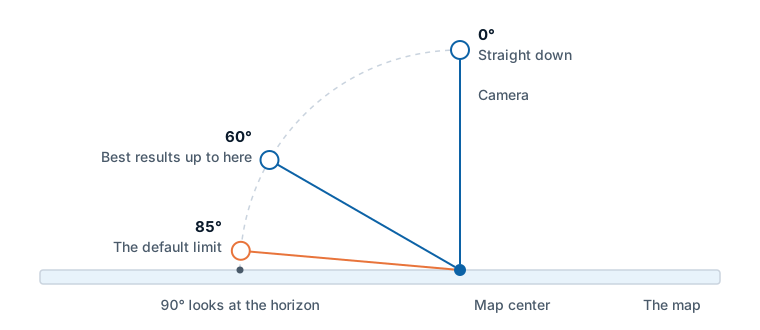
| Max Pitch | The steepest tilt in degrees, 0 to 180. Shown when Allow Tilt is on. Default Pitch cannot exceed it | 85 |
A few things to know:
- The first zoom after the map loads is never animated.
- If the map's last move was an auto zoom and the reader has not moved it since, resizing the visual or switching between flat and globe fits the data again.
- Readers can lock the view for their session with the Zoom Lock control. See Map controls.
How selection and highlighting work is described in Selection, cross-filtering and highlighting.
Tilt and rotation
Readers tilt and rotate the map by dragging with the right mouse button, or with two fingers on a touch screen. Tilt is measured in degrees of pitch: 0 looks straight down, 90 looks at the horizon.
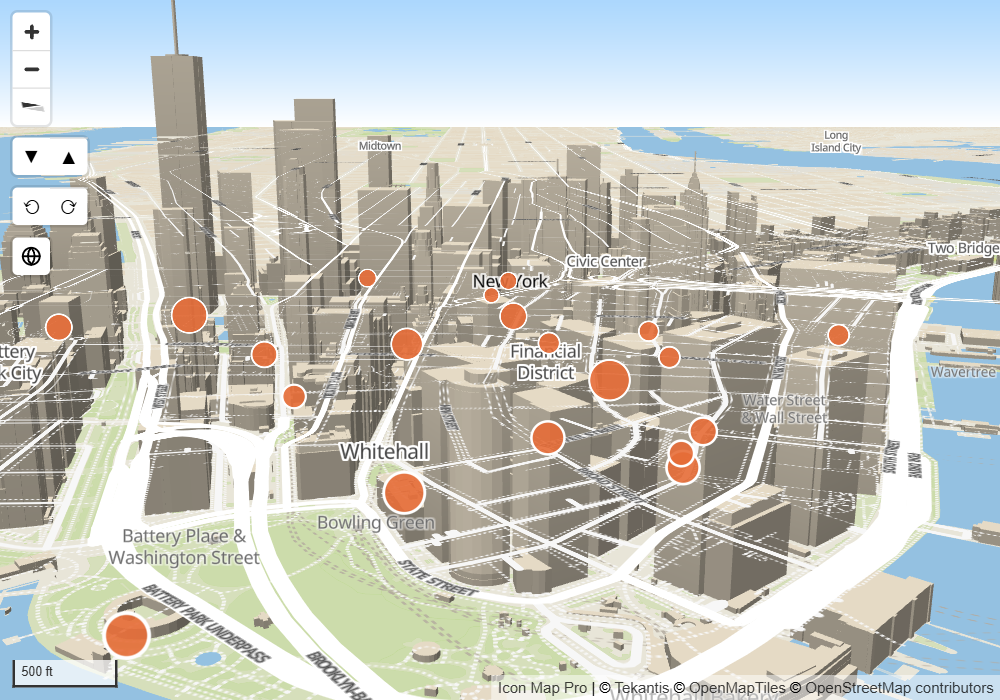
To open the map tilted, set a fixed view while tilted, or type a Default Pitch. With Auto Zoom on, the map still frames your data and keeps the pitch.
For buttons that tilt and rotate the map, switch on Pitch and Bearing in Format pane > Controls. Each click moves 10 degrees.
Allow Tilt and Max Pitch limit how far readers can tilt:
- With Allow Tilt off, the map stays at the Default Pitch. No gesture, key or button can tilt it, and the Pitch buttons are hidden. Set Default Pitch to 0 for a map that always looks straight down.
- Max Pitch can go up to 180, but above 60 some basemaps and layers may not draw cleanly.
In 1.1.0.10, tilt could not be switched off and the limit was fixed at 85 degrees.
A tilted map is where 3D buildings, 3D columns, 3D terrain and the sky become visible. See Terrain, hillshade, sky and lighting.
Flat map or globe
The map can be drawn flat (Mercator) or as a globe.
Format pane > Controls > Controls
| Setting | What it does | Default |
|---|---|---|
| Globe Toggle | Shows a button on the map that switches between the flat view and the globe | On |
| Projection | Mercator or Globe: the projection the map opens with | Mercator |
| Pitch | Shows a pair of buttons that tilt the map up and down | Off |
| Bearing | Shows a pair of buttons that rotate the map left and right | Off |
- While you are editing the report, selecting the globe button on the map also saves the Projection. A reader's click lasts for their session.
- When you zoom in close, the globe changes to the flat view by itself.
- The projection stays the same when the basemap changes.
- The glow around the globe is set by Atmosphere Blend in the Sky settings. See Terrain, hillshade, sky and lighting.
The other controls on the card, including zoom buttons, the zoom level display and the scale bars, are described in Map controls.
Map edges
Format pane > Map > Map Bounds
| Setting | What it does | Default |
|---|---|---|
| World Copies | Carries the map on past its east and west edges, so readers can pan all the way around and your data repeats on each copy. Off shows the world once | See below |
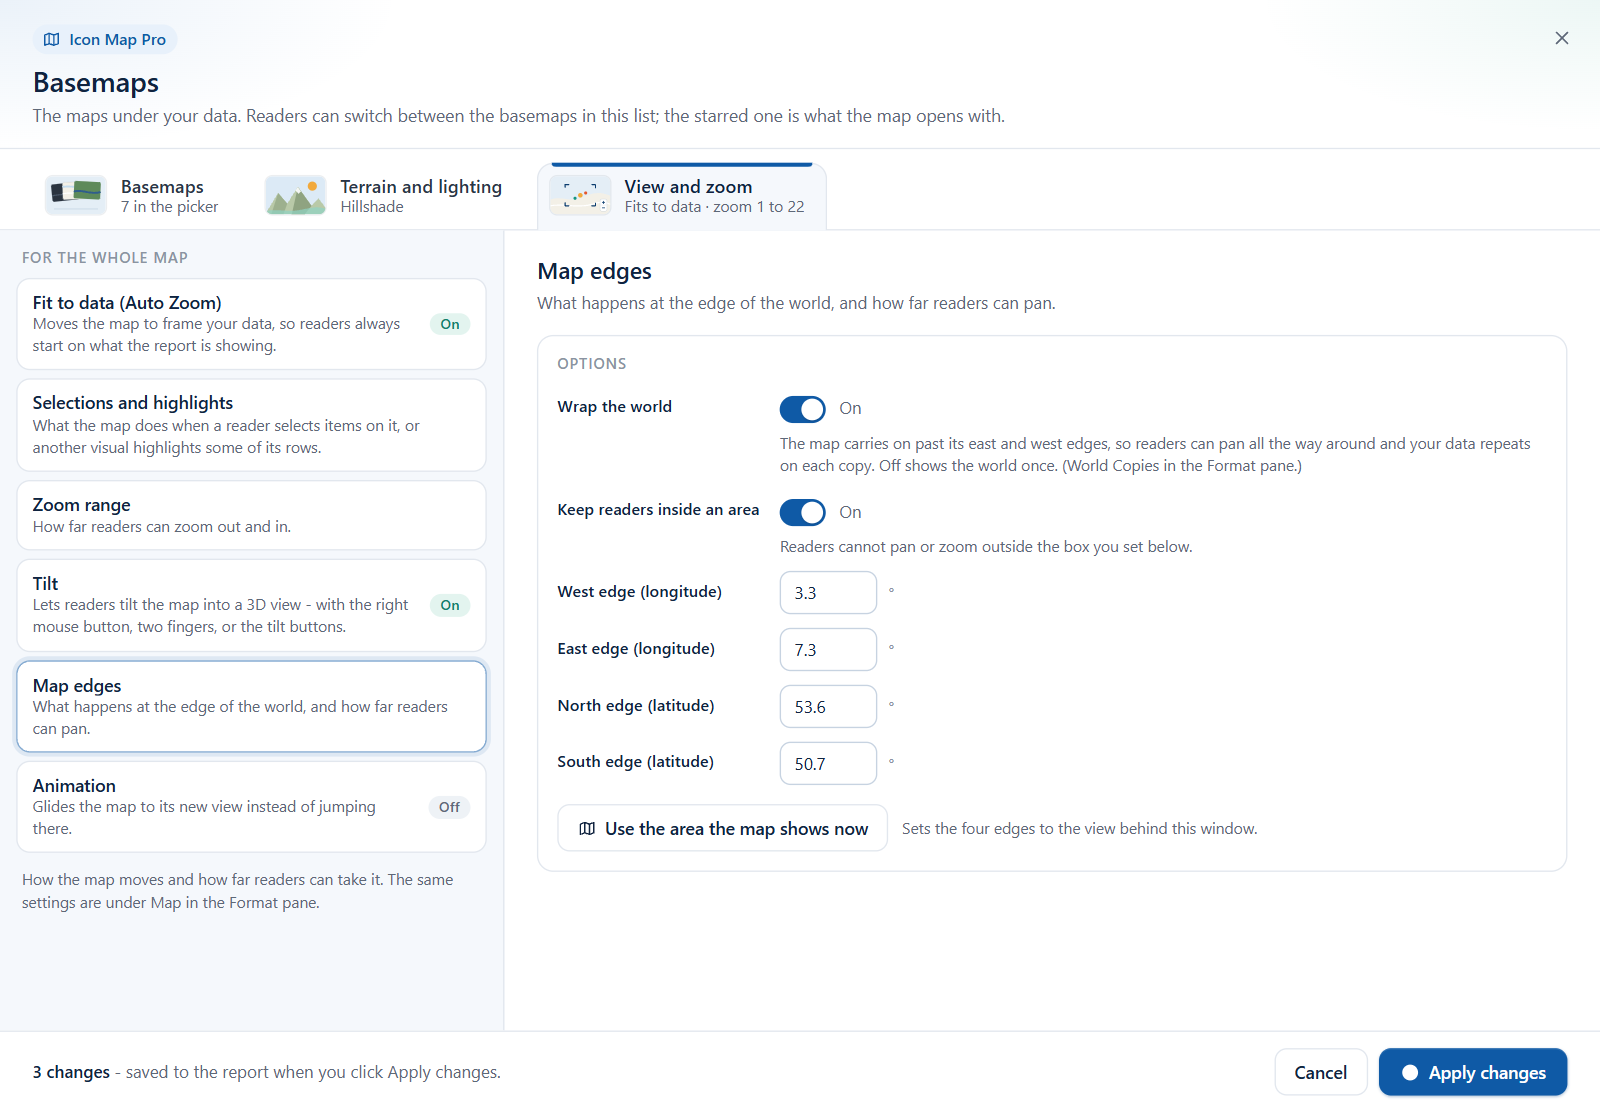
| Limit Map to Bounding Box | Readers cannot pan or zoom outside the box set by the four bounds | Off |
| West Bound Longitude | Shown when Limit Map to Bounding Box is on | -180 |
| East Bound Longitude | Shown when Limit Map to Bounding Box is on | 180 |
| North Bound Latitude | Shown when Limit Map to Bounding Box is on | 90 |
| South Bound Latitude | Shown when Limit Map to Bounding Box is on | -90 |
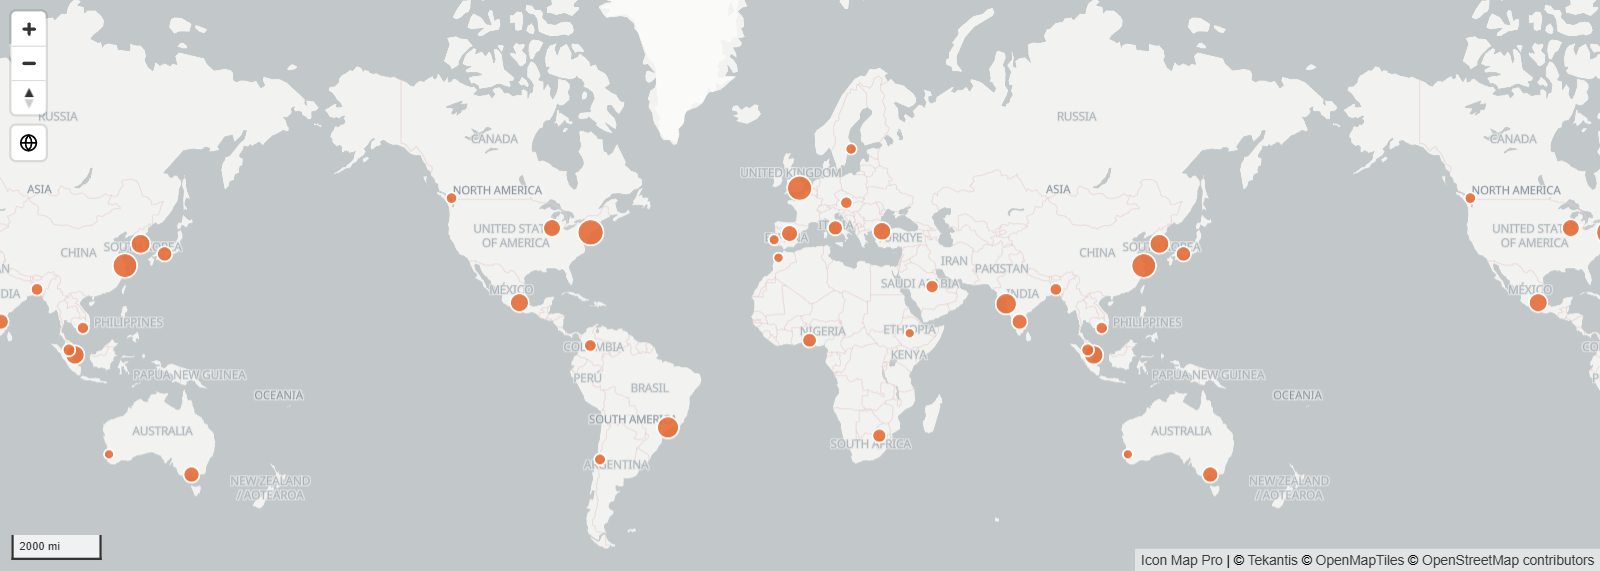
World Copies is on by default for maps added as a new visual in 1.1.0.10 or later, unless the report already saved a value for it. On earlier maps it is off by default. In 1.1.0.10 it was off by default for every map.
On the View and zoom tab of the Basemaps dialog, Map edges has a button, Use the area the map shows now, which sets the four edges to the view behind the dialog. The button appears once Keep readers inside an area is switched on.
World Copies has no effect on the globe, which is one world.
Animation
Format pane > Map > Animation
| Setting | What it does | Default |
|---|---|---|
| Enable Animation | Glides the map to its new view instead of jumping there. Applies to the moves the map makes itself: auto zoom, zoom to selection and zoom to highlight | Off |
| Duration (seconds) | How long each move takes, 0 to 10 seconds | 2 |
Tips and limits
- If the map keeps moving away from the view you set, Auto Zoom is on. Switch it off, or use Only Zoom on Initial Load.
- If the map does not follow your slicers, check Lock Zoom and Only Zoom on Initial Load.
- To keep readers on your area of interest, combine Limit Map to Bounding Box with a Min Zoom Level that fits the area.
- The Modern engine zooms smoothly, so there is no zoom increment setting.