
Cells: H3 hexagons and grids
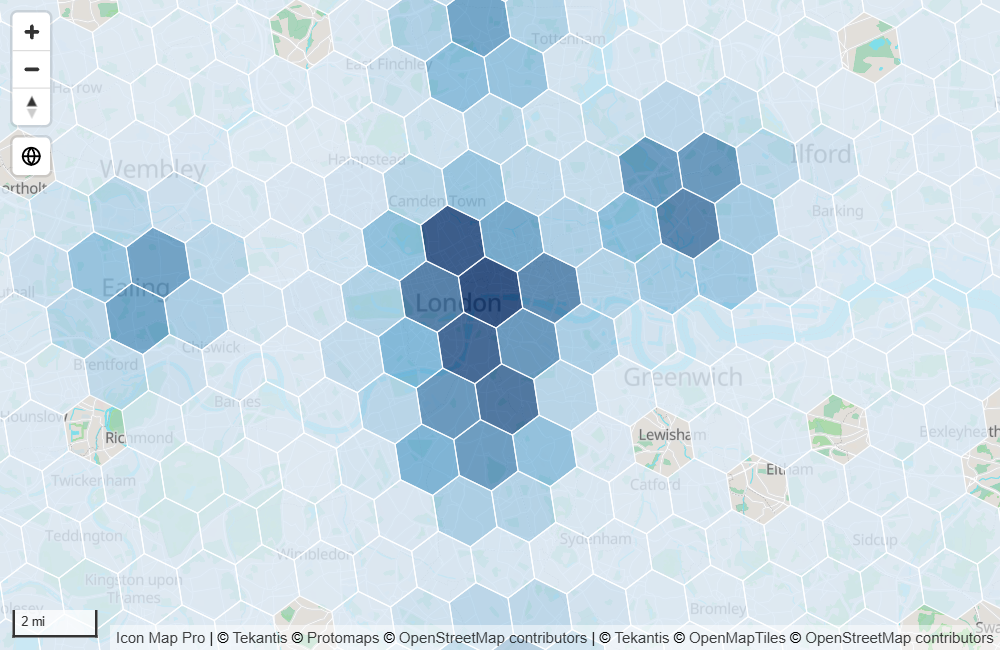
The Cells layer divides the map into a grid of cells and colors each cell by your data. It can add up the points that fall in each cell for you, or draw cells whose IDs are already in your data. Use it to turn thousands of points into a clear pattern that readers can still select.
What you need
The layer works in one of two ways, set by Source.
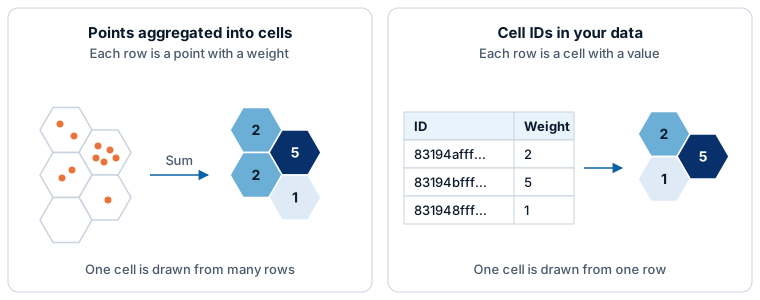
Points aggregated into cells (the default). Each row is a point. The visual finds the cell each point falls in and combines the weights.
| Field well | What to put in it |
|---|---|
| * ID (required) | A unique value for each row |
| Longitude (X) | Longitude in decimal degrees, summarized as Average |
| Latitude (Y) | Latitude in decimal degrees, summarized as Average |
| Cell (H3/S2/A5/Geohash) Weight | The number to aggregate into each cell |
Cell IDs in your data. Each row is one cell.
| Field well | What to put in it |
|---|---|
| * ID (required) | The cell ID, for example an H3 index |
| Cell (H3/S2/A5/Geohash) Weight | The number for each cell |
| Longitude (X), Latitude (Y) | Leave empty |
In both cases the weight is required, and these fields must be empty on the layer's rows: Circle Size, Heatmap Weight, Destination Longitude, Destination Latitude, Image / WKT / GeoJSON and Feature Reference. The visual's own messages shorten the weight field's name to "Cell Weight".
A row with a value in Circle Size is a circle, not a cell point. If you started with circles, take the field out of Circle Size.
Add cells to the map
- Add fields to * ID (required), Longitude (X) and Latitude (Y). Set the coordinates to Average.
- Add a number to Cell (H3/S2/A5/Geohash) Weight.
- If the panel What kind of map are you making? is showing, select the Cells tile. It turns the layer on and opens the Layer Manager on it. Otherwise, in the Format pane expand Layer Manager, switch on Open Layer Manager, and select Add a layer, Data layer, Cells.
- Under Cells come from, keep H3 - points aggregated into cells. Choose how to Aggregate values by and set the Resolution. Higher is finer.
- If you are adding the layer, select Add to map. Then select Apply changes.
If the cells are too small to see or too large to be useful, change the Resolution. The Layer Manager offers these settings:
| Layer Manager setting | Same as, in the Format pane |
|---|---|
| Cells come from | Source (the most used options) |
| Aggregate values by | Aggregation Type |
| Cell size | Resolution Method |
| Resolution | Resolution |
| Low color, Mid color, High color | Start Color, Mid Color, End Color |
| Fill transparency | Fill Transparency |
| Outline | Outline Color and Outline Transparency |
| Outline width | Outline Width |
The other sources, zoom-based resolution, tooltips, labels, fixed color ranges, 3D extrusion and custom shapes are in Format pane > Data Layers.
Choose a grid and a source
Source sets both the grid system and where cells come from.
| Source | Grid | Each row is |
|---|---|---|
| H3 from Longitude and latitude coordinates | H3 hexagons | A point |
| H3 Indexes as ID (hex) | H3 | A cell, ID as hexadecimal text |
| H3 Indexes as ID (64bit integers) | H3 | A cell, ID as a 64-bit integer |
| S2 from Longitude and latitude coordinates | S2 cells | A point |
| S2 Cell IDs (64bit integers) | S2 | A cell, ID as a 64-bit integer |
| S2 Cell tokens (hex) | S2 | A cell, ID as a token |
| A5 from Longitude and latitude coordinates | A5 pentagons | A point |
| A5 Cell IDs (64bit integers) | A5 | A cell, ID as a 64-bit integer |
| Geohash from Longitude and latitude coordinates | Geohash rectangles | A point |
| Geohashes as ID | Geohash | A cell, ID as a geohash |
| Custom shapes from Longitude and latitude coordinates | Polygons from a file you upload | A point. See Custom shapes. |
A 64-bit cell ID is too large for Power BI to hold exactly as a number. Set the column's data type to Text so the IDs are not rounded.
Resolution
For the grid sources that aggregate points, the resolution sets the cell size. A higher resolution means smaller cells. The range depends on the grid: H3 0 to 15, S2 and A5 0 to 30, Geohash 1 to 12.
Resolution Method has two options:
- Fixed uses one Resolution at every zoom level.
- Based on Zoom shows larger cells when zoomed out and smaller cells as you zoom in. Cells are built for every resolution from Start Resolution to End Resolution, and each resolution is shown in its own band of zoom levels between Start Resolution Zoom Level and End Resolution Zoom Level. Each resolution has its own color scale.
Resolution, Start Resolution and End Resolution have an fx button. The value applies to the whole layer, so use a measure, for example one driven by a slicer that lets readers choose the cell size.
Aggregation
Aggregation Type sets how the weights of the points in a cell are combined: Sum, Count, Average, Min or Max. Count counts the rows in each cell, whatever their weight.
Color the cells
Cells are colored on a gradient from Start Color through Mid Color to End Color. By default the scale runs from the smallest to the largest cell value on the map.
- Turn off Use Mid Color for a two-color gradient.
- Turn on Specify Values to fix the scale with Min Value, Mid Value and Max Value, so that colors mean the same thing when the data changes or is filtered. Values outside the range take the end colors. Keep Min Value below Mid Value and Mid Value below Max Value.
For the cell ID sources there is a second option: turn on Use Power BI Formatting to color each cell with conditional formatting instead of the gradient. Fill Color, Outline Color and both transparency settings then take fx, row by row. See Conditional formatting.
Extrude cells in 3D
Turn on Extrude Cells to raise each cell from the map by its value. Tilt the map to see the heights. The cell with the highest value on the color scale rises to Max Extrusion Height (named Extrusion Height for the cell ID sources), in meters, and the others in proportion. Extrusion Start Height adds the same height to every cell.
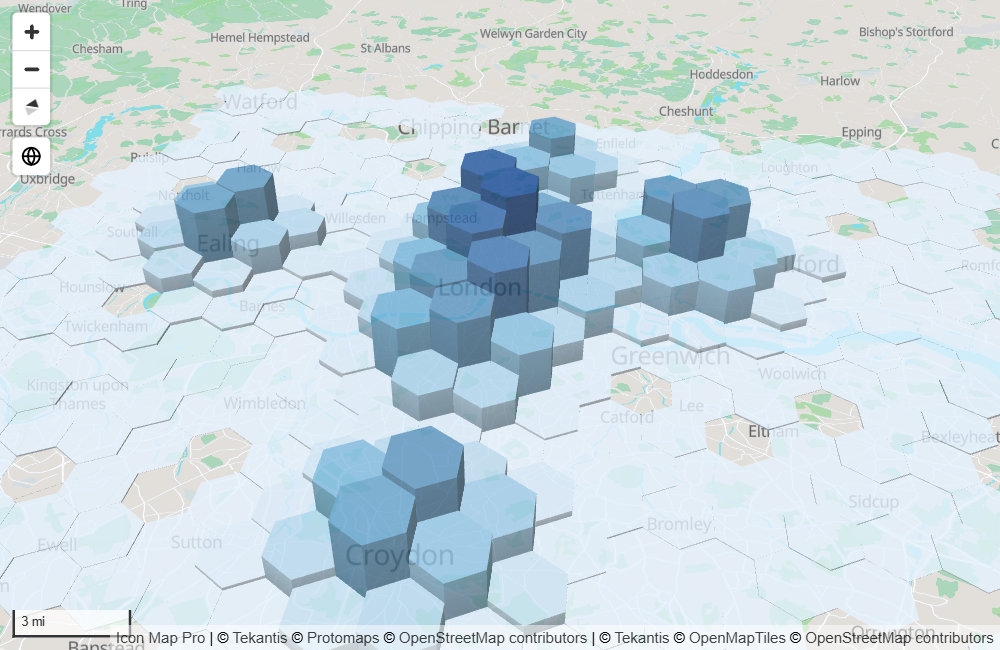
Extruded cells are drawn without outlines.
Custom shapes
Set Source to Custom shapes from Longitude and latitude coordinates to count your points in your own areas instead of a grid: sales territories, districts, delivery zones. Your rows are still points with a weight. The polygons come from a file that you upload and that is stored in the report.
- In Cells - Configuration, set Source to Custom shapes from Longitude and latitude coordinates.
- Switch on Display File Upload Button. The upload dialog opens.
- Choose a GeoJSON, KML, TopoJSON, zipped Shapefile or PMTiles file of polygons.
- Back in the Format pane, check Identify Shapes By and choose an Aggregation Type.
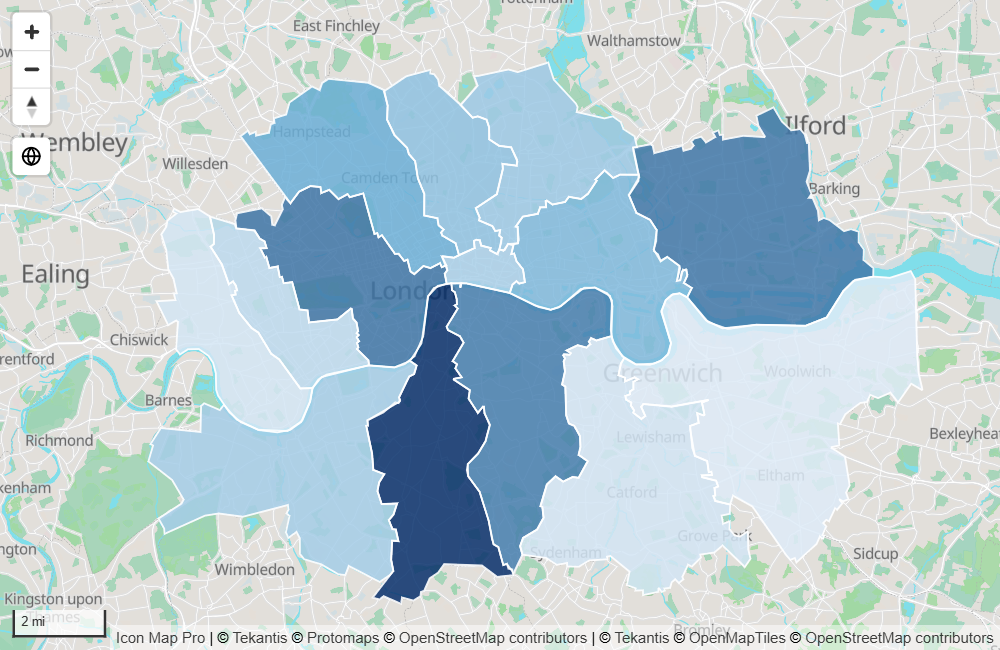
How it behaves:
- Only polygons are used. Lines and points in the file are left out, and the dialog tells you how many.
- A point is counted in every shape that contains it, so overlapping shapes each count it.
- Identify Shapes By says what makes one shape. (Each feature is a shape) treats every feature separately. Choosing a property instead treats features with the same value as one shape, for example a country stored as one feature per island. Features with no value for that property are left out.
- Show Shapes With No Points draws shapes that contain no points in the Start Color. These empty shapes cannot be selected and do not affect auto zoom. Turn it off to hide them.
- There are no resolution settings. Colors, outlines, Specify Values and Extrude Cells work as they do for grid cells.
For a PMTiles file:
- The file can be up to 25 MB.
- Identify Shapes By must be Feature id or a property, because a shape that crosses a tile edge arrives in pieces.
- The shapes come from one layer of the file.
- The level of detail used depends on how far your points spread: points across a continent are counted against simplified shapes, points in one city against full detail.
- Data labels are not available.
To replace or remove the file, switch on Display File Upload Button again.
Settings
All of these are in Format pane > Data Layers, shown when the Cells (H3/S2/A5/Geohash) switch is on. "Point sources" below means the sources ending in "from Longitude and latitude coordinates".
Cells - Configuration
| Setting | What it does | Default | fx |
|---|---|---|---|
| Source | The grid and where cells come from. See Choose a grid and a source. | H3 from Longitude and latitude coordinates | |
| Display File Upload Button | Custom shapes: opens the upload dialog, then switches itself off. | Off | |
| Identify Shapes By | Custom shapes: what makes one shape. | ||
| Aggregation Type | Point sources: Count, Sum, Average, Min or Max. | Sum | |
| Show Shapes With No Points | Custom shapes: draws shapes that contain no points. | On | |
| Resolution Method | Grid point sources: Fixed or Based on Zoom. | Fixed | |
| Resolution | Cell size for Fixed. Higher is finer. | 3 | Yes |
| Start Resolution | Based on Zoom: the resolution when zoomed out. | 5 | Yes |
| Start Resolution Zoom Level | Based on Zoom: the zoom level where the resolution starts to increase. 0 to 22. | 6 | Yes |
| End Resolution | Based on Zoom: the resolution when zoomed in. | 8 | Yes |
| End Resolution Zoom Level | Based on Zoom: the zoom level where the resolution stops increasing. 0 to 22. | 12 | Yes |
| Zoom By | Point sources: what auto zoom fits. Polygons fits the whole cells, Points fits the points, None leaves cells out of auto zoom. | Polygons | |
| Include in Zoom | Whether a row counts toward auto zoom. Shown for Zoom By = Points, and for cell ID sources. | Yes | Yes |
| Include Tooltips | Shows a tooltip on each cell. | Off | |
| Show data labels | Labels each cell. Data labels must also be turned on. Not available for custom shapes from a PMTiles file. | Off | |
| Selectable | Whether a row's cell can be selected. | Yes | Yes |
| Minimum Zoom | Cells are hidden when the map is zoomed out past this level. | 0 | |
| Maximum Zoom | Cells are hidden when the map is zoomed in past this level. | 24 | |
| Z-Index | Drawing order among the layers. Higher draws on top. 0 to 1000. | 400 | |
| EPSG | Point sources: coordinate system of your longitude and latitude. | 4326 |
Cells - Formatting
| Setting | What it does | Default | fx |
|---|---|---|---|
| Use Power BI Formatting | Cell ID sources: color cells with conditional formatting instead of the gradient. | Off | |
| Outline Color | Color of the cell outline. | Theme color | With Use Power BI Formatting |
| Outline Transparency | 0 is solid, 100 is invisible. | 10 | With Use Power BI Formatting |
| Outline Width | Width of the outline in pixels. 0 removes it. | 1 | |
| Fill Color | The cell color when Use Power BI Formatting is on. | Theme color | Yes |
| Fill Transparency | 0 is solid, 100 is invisible. | 10 | With Use Power BI Formatting |
| Start Color | Color of the lowest value. | Theme color | |
| Use Mid Color | Adds a middle color to the gradient. | On | |
| Mid Color | Color of the middle of the scale. | Theme color | |
| End Color | Color of the highest value. | Theme color | |
| Specify Values | Fixes the color scale to the values below. | Off | |
| Min Value | The value that takes Start Color. | 0 | Yes |
| Mid Value | The value that takes Mid Color. | 50 | Yes |
| Max Value | The value that takes End Color. | 100 | Yes |
| Extrude Cells | Raises each cell by its value. | Off | |
| Max Extrusion Height | Point sources: height in meters of the highest cell. Up to 10,000,000. | 10000 | |
| Extrusion Height | Cell ID sources: height in meters of the highest cell. | 10000 | Yes |
| Extrusion Start Height | Height in meters added to every cell. | 0 |
Like the resolution settings, Min Value, Mid Value and Max Value apply to the whole layer, so set them with a measure rather than a per-row rule.
Selection, tooltips and labels
- Selection. Selecting a cell made from points selects every row in it, which cross-filters or cross-highlights the report page by those rows. Select it again to clear the selection. With a cell ID source, each cell is one row. Flat cells that are not selected fade. Extruded cells that are not selected turn gray instead, because 3D shapes cannot fade individually. See Selection, cross-filtering and highlighting.
- Tooltips. Turn on Include Tooltips. For cells made from points, the tooltip shows the weight field's name and the cell's aggregated value. If you add fields to Tooltips, each is aggregated over the rows in the cell using that field's own summarization, such as Sum or Average. For cell ID sources the tooltip works as for any other row. See Tooltips.
- Labels. Turn on Show data labels and turn on data labels for the visual. Cells made from points are labeled with their aggregated value, in the weight field's format. See Data labels.
- Legend. Cells can have an entry in the legend. See Legend.
Tips and limits
- Start with a low resolution and raise it. Each step up makes cells several times smaller and increases the number of cells to draw.
- Based on Zoom builds cells for every resolution in its range each time the map updates. Keep the range between Start Resolution and End Resolution small for large datasets.
- Cell IDs that are not valid for the chosen grid are skipped.
- For more than 30,000 points, see Data rows and limits.
- To join your data to boundaries by a code or name rather than counting points inside them, use Shapes from files.