
Choose a layer type
Icon Map Pro draws your data with data layers. Each layer type suits a kind of data and needs its own set of fields. This page helps you pick one, and explains the guide that appears on the map when your fields do not match a layer yet.
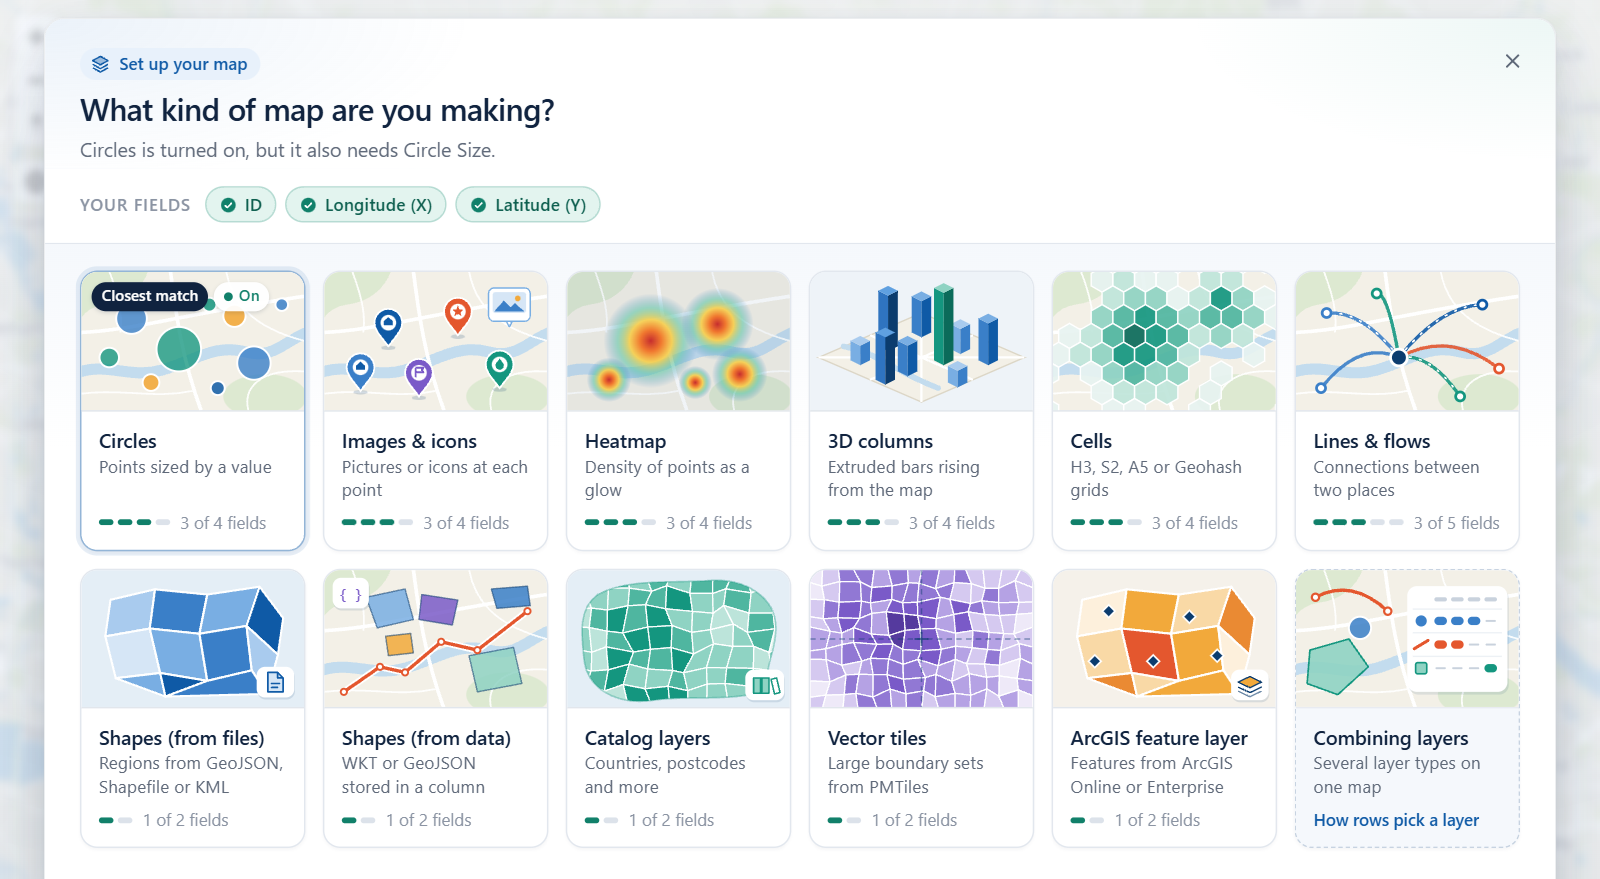
Pick by what you want to show
| You have | You want to show | Use |
|---|---|---|
| Points (a longitude and latitude per row) | A marker per place, sized or colored by a value | Circles |
| Points | A picture, icon or badge per place | Images and icons |
| Many points close together | Groups that open up as you zoom in | Clusters |
| Very many points | Where they concentrate | Heatmap |
| Many points, or cell IDs | Totals in a grid of hexagons or squares | Cells: H3 hexagons and grids |
| Points | A value as the height of a 3D bar | 3D columns |
| Pairs of points (origin and destination) | Connections, flows and arcs | Lines |
| Pairs of points along shared streets | Lines side by side, like transit lanes | Routes |
| Shapes stored in your data as text | Polygons and lines from WKT or GeoJSON | Shapes from data (WKT and GeoJSON) |
| A code or name per row, and a boundary file | Regions colored by your data | Shapes from files |
| A code or name per row, and no file | Ready-made boundaries such as countries or postcodes | Icon Map Catalog layers |
| A code or name per row, and a very large boundary set | Detailed boundaries served as tiles | Vector tiles |
| A code or name per row, and an ArcGIS feature layer | ArcGIS features styled with your values | ArcGIS layers bound to data |
The fields each layer needs
Every layer needs * ID (required). The table lists what each needs in addition.
| Layer | Fields it needs | Switch in Format pane > Data Layers |
|---|---|---|
| Circles | Longitude (X), Latitude (Y), Circle Size | Circles |
| Images and icons | Longitude (X), Latitude (Y), Image / WKT / GeoJSON (not needed when the image comes from the icon library or one image address for every point) | Images / Icons |
| Heatmap | Longitude (X), Latitude (Y), Heatmap Weight | Heatmap |
| 3D columns | Longitude (X), Latitude (Y), Column Height | Columns |
| Cells, from coordinates | Longitude (X), Latitude (Y), Cell (H3/S2/A5/Geohash) Weight | Cells (H3/S2/A5/Geohash) |
| Cells, from cell IDs | The cell ID in * ID (required), and Cell (H3/S2/A5/Geohash) Weight | Cells (H3/S2/A5/Geohash) |
| Lines and routes | Longitude (X), Latitude (Y) for the origin, Destination Longitude, Destination Latitude | Lines |
| Shapes (from data) | Image / WKT / GeoJSON, holding WKT or GeoJSON text | Shapes (from data) WKT / GeoJSON features |
| Shapes (from files) | Feature Reference, matching a property of each shape in the file | Shapes (from files) GeoJSON / Shapefile / KML / IMDF |
| Vector tiles | Feature Reference, matching a property of each feature in the tiles | Vector Tiles |
| Layer | Fields it needs | Where it is turned on |
|---|---|---|
| ArcGIS feature layer | Feature Reference, matching an attribute of each feature | Format pane > Data Layers > ArcGIS Layer |
| Catalog layers | Feature Reference, holding the boundary code or name | Added and joined to your data in the catalog dialog: Format pane > Catalog > Configure Layers |
Clusters are an option of the Circles and Images layers, with an optional Cluster Group field. Routes are a line shape of the Lines layer.
A row is drawn by a layer only when it leaves the fields of other layers empty. For example, a circle row must not have a destination, a heatmap weight or a feature reference. This matters when one table feeds several layers. See How Icon Map Pro works and Combine several layers in one map.
The layer guide: "What kind of map are you making?"
While you edit a report, Icon Map Pro checks whether your rows reach a layer. When none do, it shows the layer guide over the map so that you are not left with a blank visual.
When it appears
| What you see | When |
|---|---|
| The full guide, over the map | There is data, but no row is drawn by any layer that is turned on. This includes when only the ID is added, and when fields are added without an ID. |
| A small notice, with the map still visible | Some rows are drawn, but a layer that is turned on is missing fields. Select See what each layer needs to open the full guide, or Dismiss to hide the notice. |
| Nothing | Every turned-on layer has what it needs, or there are no rows at all (for example, a filter returns nothing). |
The guide appears only while you edit. Report readers never see it. Closing it hides it until the situation changes.
Read the guide
The top of the guide explains in one or two sentences what is missing. Under Your fields it lists the fields you have added. Then come twelve tiles: one for each layer type, and Combining layers.
Each tile shows how close you are:
| On the tile | Meaning |
|---|---|
| Closest match | The layer type your fields fit best. |
| Fields ready or All fields ready | You have added every field this layer needs. |
| A count of fields, such as 2 of 4 | How many of its fields you have added. |
| On | The layer is turned on. |
Point to a tile, or select it with the keyboard, to expand it. The expanded card shows:
- Fields it needs, each ticked or marked as still to add, with a hint about what belongs in it.
- Leave these empty on its rows, the fields that would send a row to a different layer. Fields you are using are highlighted.
- Where the layer's switch is in the Format pane.
- A button that opens the documentation page for that layer.
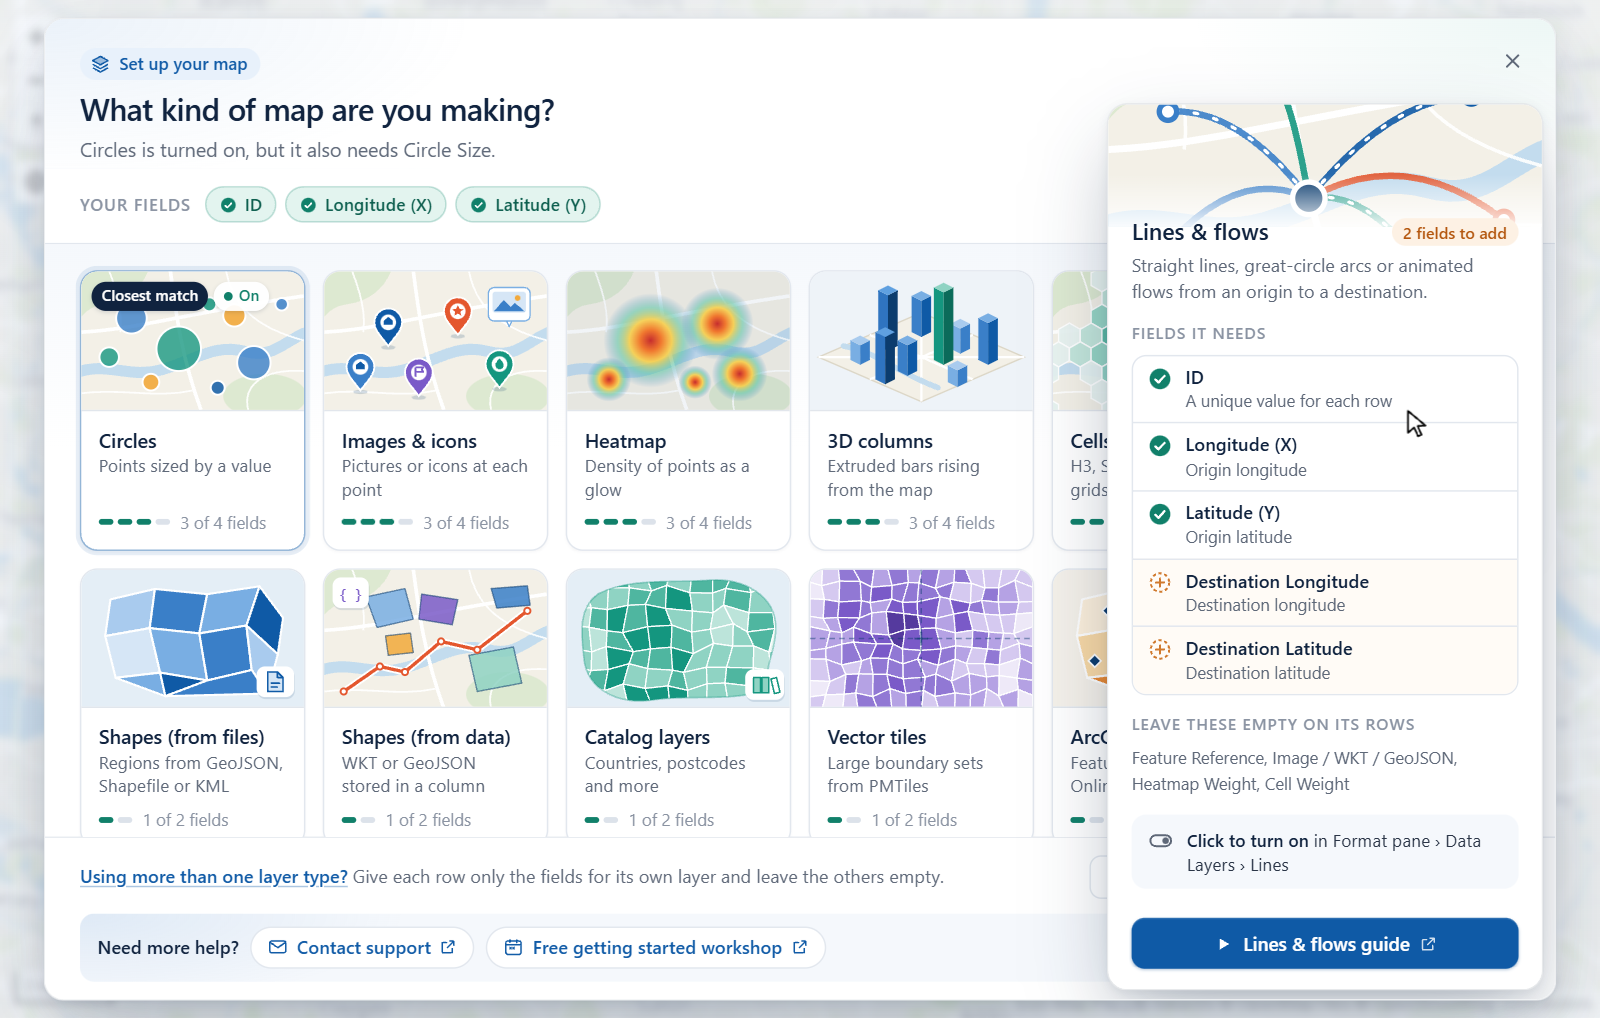
Pick a layer
Select a tile to turn that layer on.
- The layer's switch is turned on for you, and the Layer Manager opens on that layer so you can set it up.
- If every row suits the layer you picked, the other data layers that were on are turned off, and the guide tells you which.
- Catalog layers have no switch. The guide shows you where to add them instead.
The Open Layer Manager button at the bottom of the guide opens the Layer Manager on its home view, where Your data shows how many rows each layer draws. See Check your data.
Combining layers
The last tile, Combining layers, explains how to show several layer types on one map: keep the rows in one table, give each row only the fields for its own layer, and leave the others blank. Combine several layers in one map covers this in depth.
Tips and limits
- The layer guide is part of the Modern engine. Maps on the Legacy engine do not show it. See Modern and Legacy engines.
- A row that has both a Circle Size and a Column Height is drawn as neither a circle nor a column. Give each row one or the other.
- 3D columns are easiest to see with the map tilted. See View, zoom and projection.
- Reference layers are not in this list because they do not use your data. See Reference layers overview.