
Layer Manager
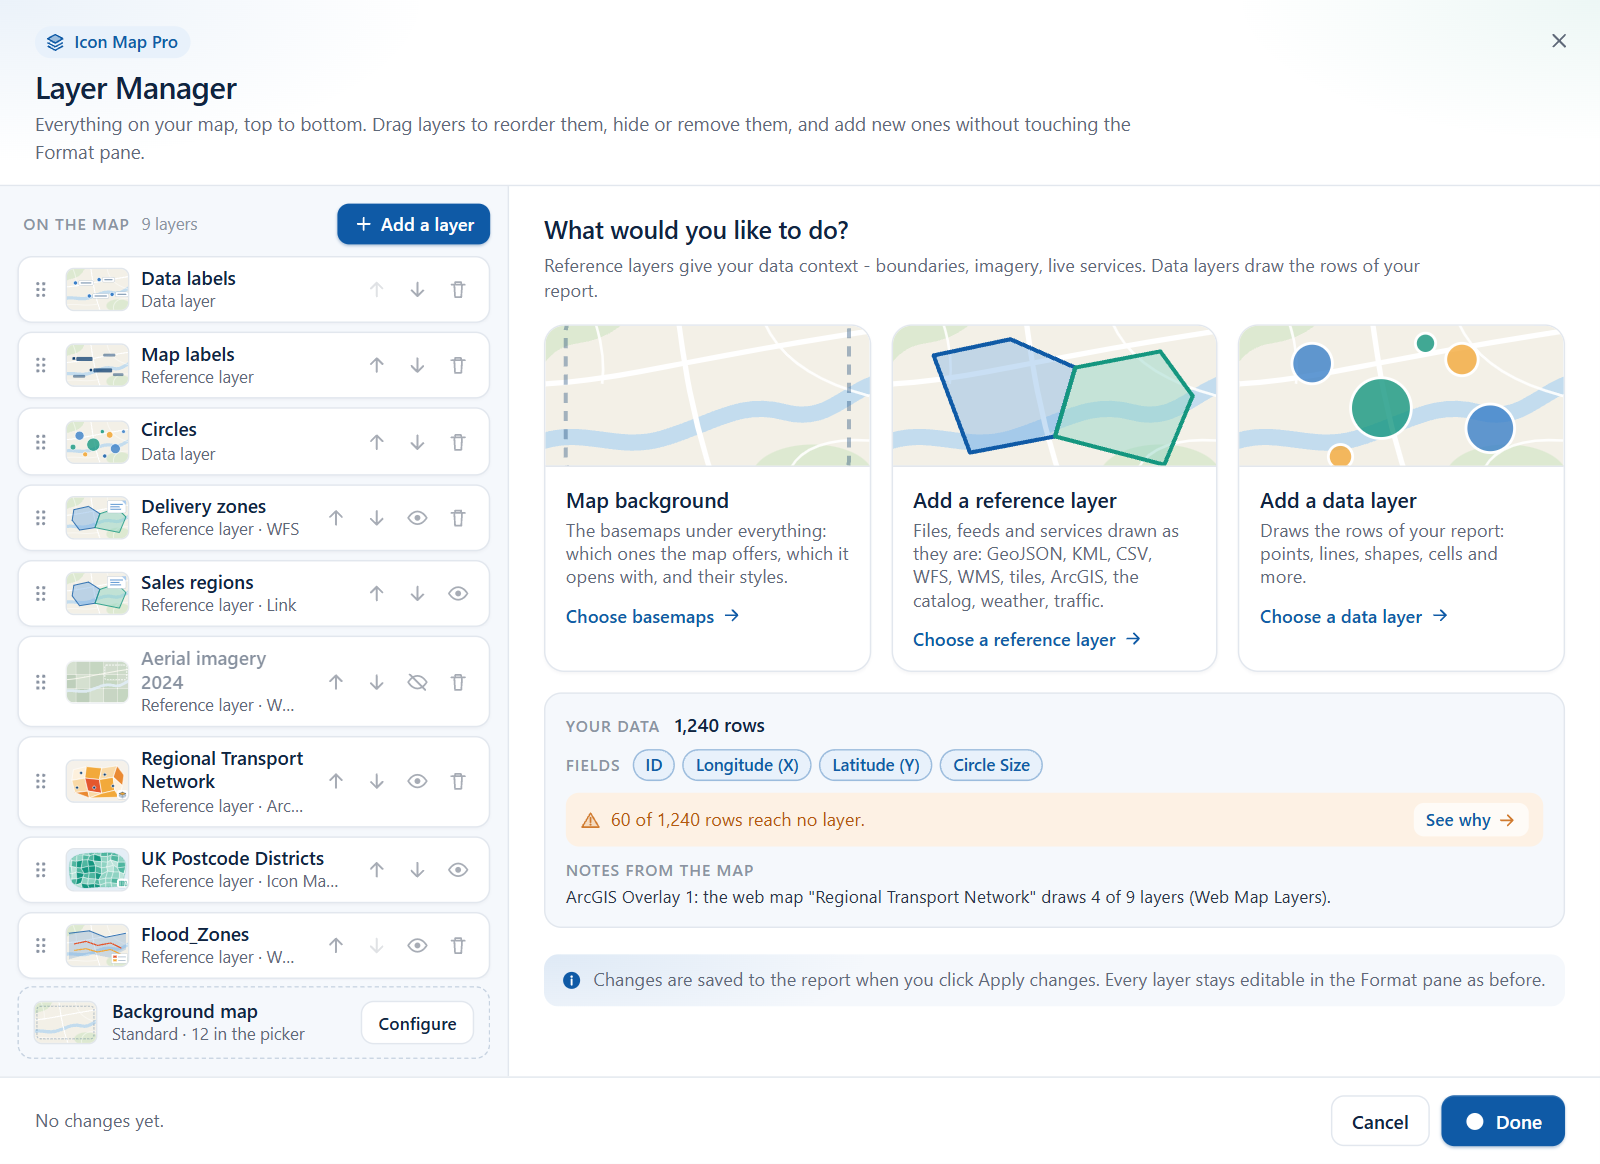
The Layer Manager is a dialog that shows everything on your map in one list, top to bottom. Use it to add data layers and reference layers step by step, change their main settings, reorder them, hide them or remove them.
Before you start
- The Layer Manager is part of the Modern map engine. See Modern and Legacy engines.
- You open it while editing a report in Power BI Desktop or the Power BI service. Report readers do not see it.
- Add your fields to the visual first if you want to add a data layer. The dialog uses them to tell you which layer types fit your data.
Open the Layer Manager
There are three ways in.
- From the Format pane. Switch on Format pane > Layer Manager > Layer Manager > Open Layer Manager. The Layer Manager card is the first card in the pane. The switch opens the dialog and then turns itself off again, so it is ready for next time.
- From the layer guide. When your rows do not reach any layer, the map shows the guide What kind of map are you making?. Select Open Layer Manager at the bottom of the guide.
- By picking a layer in the layer guide. Selecting a tile in the guide turns that layer on and opens the Layer Manager on that layer, ready to set up. See Choose a layer type.
A tour of the dialog
The dialog has a header, two columns and a footer.
| Area | What it holds |
|---|---|
| Left column - On the map | Every layer that is switched on, top-most first, with a count of layers and the Add a layer button. The last row is always Basemap. |
| Right column | The home view to start with. It changes to a picker, an add wizard or a layer's editor as you work. |
| Footer | The number of changes you have made, and the Cancel and Apply changes buttons. |
The list of layers
The list shows your layers in the order the map draws them: the row at the top of the list is drawn on top of everything below it. Each row has buttons to move, hide and remove the layer, and you select a row to open its editor. See Edit, reorder and remove layers.
When nothing is switched on yet, the list reads "Nothing is on the map yet. Add a data layer to draw your report, or a reference layer for context."
The home view
The right column starts on What would you like to do? with three cards and a summary of your data.
| Card | What it does |
|---|---|
| Map background | Opens the Basemaps dialog, where you choose the basemaps the map offers and their styles. See The Basemaps dialog. |
| Add a reference layer | Opens the list of reference layer types: files, feeds, services, the catalog, weather and traffic. |
| Add a data layer | Opens the list of data layer types. When a layer type that is off fits the fields you have, the card tells you how many do. Otherwise it reads "Draws the rows of your report: points, lines, shapes, cells and more." |
Below the cards, the Your data panel shows how many rows the visual has, which fields are filled in, and whether every row is drawn. See Check your data.
The Map background card and the Configure button on the Basemap row open the Basemaps dialog on maps that use a basemap list. The Basemaps overview explains which maps these are. On other maps the card and the button are disabled and show "Coming soon". Set the basemap of those maps in the Format pane instead: see Set the basemap in the Format pane.
Add a layer
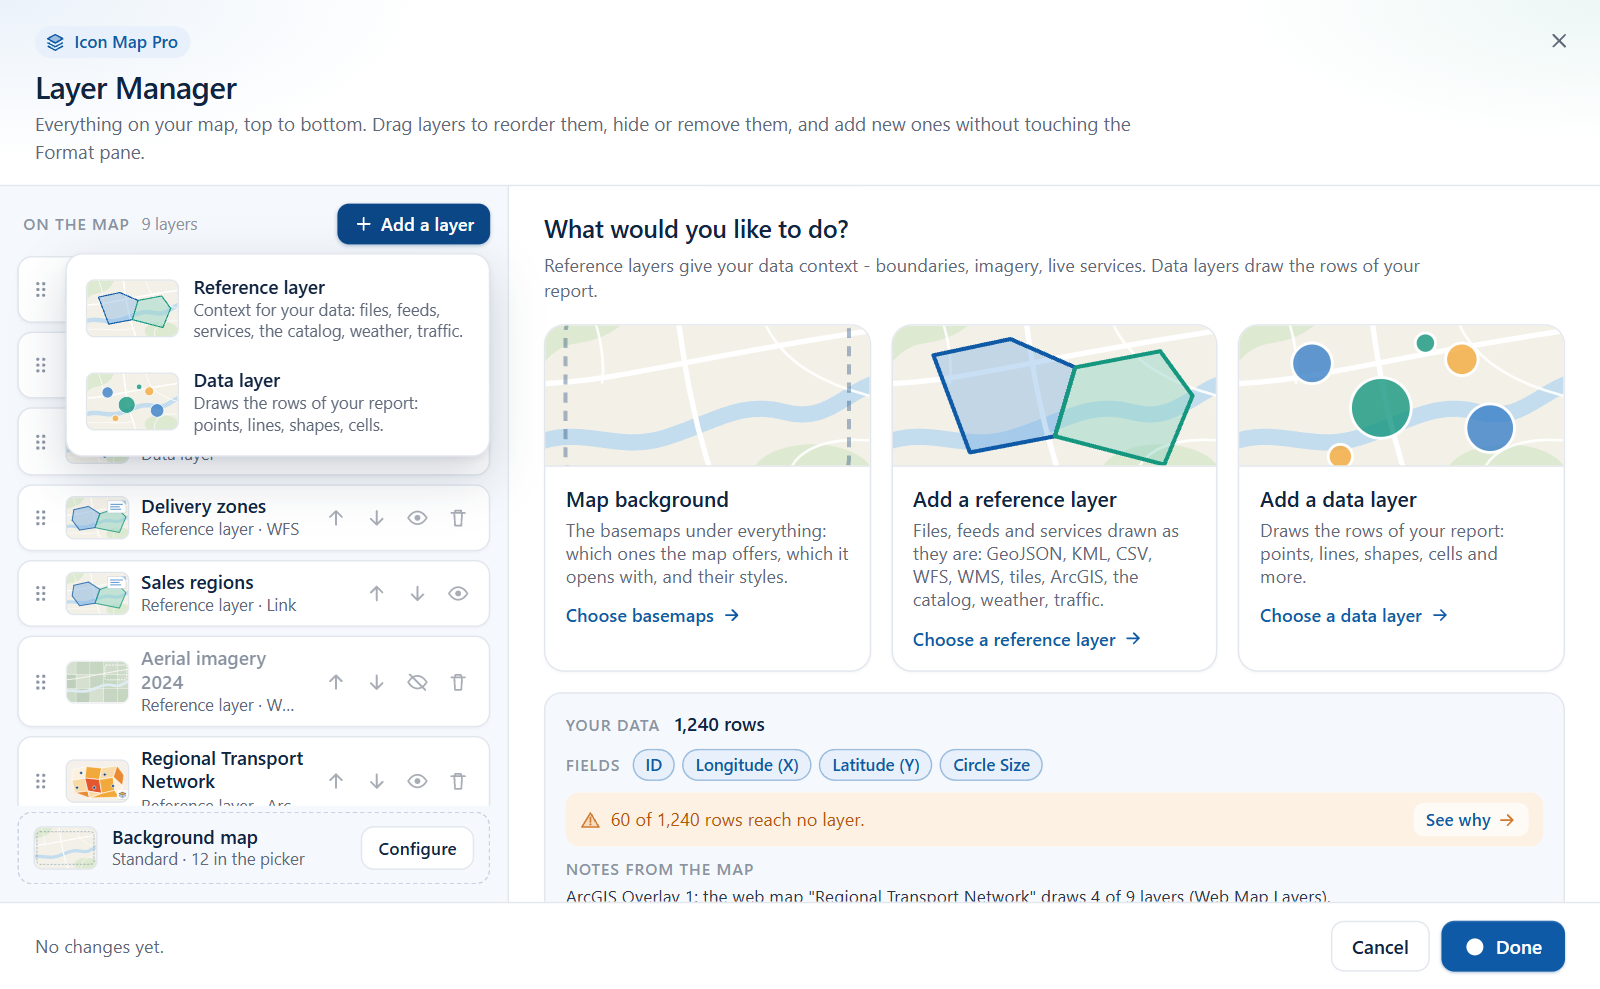
Select Add a layer above the list at any time. A short menu offers two choices.
| Choice | What it is for |
|---|---|
| Reference layer | Context for your data: files, feeds, services, the catalog, weather, traffic. Reference layers are drawn as published and are not joined to your data. |
| Data layer | Draws the rows of your report: points, lines, shapes, cells. |
Each choice opens a picker of tiles, and each tile starts a short wizard. See Add a layer.
Apply or cancel
Nothing you do in the dialog changes the report until you select Apply changes.
| Footer shows | Meaning |
|---|---|
| "No changes yet." and a Done button | Nothing to save. Done closes the dialog. |
| "1 change" or "3 changes - applied to the map when you click Apply changes." | Each reorder, hide, show, removal, added layer and edited setting counts as one change. Apply changes saves them all and closes the dialog. |
| Cancel, or the close button in the top corner | Discards the changes you made since the dialog opened. |
The Esc key steps back: it closes the Add a layer menu, then returns the right column to the home view, then cancels the dialog.
Power BI shows one dialog at a time. When a step needs another window (Browse ArcGIS, the Icon Map Catalog, the file upload or the Basemaps dialog), the Layer Manager first saves every change you have made so far, then closes, and reopens when the other window is done. Cancel after that point cannot undo the changes that were already saved.
Layer Manager and the Format pane
The Layer Manager and the Format pane edit the same settings. A layer you add in the dialog appears in the Format pane, and a change you make in the Format pane shows in the dialog the next time you open it. A report built entirely in the Format pane opens in the Layer Manager unchanged.
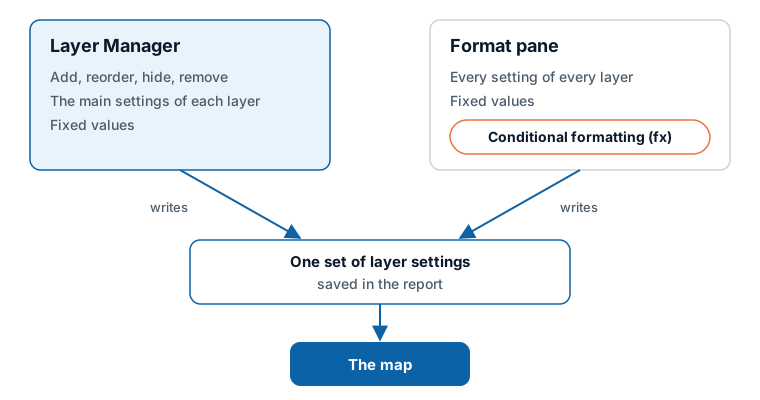
The two differ in how much they show:
- The Layer Manager shows the settings most maps need, in plain words, and sets fixed values: one color, one size, one width for a layer.
- The Format pane holds every setting. It is also the only place for conditional formatting (fx), where a color, a size or another setting takes its value from your data.
Each editor in the Layer Manager names the place in the Format pane where the rest of that layer's settings are.
What still needs the Format pane
- Conditional formatting (fx) on any setting, for example circle colors from a measure. See Conditional formatting.
- The advanced options of each layer that the editors do not show. See the list in Edit, reorder and remove layers.
- Switching data labels on. Labels appear in the Layer Manager list once they are on. See Data labels.
- Tooltips, the legend, map controls, selection behavior and the map view. These are not layers and have their own cards: see the Format pane map.
- The basemap, on maps without a basemap list.