
3D columns
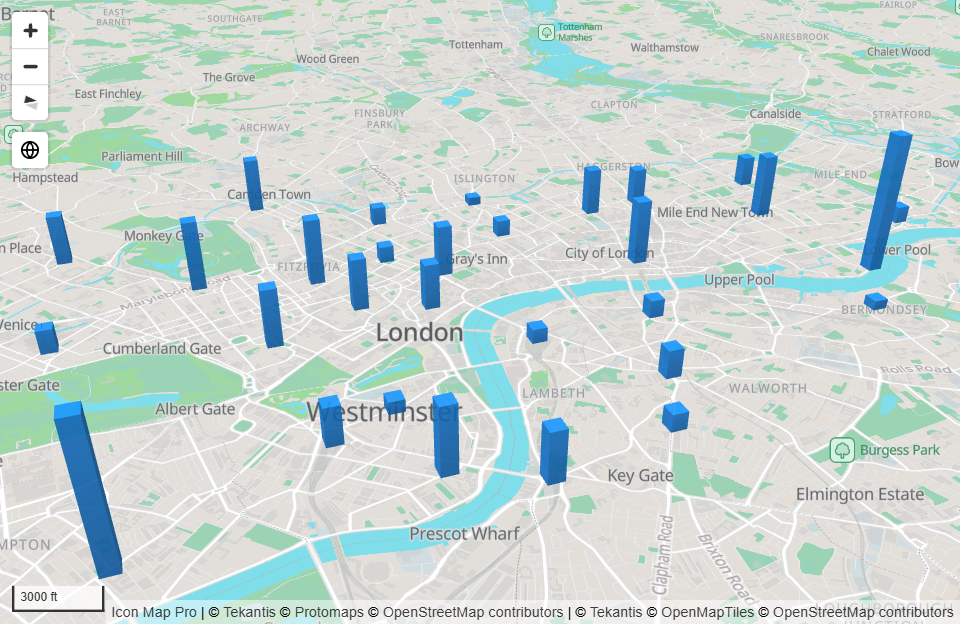
The Columns layer draws a 3D column at each longitude and latitude, with its height set by a number in your data. Tilt the map and the columns rise from it like a bar chart placed on the ground.
What you need
| Field well | What to put in it |
|---|---|
| * ID (required) | A unique value for each row |
| Longitude (X) | Longitude in decimal degrees, summarized as Average |
| Latitude (Y) | Latitude in decimal degrees, summarized as Average |
| Column Height | A number that sets each column's height |
These fields must be empty on a column's rows: Circle Size, Heatmap Weight, Cell (H3/S2/A5/Geohash) Weight, Destination Longitude, Destination Latitude, Image / WKT / GeoJSON and Feature Reference.
A row with a value in both Circle Size and Column Height is not drawn as either. If you started with circles, take the field out of Circle Size.
Add columns to the map
- Add fields to * ID (required), Longitude (X) and Latitude (Y). Set the coordinates to Average.
- Add a number to Column Height.
- If the panel What kind of map are you making? is showing, select the 3D columns tile. It turns the layer on and opens the Layer Manager on it. Otherwise, in the Format pane expand Layer Manager, switch on Open Layer Manager, and select Add a layer, Data layer, 3D columns.
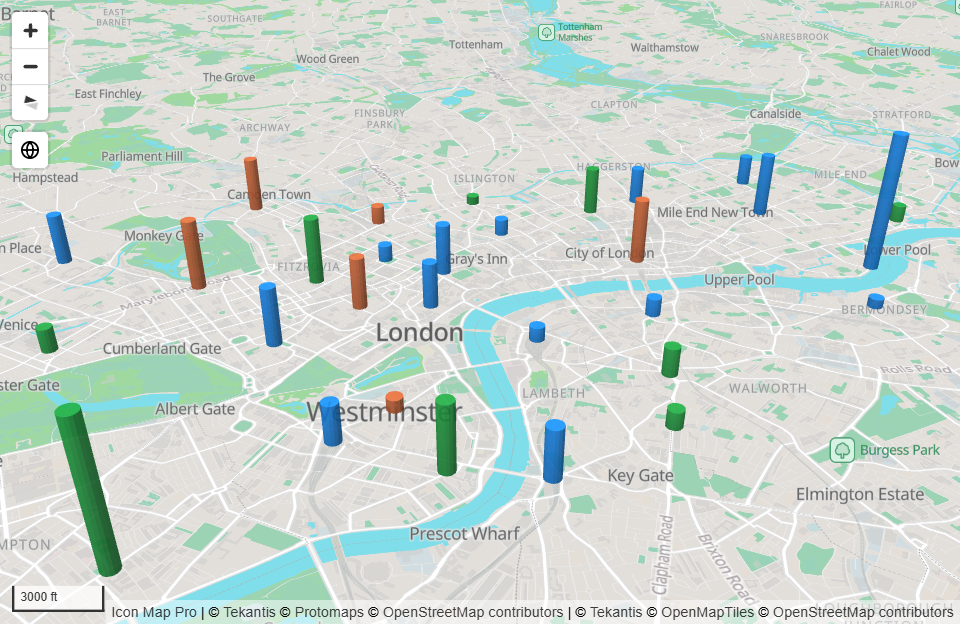
- Set the Width in meters to suit the area your map covers, and choose a Color.
- If you are adding the layer, select Add to map. Then select Apply changes.
- Tilt the map to see the columns from the side.
The Layer Manager offers these settings. To change them later, open the Layer Manager and select the 3D columns row.
| Layer Manager setting | Same as, in the Format pane |
|---|---|
| Shape | Shape |
| Height | Height Behavior |
| Column height | Min Height and Max Height |
| Width | Width |
| Color | Color and Transparency |
Base Height, the zoom range, selection and tooltip options and conditional formatting (fx) are in Format pane > Data Layers.
Columns are measured in meters. The default Width of 100 meters is right for a city, but smaller than a pixel on a map of a whole country. Raise Width, and Max Height, until the columns suit the scale of your map. To tilt the map, and to open it already tilted, see View, zoom and projection.
How column height works
Heights are in meters on the ground, so how tall a column looks depends on the zoom level. Height Behavior sets how the Column Height value is used.
| Height Behavior | What it does |
|---|---|
| Relative | The smallest value in your data gets Min Height, the largest gets Max Height, and the rest are scaled in between. If every value is the same, every column is drawn halfway between the two. |
| Height in Meters | The value is the column's height in meters. Base Height lifts the bottom of the column off the ground by that many meters, and the column rises from there. |
Use Relative to compare values such as sales or counts. Use Height in Meters when the data is a real height, such as buildings or masts, or to stack columns by giving each a different Base Height with conditional formatting.
Settings
All of these are in Format pane > Data Layers, shown when the Columns switch is on.
Columns - Configuration
| Setting | What it does | Default | fx |
|---|---|---|---|
| Include in Zoom | Whether a column counts toward the area the map zooms to. | Yes | Yes |
| Allow Selection | Whether a column can be selected. | Yes | Yes |
| Include Tooltip | Whether a column shows a tooltip. | Yes | Yes |
| Min Zoom | Columns are hidden when the map is zoomed out past this level. 0 to 24. | 0 | |
| Max Zoom | Columns are hidden when the map is zoomed in past this level. 0 to 24. | 24 | |
| Z-Index | Drawing order among the layers. Higher draws on top. 0 to 1000. | 500 | |
| EPSG | Coordinate system of your longitude and latitude. | 4326 |
Columns - Formatting
| Setting | What it does | Default | fx |
|---|---|---|---|
| Shape | Square or Circle. | Square | |
| Height Behavior | Relative or Height in Meters. See above. | Relative | |
| Min Height | Relative: height in meters of the smallest value. 0 to 10,000,000. | 100 | |
| Max Height | Relative: height in meters of the largest value. 0 to 10,000,000. | 5000 | |
| Base Height | Height in Meters: height in meters at which the column starts. | 0 | Yes |
| Width | Width of the column in meters: the side of a square or the diameter of a circle. 1 to 100,000. | 100 | Yes |
| Color | Color of the column. | Theme color | Yes |
| Transparency | Transparency of all columns. 0 is solid, 100 is invisible. | 10 |
Transparency is one value for the whole layer. It cannot vary from column to column.
Selection, tooltips and labels
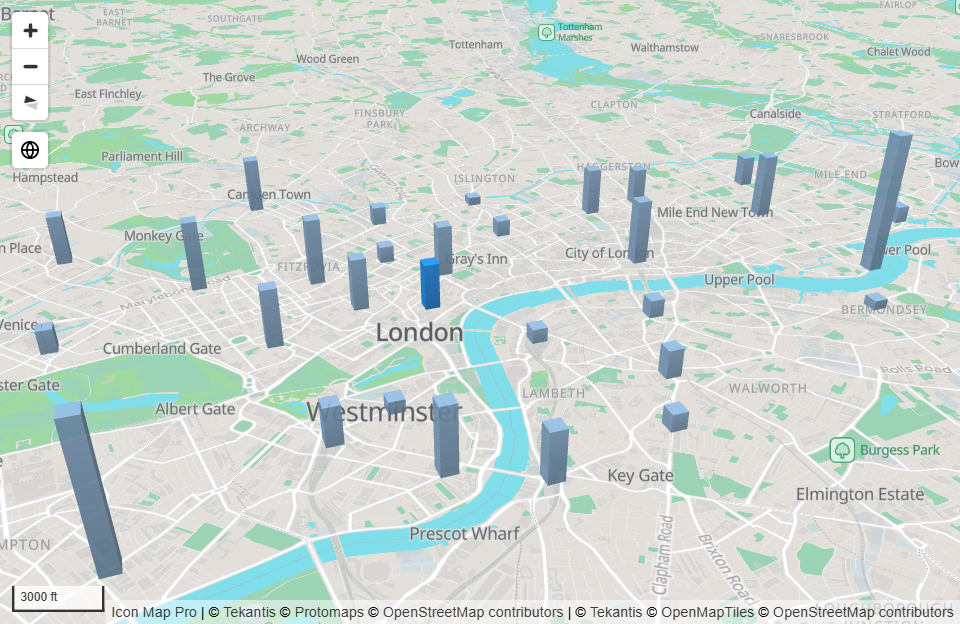
Selection. Select a column to cross-filter or cross-highlight the report page. Hold Ctrl to select several. Columns that are not selected turn gray rather than fading, because 3D shapes cannot fade individually. Selected columns keep their color. See Selection, cross-filtering and highlighting.
Tooltips. With no fields in Tooltips, the tooltip shows the ID. Add fields to Tooltips to show those instead. See Tooltips.
Labels. Columns do not carry data labels.
Tips and limits
- Columns need the Modern engine. See Modern and Legacy engines.
- Auto zoom frames the tops of the columns as well as their bases, so tall columns are not cut off.
- Each row is one column. To total values by area before drawing them in 3D, use Cells with Extrude Cells.
- Columns can be drawn very tall, up to 10,000,000 meters, which suits a map of the whole globe.