
Add a layer
The Layer Manager adds a layer in a few guided steps: pick the type, say where it comes from, choose its main options, and add it to the map. This page lists every tile and every step.
The quick path
- Open the Layer Manager and select Add a layer above the list of layers.
- Choose Reference layer for context such as boundaries, imagery or weather, or Data layer to draw the rows of your report.
- Select a tile. The wizard for that layer type opens.
- Work down the numbered steps. For a link, select Check so the dialog can read it before you add it.
- Select Add to map. The layer joins the list with a New badge.
- Select Apply changes to save the report and see the layer on the map.
You can also start from the home view with the cards Add a reference layer and Add a data layer.
How the wizard works
- The title reads Add followed by the layer type. The trail above it (Layers › Reference layer › Files & feeds, for example) takes you back to the picker or the home view.
- The numbered steps are on the left. They are numbered as they appear: a step that the layer does not need is left out and the later steps move up, and a finished step shows a mark instead of its number. On the right is a panel with the layer type's picture and description. For data layers it also lists Fields it needs, with a tick against each field you have already added, and a button that opens the documentation page for that layer type, in the report's language where a translation is published.
- Choices you make in the steps wait until you add the layer. The last step is always Add it, with the Add to map button and the reminder "Nothing is saved until Apply changes."
- A data layer whose fields are not all in the visual can still be added. The last step tells you which fields to add: "It will draw once you add ... to the Fields well."
After Add to map, the right column confirms that the layer is on the list and offers three buttons:
| Button | What it does |
|---|---|
| Apply changes | Saves everything and closes the dialog. |
| Style it | Opens the new layer's editor. |
| Add another layer | Returns to the picker you came from. |
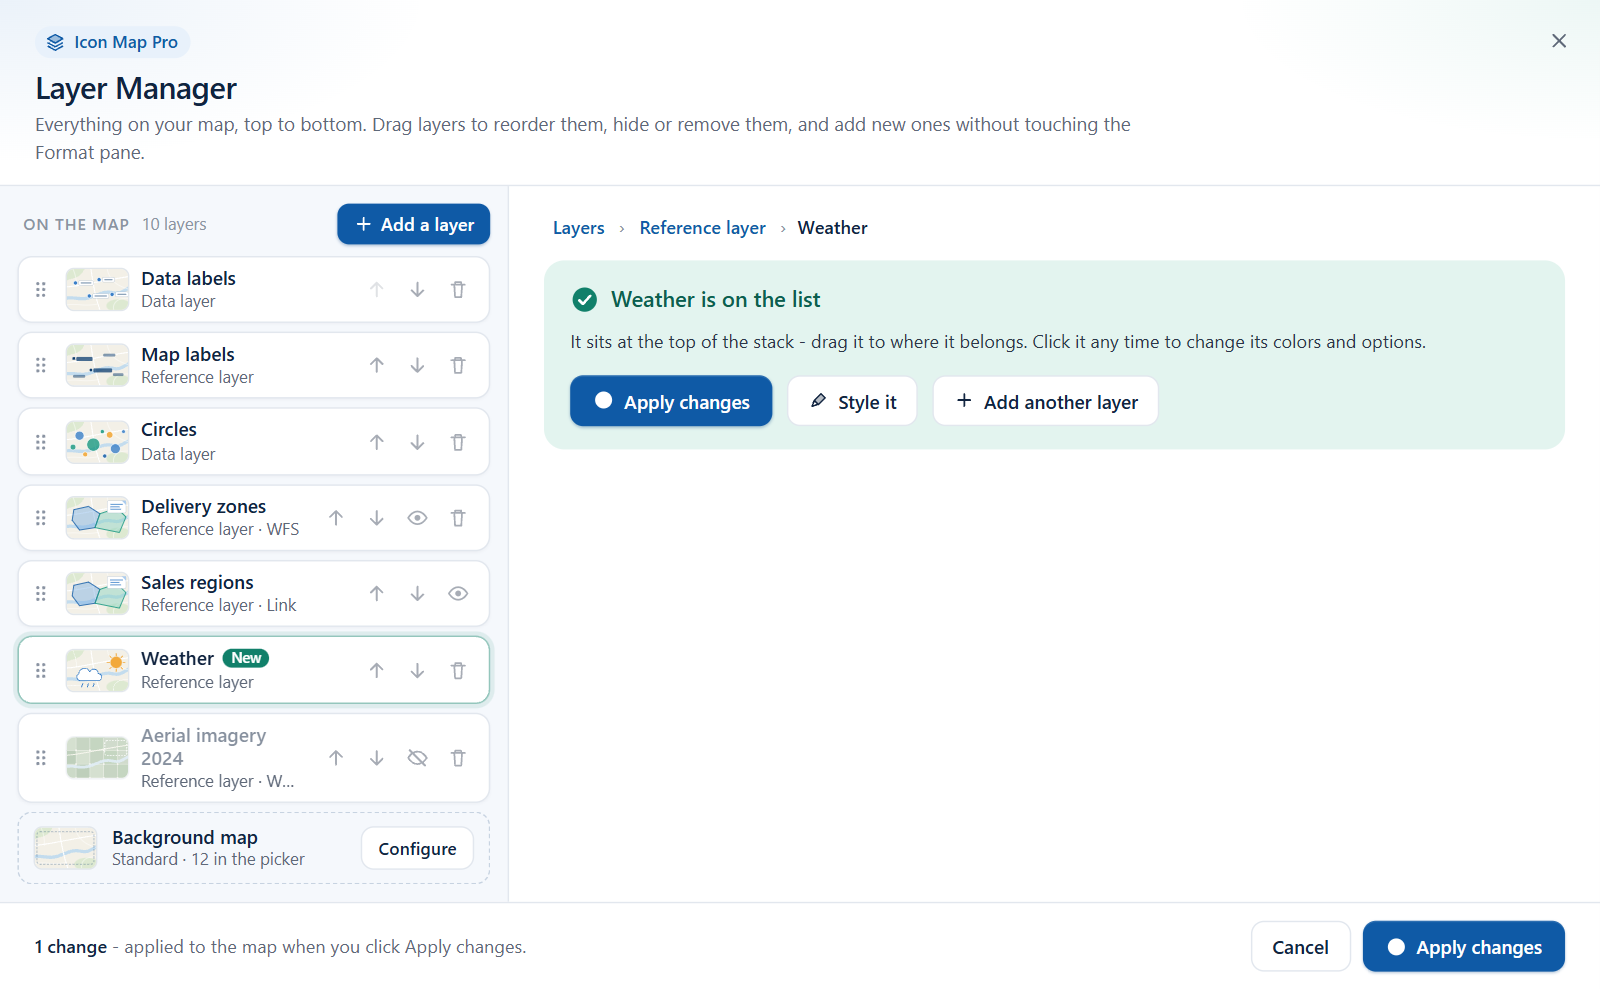
A new layer takes its default place in the drawing order. Drag it in the list if it belongs higher or lower. See Edit, reorder and remove layers.
Reference layer tiles
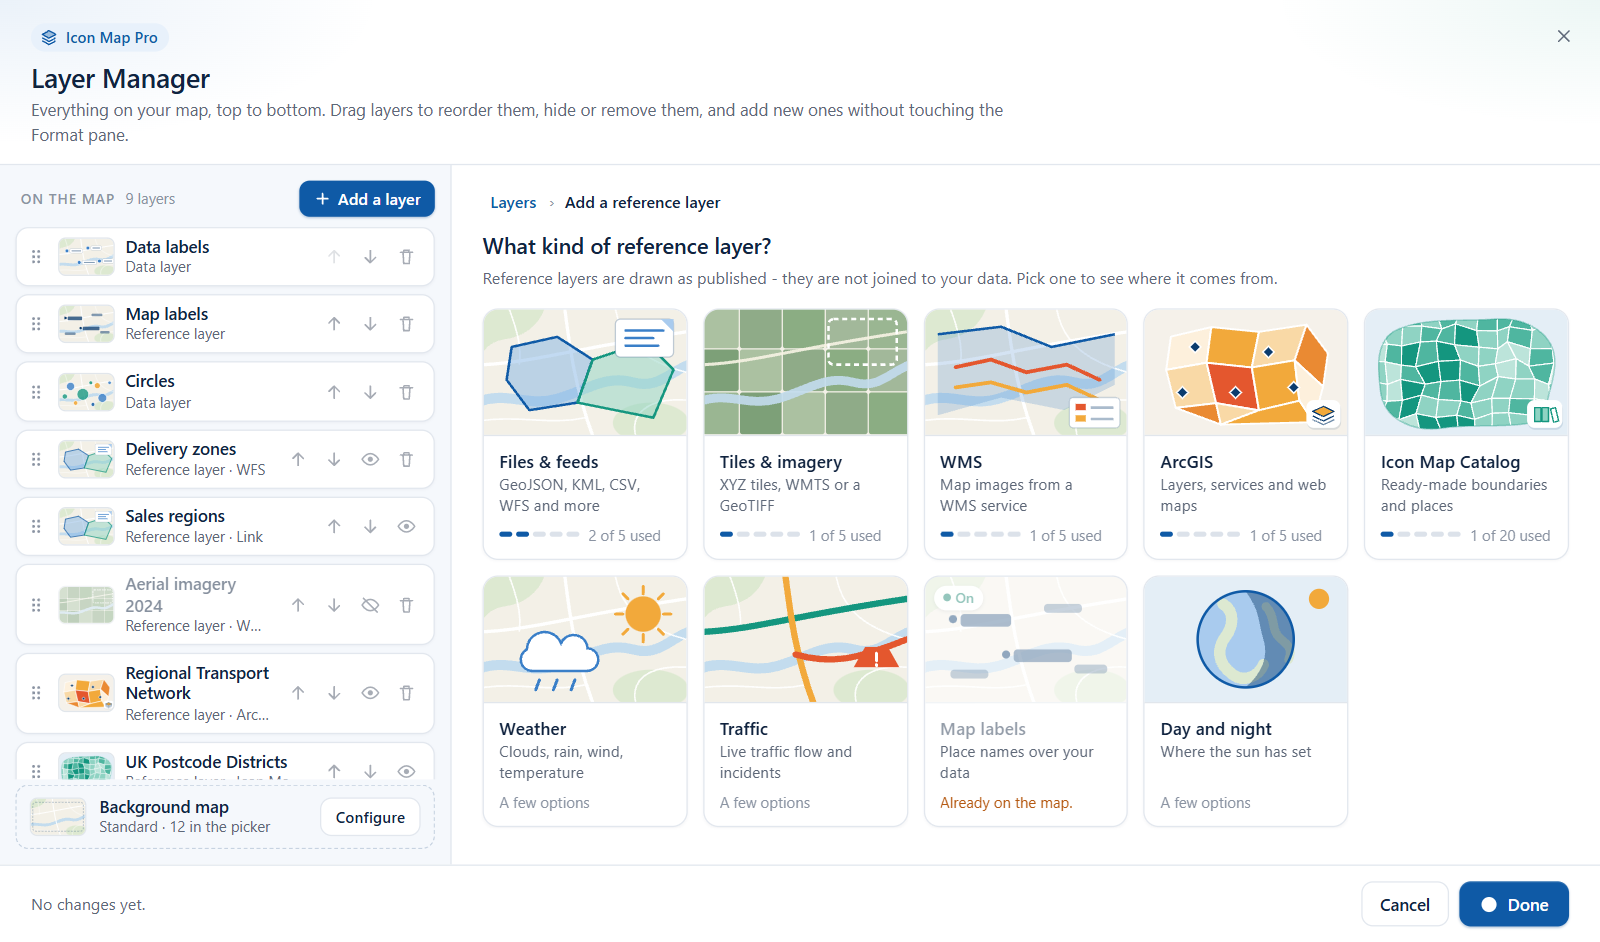
The picker is titled What kind of reference layer?. Reference layers are drawn as published. They are not joined to your data.
| Tile | What it adds | How many | Where it comes from |
|---|---|---|---|
| Files & feeds | Boundaries, points or routes from a file you upload or a link: GeoJSON, TopoJSON, KML, KMZ, CSV with coordinates, a WFS service or a PMTiles archive. | 5 | Link or upload |
| Tiles & imagery | Imagery or a tiled map drawn over the background: a {z}/{x}/{y} tile template, a WMTS service or a Cloud Optimized GeoTIFF. | 5 | Link |
| WMS | A layer from a Web Map Service, drawn as images. | 5 | Link |
| ArcGIS | A feature layer, map or imagery service, vector tiles or a whole web map from ArcGIS Online or Enterprise, drawn with its own styling. | 5 | Browse ArcGIS or paste a link |
| Icon Map Catalog | Countries, regions, postcodes, rail, flood zones and more from the Icon Map Catalog, with nothing to host. | 20, shared with catalog data layers | The catalog window |
| Weather | Live weather from OpenWeatherMap: clouds, precipitation, pressure, wind or temperature. | 1 | A few options |
| Traffic | Live traffic flow or incidents from Azure Maps, over the roads of the background map. | 1 | A few options |
| Map labels | Place and road names drawn above your data layers, so they stay readable. | 1 | A few options |
| Day and night | Shades the part of the world in darkness now, or at the time in your data. | 1 | A few options |
What the tiles tell you
- A type you can add more than once shows dots and a count, for example "2 of 5 used".
- A type you can add once (Weather, Traffic, Map labels, Day and night) shows no count. It reads "A few options", or shows an On badge and "Already on the map." when it is already on the map.
- A tile you cannot use is dimmed and gives the reason:
| Reason on the tile | When |
|---|---|
| "All 5 are in use." | Every slot of that type is taken. |
| "Already on the map." | The type can only be added once. |
| "This report uses the older single ArcGIS layer: set it up in the Format pane." | The report was built with the earlier, single ArcGIS reference layer. |
The Icon Map Catalog tile is not shown when Airgapped Environment is on. See Power BI Report Server (on-premises).
Data layer tiles
The picker is titled What kind of map are you making?. Each data layer needs certain fields in the visual. The tiles that already fit your fields are marked, with the number of rows they would draw. The Your data panel sits above the tiles: see Check your data.
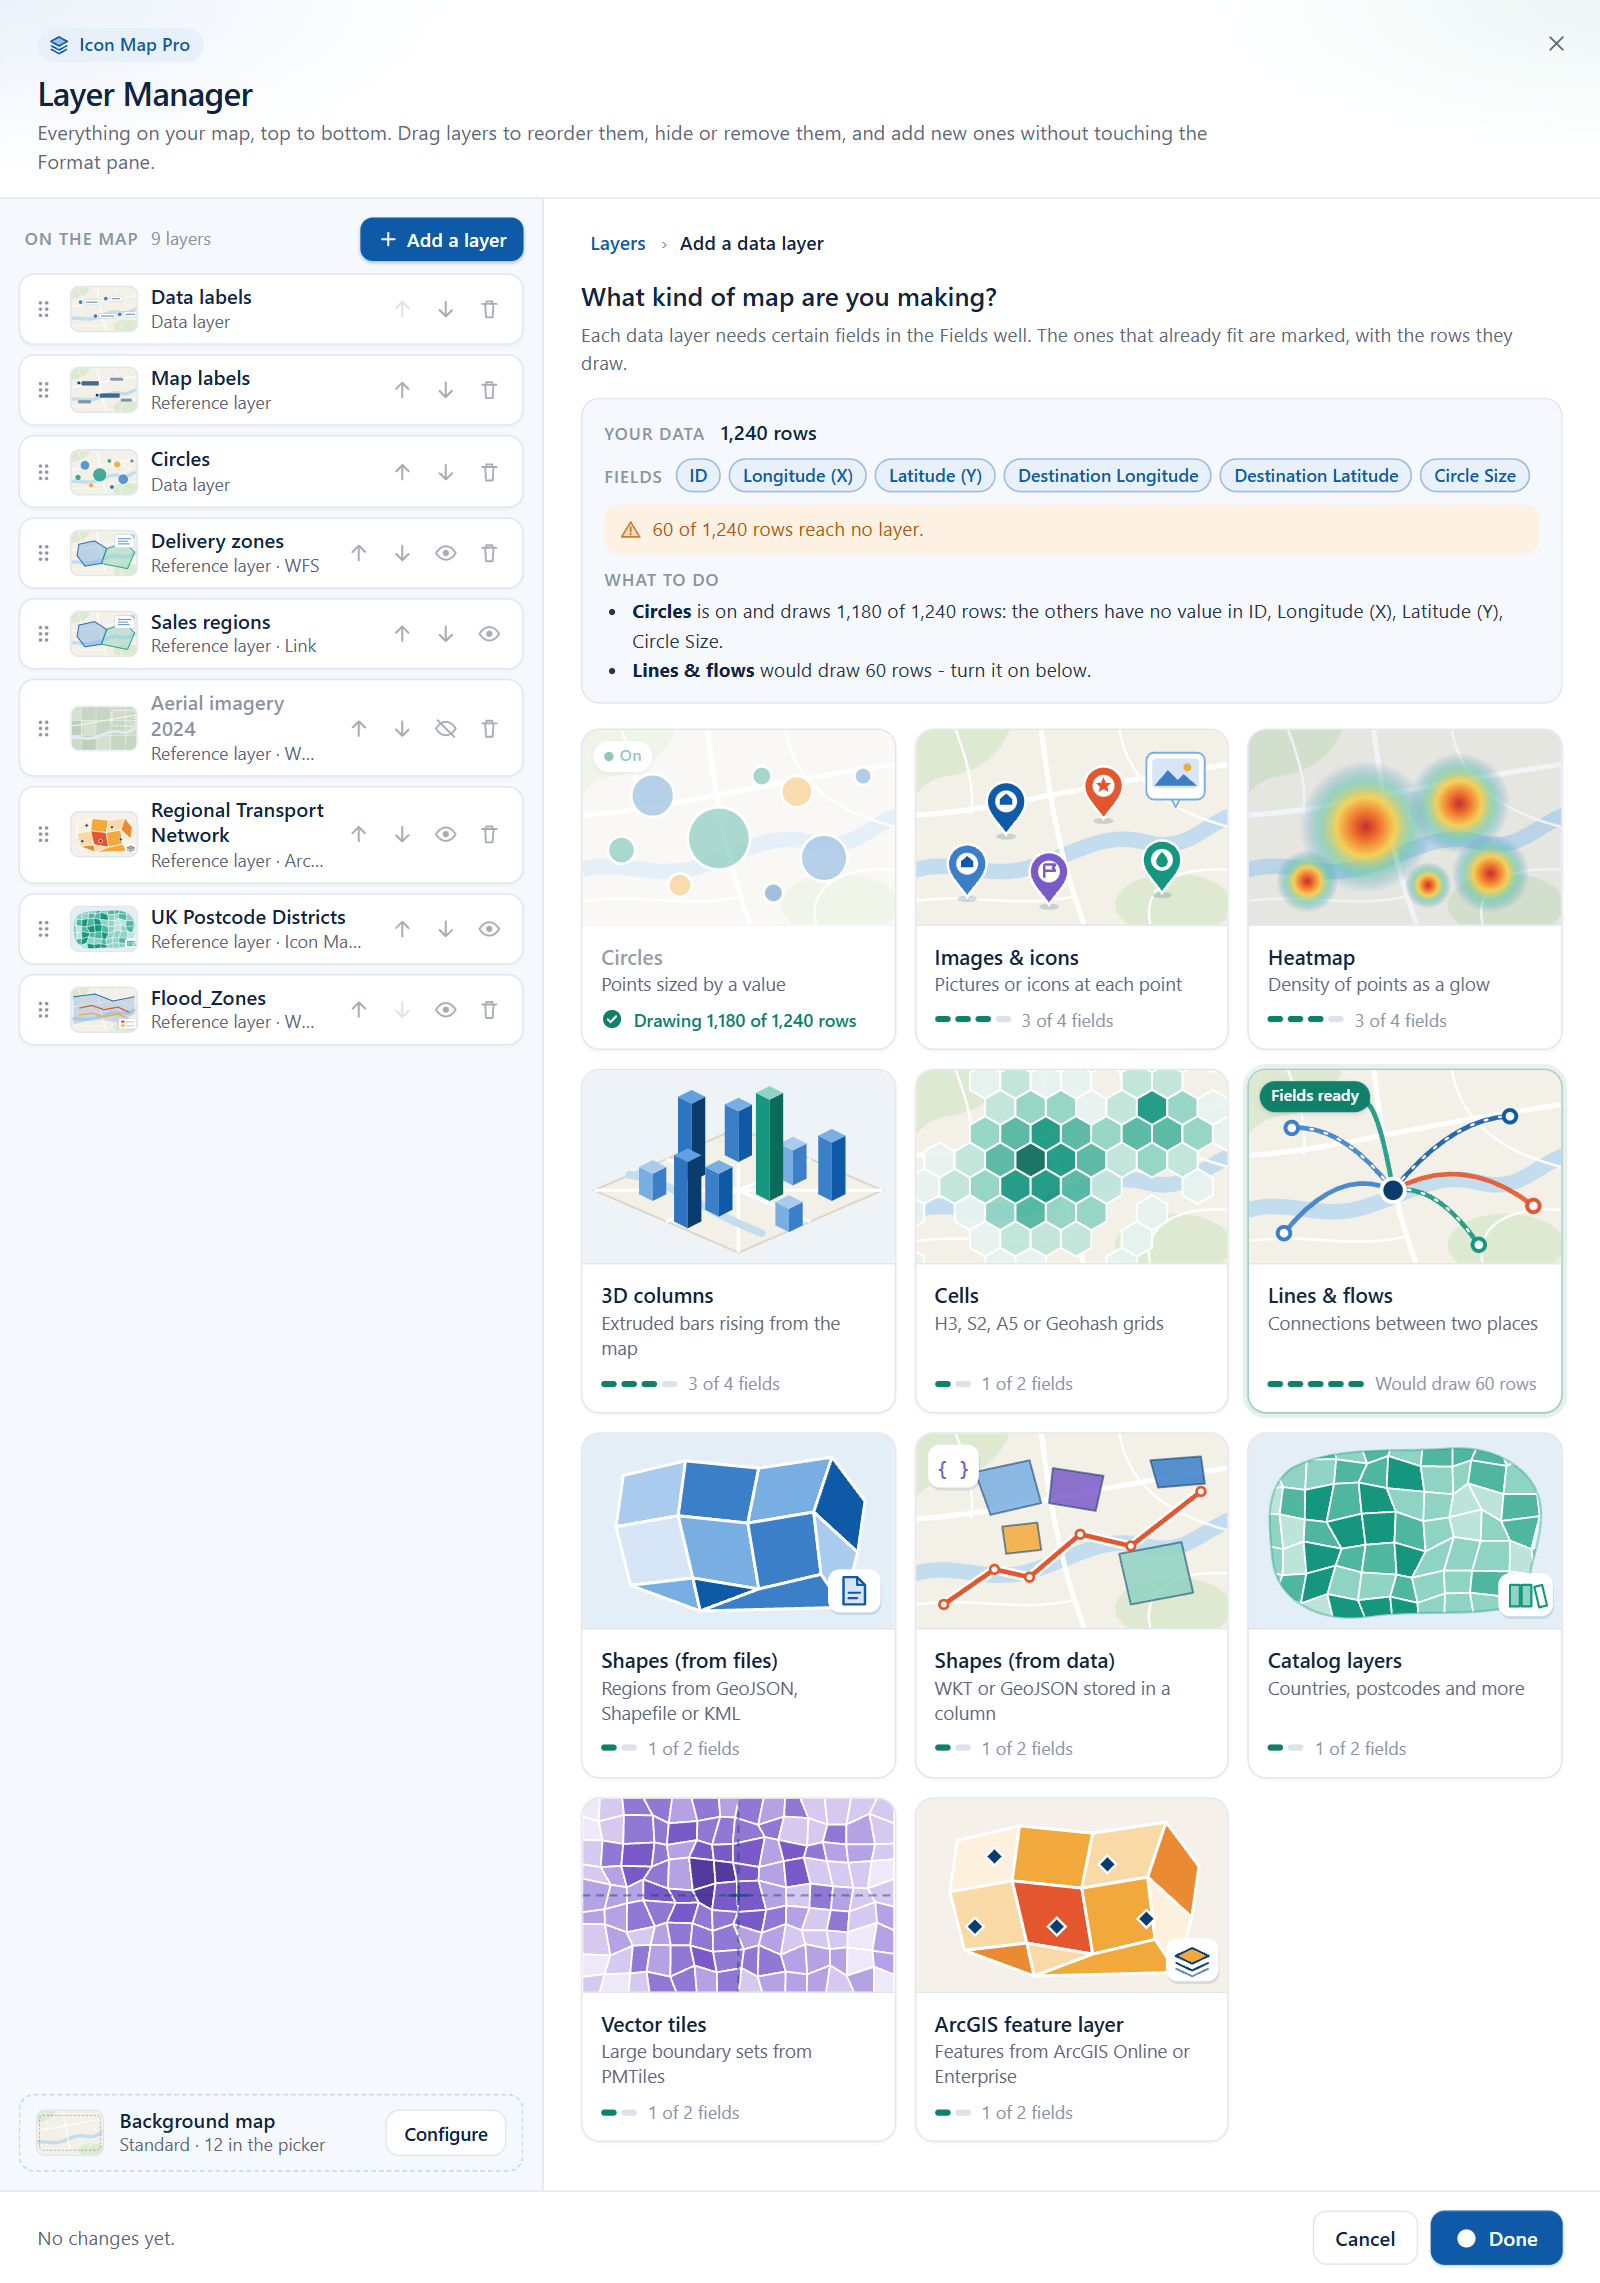
| Tile | What it draws | Fields it needs | How many |
|---|---|---|---|
| Circles | A circle at each location, sized and colored by your data. Nearby circles can be clustered. | ID, Longitude (X), Latitude (Y), Circle Size | 1 |
| Images & icons | An image or an icon at each location, from an image URL in your data, a custom URL or the icon library. | ID, Longitude (X), Latitude (Y), Image / WKT / GeoJSON (not needed when the image source is the icon library or a custom URL) | 1 |
| Heatmap | Where points concentrate, weighted by a value. Good for large numbers of locations. | ID, Longitude (X), Latitude (Y), Heatmap Weight | 1 |
| 3D columns | A 3D column at each location with its height set by your data. | ID, Longitude (X), Latitude (Y), Column Height | 1 |
| Cells | Points aggregated into a grid of H3, S2, A5 or Geohash cells, or cells drawn from their IDs. | Points: ID, Longitude (X), Latitude (Y), Cell Weight. Cell IDs: ID (the cell ID), Cell Weight | 1 |
| Lines & flows | Straight lines, great-circle arcs or flows from an origin to a destination. | ID, Longitude (X), Latitude (Y), Destination Longitude, Destination Latitude | 1 |
| Shapes (from files) | Boundaries from a file, colored by joining each shape to a row of your data. | ID, Feature Reference | 5 |
| Shapes (from data) | Polygons and lines whose geometry is held in your dataset as WKT or GeoJSON text. | ID, Image / WKT / GeoJSON | 1 |
| Catalog layers | Ready-made boundaries from the Icon Map Catalog, matched to your data. | ID, Feature Reference | 20, shared with catalog reference layers |
| Vector tiles | Features in vector tiles or PMTiles joined to your data, for very detailed or very many boundaries. | ID, Feature Reference | 5 |
| ArcGIS feature layer | The features of an ArcGIS feature layer joined to your data and styled with your values. | ID, Feature Reference | 5 |
"Cell Weight" is the field the Build pane calls Cell (H3/S2/A5/Geohash) Weight. For every field, see the Fields reference.
Badges and status on data tiles
| On the tile | Meaning |
|---|---|
| Fields ready | Every field the layer needs is in the visual. |
| On | The layer is already on the map. |
| "Would draw 1,240 rows" | The layer is off, and this many rows fit it. |
| "All fields ready" or "2 of 4 fields" | The layer is off. A dot per field shows how many of its fields you have added. |
| "Drawing all 1,240 rows" or "Drawing 1,180 of 1,240 rows" | The layer is on and drawing. |
| "On, but needs ..." or "On, but no rows reach it" | The layer is on but draws nothing. Open the layer from the list to see why. |
A dimmed tile gives its reason, as for reference layers. Two reasons are specific to data layers:
| Reason on the tile | When |
|---|---|
| "This report uses the older Shapes layer: set it up in the Format pane." | The report was built with the earlier, single Shapes layer. |
| "This report uses the older vector tile layer: set it up in the Format pane." | The report was built with the earlier vector tile layer. |
The Catalog layers tile is not shown when Airgapped Environment is on.
Steps for each layer type
Layers with options only
Weather, Traffic, Map labels, Day and night, Circles, Images & icons, Heatmap, 3D columns, Cells, Lines & flows and Shapes (from data) have two steps.
- Style and options - the same fields as the layer's editor. Change what you want, or leave the defaults. The fields are listed in Edit, reorder and remove layers.
- Add it - select Add to map.
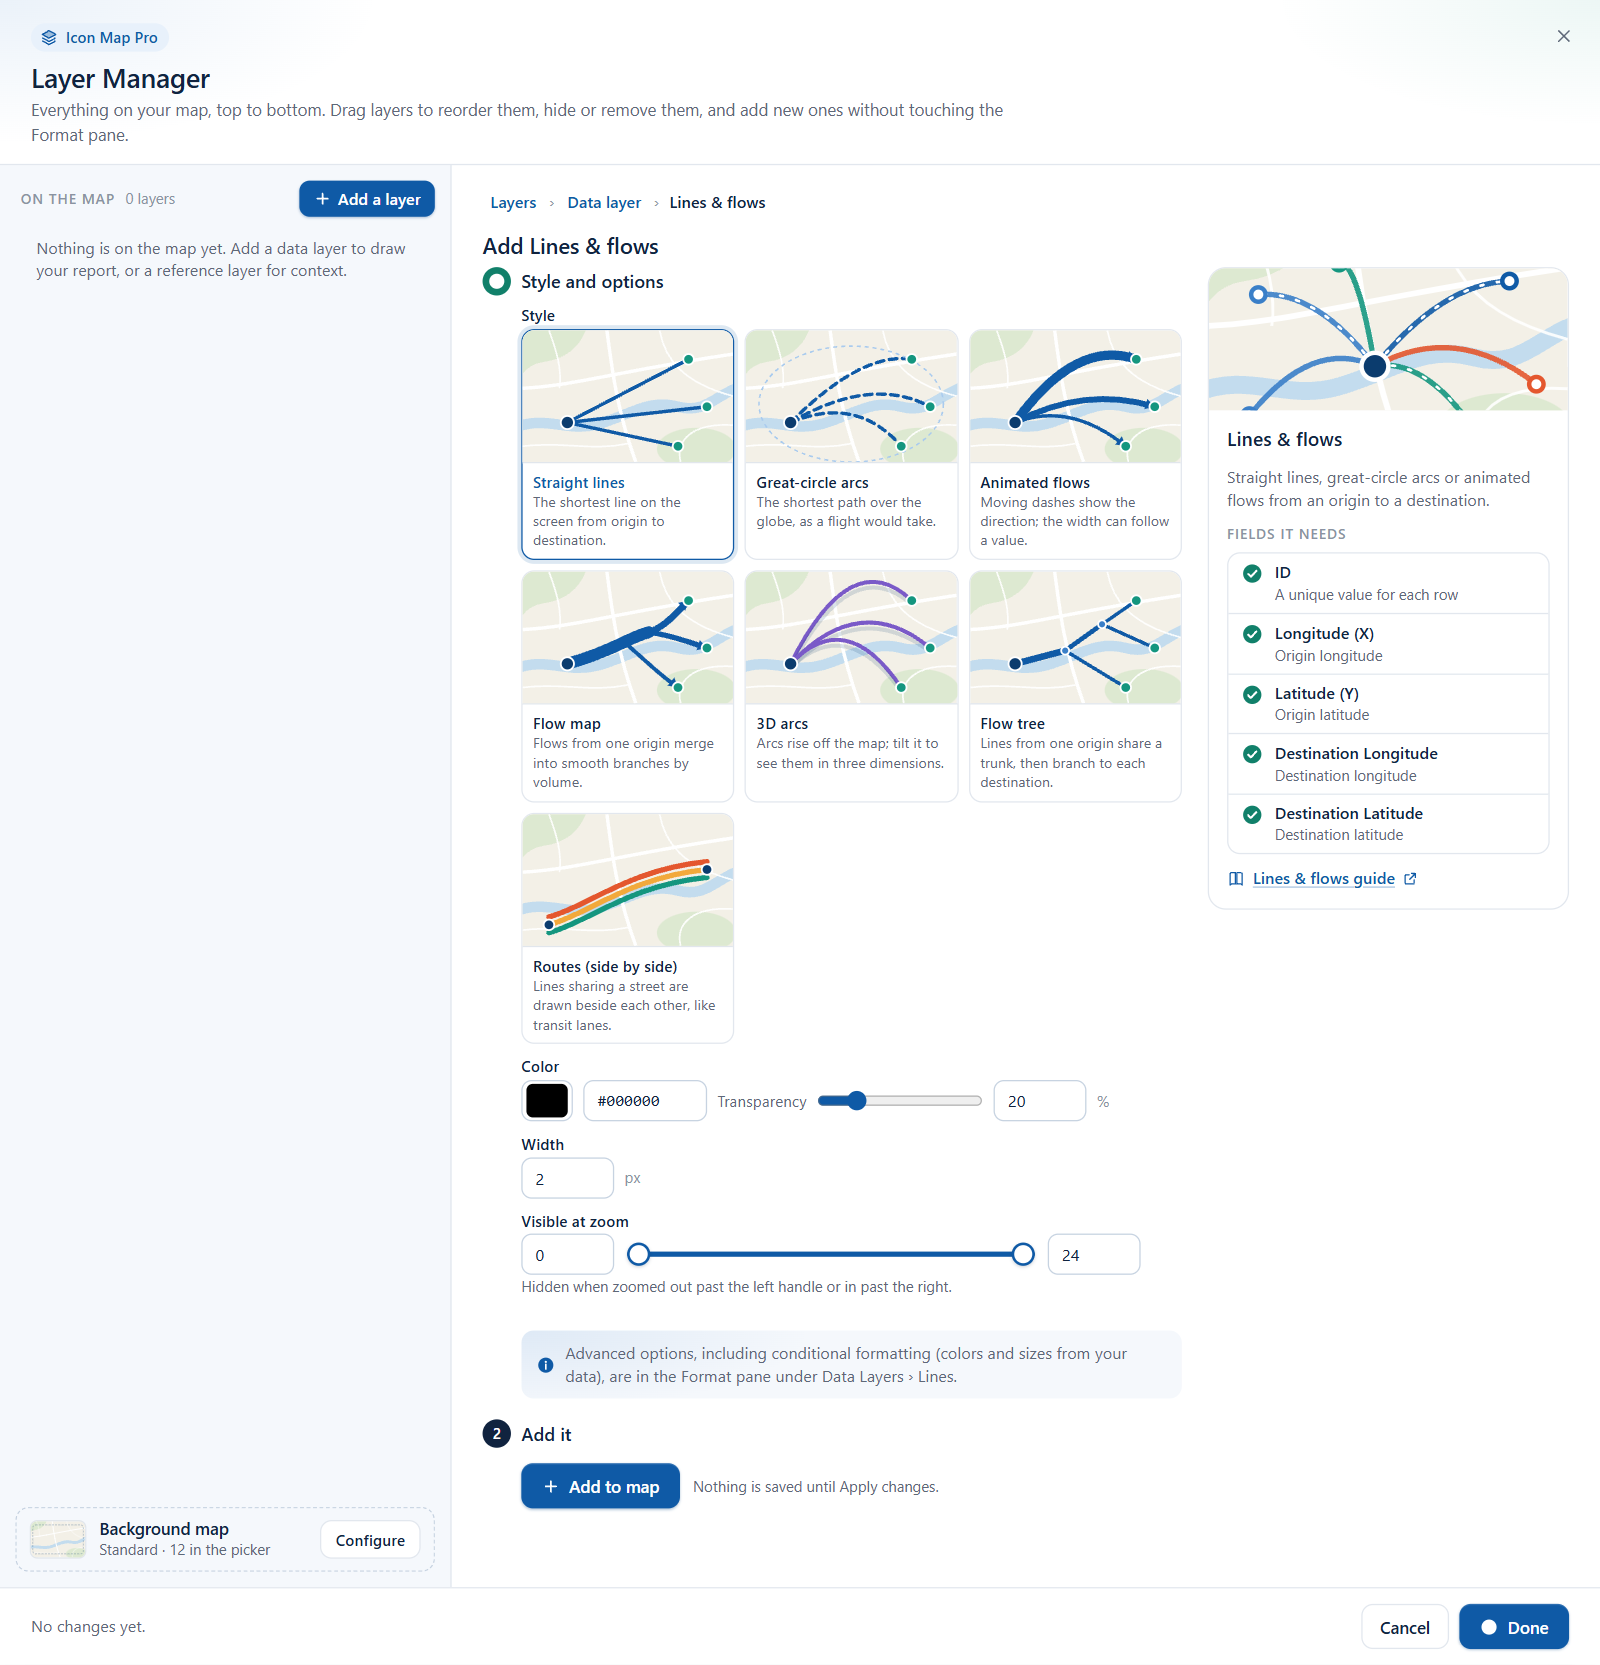
Weather needs your own OpenWeatherMap API key and Traffic needs your own Azure Maps key. Enter the key in the API key section of the step. It is saved with your other keys: see API keys, authentication and the proxy.
Files & feeds
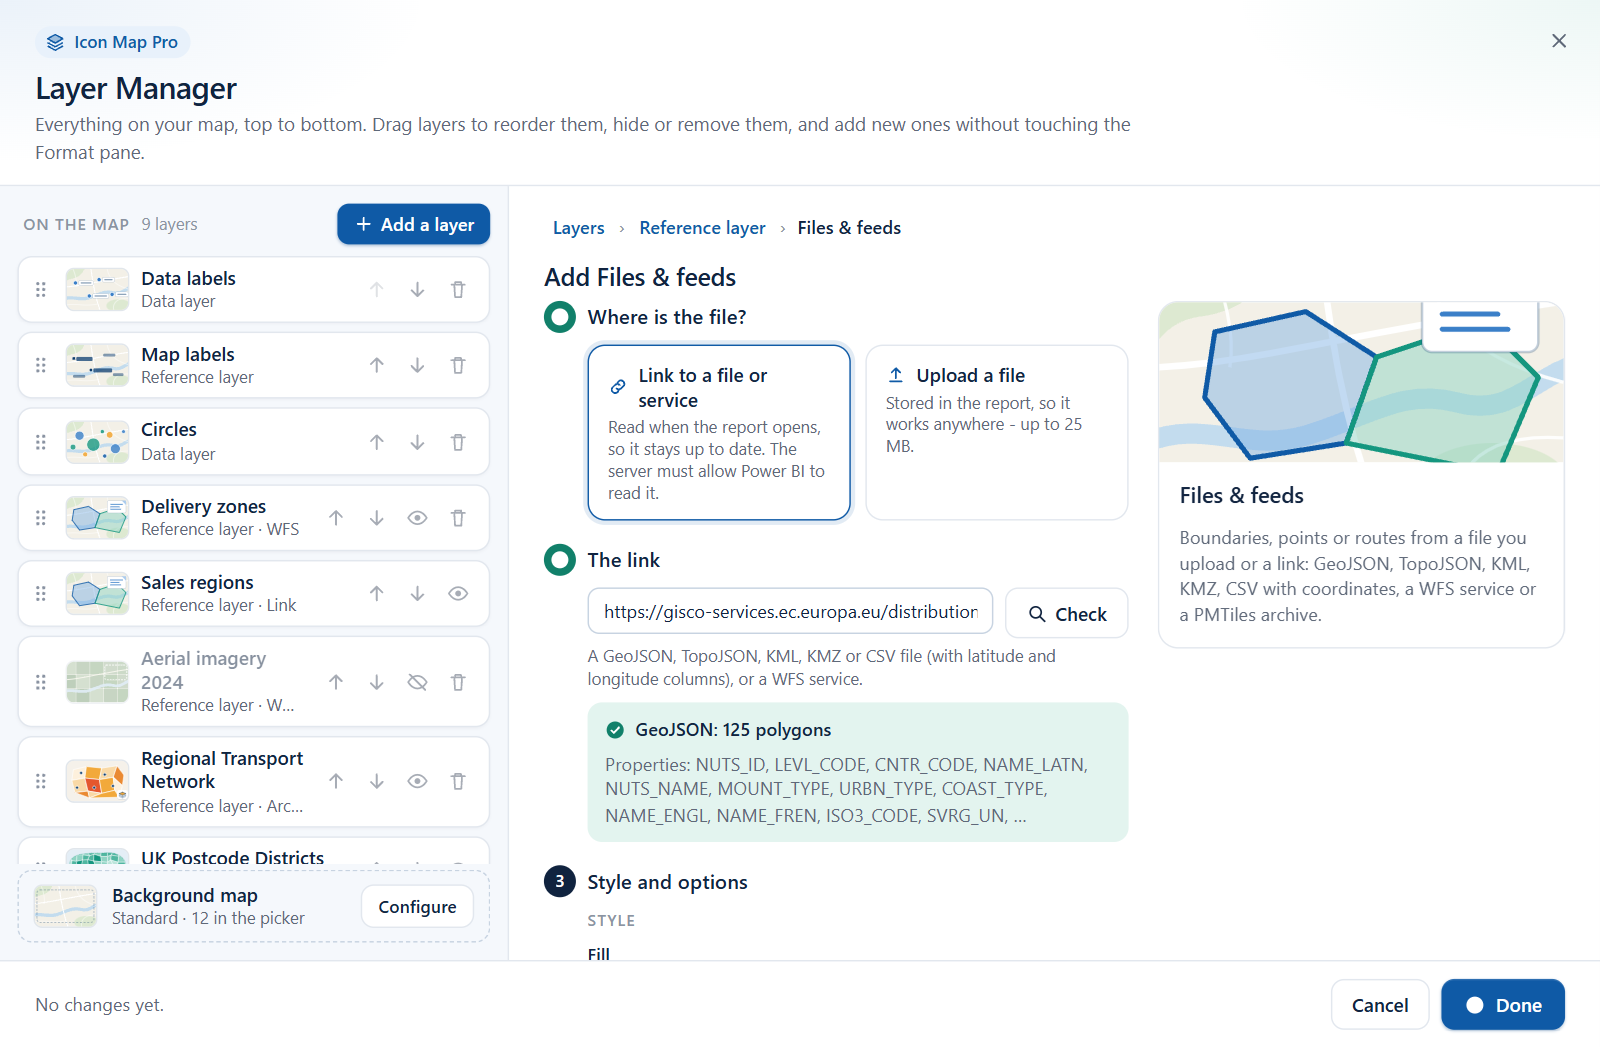
- Where is the file? - choose one:
- Link to a file or service - read when the report opens, so it stays up to date. The server must allow Power BI to read it.
- Upload a file - stored in the report, so it works anywhere. Up to 25 MB.
If you chose a link, these steps follow:
- The link - paste the address of a GeoJSON, TopoJSON, KML, KMZ or CSV file (with latitude and longitude columns), or a WFS service, and select Check.
- Details - only when the link needs it, for a WFS service that offers more than one feature type: choose the Feature type to draw. For a plain GeoJSON link there is no Details step.
- Style and options - fill, outline, points, labels, tooltips and zoom range.
- Add it - select Add to map. The button is available once the check has passed, or passed with a warning.
If you chose an upload, these steps follow:
- Style and options - as above.
- Upload - select Choose a file. The file upload window opens for a GeoJSON file, a zipped Shapefile, a KML file or a PMTiles archive. The Layer Manager closes while you upload and comes back when the upload is done.
See Files and feeds: GeoJSON, KML, CSV, WFS.
Tiles & imagery
- The link - paste a {z}/{x}/{y} tile template, a WMTS service link (its GetCapabilities URL) or the link to a Cloud Optimized GeoTIFF, and select Check.
- Details - shown for a GeoTIFF link, to confirm that it is drawn as a Cloud Optimized GeoTIFF.
- Style and options - visibility, transparency and zoom range.
- Add it - select Add to map.
See Raster tiles, WMTS and WMS.
WMS
- The link - paste the WMS service address and select Check. The dialog reads the list of layers from the service.
- Details - when the service offers more than one layer, choose the Layer to draw. One WMS layer on the map draws one layer of the service.
- Style and options - visibility, transparency and zoom range.
- Add it - select Add to map.
Authentication, styles, filters and custom parameters for a WMS service are set in the Format pane. See Raster tiles, WMTS and WMS.
ArcGIS
- Where is the layer? - choose one:
- Browse ArcGIS - search your content, your organization, Living Atlas and public items, with a preview.
- Paste a link - an item page, item id, service or layer URL.
If you chose Browse ArcGIS:
- Choose it in ArcGIS - select Browse ArcGIS. The Browse ArcGIS window opens; the Layer Manager comes back when you have chosen a layer.
If you chose Paste a link:
- The link - paste the link. There is no check for ArcGIS links.
- Style and options - visibility, transparency, zoom range and the ArcGIS symbology, label and pop-up options.
- Add it - select Add to map.
See ArcGIS layers and Connect to ArcGIS.
Icon Map Catalog and Catalog layers
One step: Pick a layer from the catalog. Select Open the Icon Map Catalog. The catalog window opens ready to add a layer and closes as soon as you have added one; then the Layer Manager comes back.
- From the Icon Map Catalog reference tile, browse and add a layer for context.
- From the Catalog layers data tile, choose a boundary layer and bind it to a field of your data.
Shapes (from files)
- Where is the file? - Link to a file or service or Upload a file (up to 25 MB), as for Files & feeds.
If you chose a link:
- The link - paste the address of the file and select Check.
- Details - choose the Property to match your data: the property of each shape that holds the value in your Feature Reference field. The dialog lists the properties it found and picks one named code, id, name, key, ref, postcode, iso or fips if there is one. Any property (slower) tries every property.
- Style and options - fill, outline, visibility, zoom range and tooltip.
- Add it - select Add to map.
If you chose an upload:
- Style and options - as above.
- Upload - select Choose a file. You pick the property that matches your data as you upload.
When you add a second Shapes (from files) layer, the two are drawn side by side, unless the report already uses the layers as drill-down levels. See Shapes from files.
Vector tiles
- The link - paste a {z}/{x}/{y} vector tile template, a TileJSON link or the link to a PMTiles archive, and select Check. This check looks at the shape of the link only; it does not contact the server.
- Style and options - fill, outline, visibility and zoom range.
- Add it - select Add to map.
After adding, open the layer's editor to enter the Source layer and the Property to match your data if the map does not find them. See Vector tiles.
ArcGIS feature layer
- Where is the layer? - Browse ArcGIS.
- Choose it in ArcGIS - select Browse ArcGIS, then choose the layer and the attribute to join on in the Browse ArcGIS window.
See ArcGIS layers bound to data.
Link checks
Check reads the link before the layer is added, so you find out now whether the map will be able to draw it. You can also press Enter in the link box. While it works, the step shows "Reading the link...".
A link must start with https://. Otherwise the check reports "The link must start with https://" and the layer cannot be added.
Files & feeds and Shapes (from files)
The check reads up to 500 features. For a WFS service it lists the feature types and reads the first one.
| Result | Meaning |
|---|---|
| "GeoJSON: 1,204 polygons" (or TopoJSON, KML, KMZ, CSV, WFS; points, lines or polygons) | The link was read. Below it: "Properties:" and the first 12 property names, or "The features have no properties." |
| "WFS: 500 or more polygons" | The service holds at least the 500 features the check reads. |
| "... read, but it holds no features" | Warning. The layer is added, but nothing draws until the file has features. |
| "The WFS service lists no feature type" | The service cannot be used. |
Tiles & imagery
| Result | Meaning |
|---|---|
| "A GeoTIFF" | A link ending .tif or .tiff. It is drawn as a Cloud Optimized GeoTIFF. |
| "WMTS service: layer ..." | The service was read. Its attribution is shown when it has one. |
| "Tile template: a test tile loaded" | A test tile was read from the template. |
| "Tile template (the test tile answered ...)" | Warning. The layer is added; check that the map draws it. |
| "Tile template" with "The test tile could not be read from here ..." | Warning. This is common for tile servers; the map may still draw it. |
| "This WMTS layer is not in the Web Mercator tile scheme (GoogleMapsCompatible / EPSG:3857)" | The service cannot be drawn. |
| "Not a tile template, WMTS link or GeoTIFF" | A tile template needs {z}, {x} and {y}, for example https://tile.example.com/{z}/{x}/{y}.png. |
WMS
| Result | Meaning |
|---|---|
| "WMS service: 1 layer" or "WMS service: 12 layers" | The service was read. Choose the layer in the Details step. |
| "The service answered ..." | The service returned an error status. |
| "No layers found in the service" | The link should be a WMS service address. |
Vector tiles
| Result | Meaning |
|---|---|
| "A PMTiles archive" | A link ending .pmtiles. |
| "Vector tiles" | A link with {z} in it, or a link ending .json. |
| "This does not look like a vector tile link" | Warning. The layer is added anyway. |
When the server blocks the request
| Result | Meaning |
|---|---|
| "This server does not allow Power BI to read it" | The server's CORS rules block the request. Ask its owner to allow Power BI, or select the check box Read it through the Icon Map CORS proxy (only for servers you trust). The result changes to "Will be read through the Icon Map CORS proxy" and the layer can be added. |
| "The link could not be read" | Another failure. The error message is shown below. |
The proxy check box applies to file and tile links. For what the proxy is and what it sends, see API keys, authentication and the proxy.
What a new layer is called
The layer's name in the list comes from what the check found (the WFS feature type, the WMS layer or the WMTS layer), then from the link or the uploaded file's name. There is no rename.
Windows that open on the way
Power BI shows one dialog at a time. Four steps open another window, and the Layer Manager closes while it is open.
| Button | Window | When you return, the footer reads |
|---|---|---|
| Browse ArcGIS | Browse ArcGIS | "The ArcGIS layer is on the map and saved." |
| Open the Icon Map Catalog | The Icon Map Catalog | "The catalog layer is on the map and saved." |
| Choose a file | The file upload window | "The uploaded file is on the map and saved." |
| Configure on the Basemap row, or Choose basemaps | The Basemaps dialog | "The basemaps are saved." |
What happens:
- The Layer Manager saves every change you have made so far, as if you had selected Apply changes.
- The other window opens.
- When it closes, the Layer Manager reopens on its home view. Layers you added keep their New badge.
Because your changes are saved before the other window opens, Cancel afterwards does not undo them. If you close Browse ArcGIS or the file upload window without choosing anything, the layer you started is still on the list with nothing in it. Remove it with the bin button on its row.
Tips and limits
- Links must start with
https://. - An uploaded file is stored in the report. A linked file is read each time the report opens.
- The types you can add several of have five slots each. Catalog layers share 20 slots between reference and data layers.
- Vector style and Hillshade layers are not added here. If the map already has one, it is listed and can be edited.
- Data labels are not a tile. Switch them on in Format pane > Labels; they then appear in the list. See Data labels.
- To take colors or sizes from your data, add the layer here, then set conditional formatting (fx) in the Format pane. See Conditional formatting.