
Vector tiles
The Vector Tiles layer joins your data to shapes that are served as vector tiles, from a tile server or a hosted PMTiles archive. The map only loads the tiles for the area and zoom level on screen, so this is the layer to use when a boundary set is too large or too detailed to upload as a file.
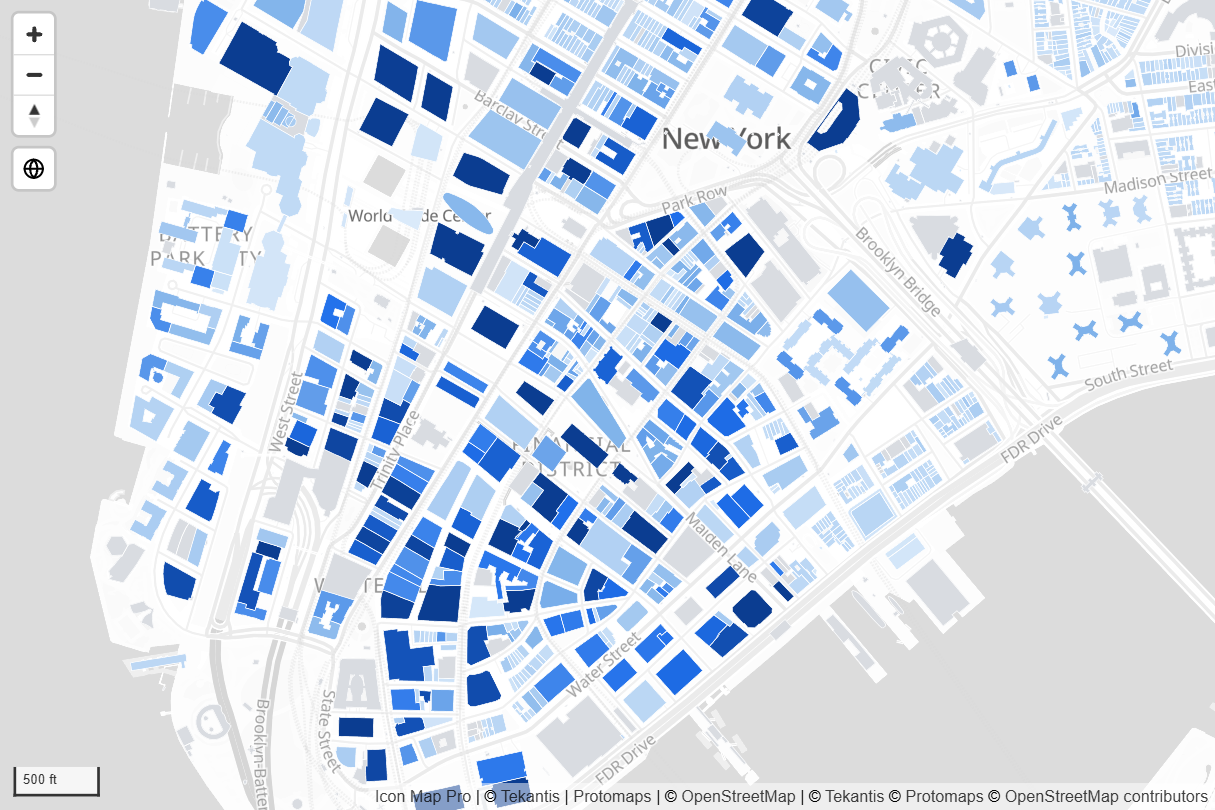
What you need
Add these fields to the visual:
| Field well | What to put in it |
|---|---|
| ID | A unique value for each row. |
| Feature Reference | The value that identifies the feature in the tiles, for example a postal code. |
These fields must be empty on the row, otherwise the row belongs to another layer: Image / WKT / GeoJSON, Circle Size, Heatmap Weight and Cell (H3/S2/A5/Geohash) Weight. See Combine several layers in one map.
You also need:
- The address of the tiles: a tile template with
{z},{x}and{y}, or a link to a.pmtilesarchive. - The name of the layer inside the tiles, and the name of the property that holds your key. The publisher of the tiles can tell you both.
Add the layer
- Add ID and Feature Reference to the visual.
- In the Format pane, open Layer Manager and turn on Open Layer Manager.
- Select Add a layer, then Data layer, then the Vector tiles tile.
- Paste the link and select Check. The link must start with
https://. A link that ends in.pmtilesis set up as a PMTiles archive. - Set the fill and outline in Style and options, select Add to map, then Apply changes.
- Select the new row in the Layer Manager. Under Source, enter the Source layer and the Property to match your data.
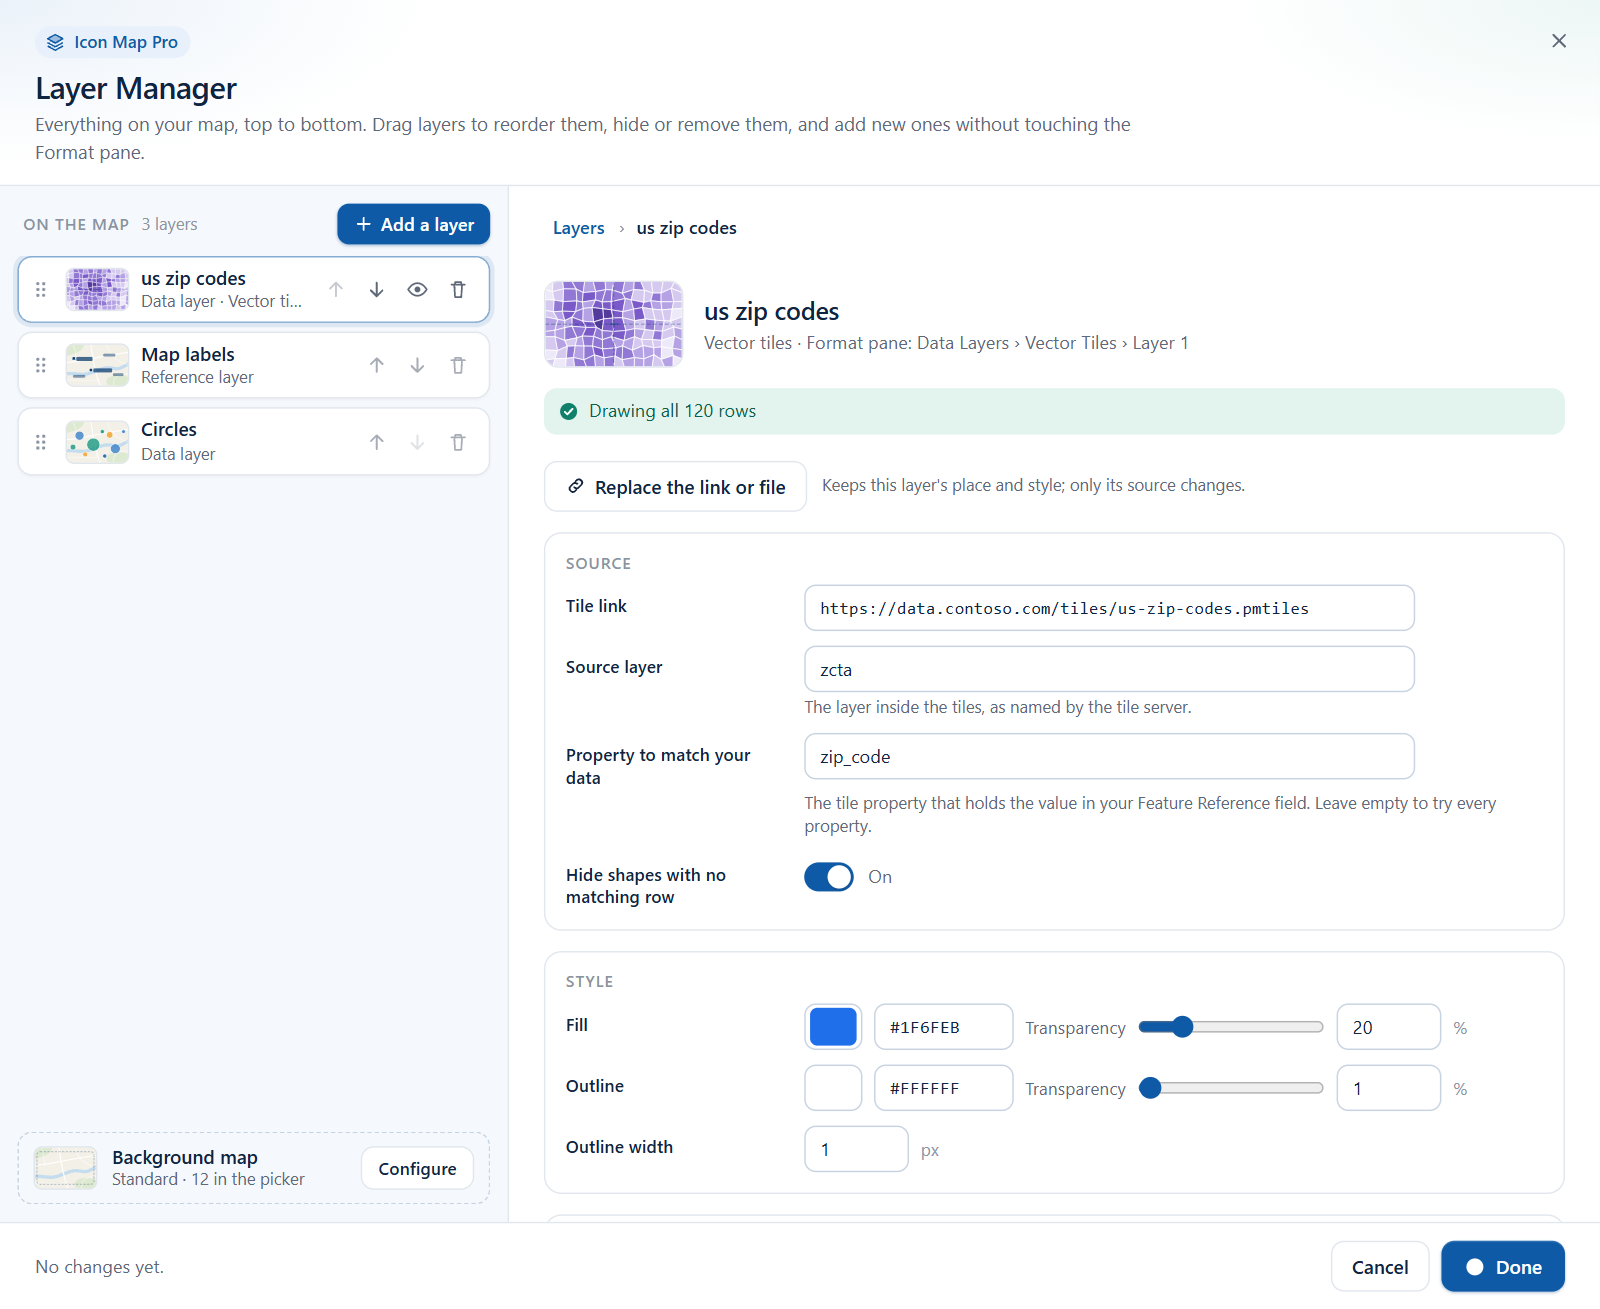
The check looks at the shape of the link only. It does not read the tiles, so the source layer and property are yours to enter. To color each feature from your data, select the fx button next to Format pane > Data Layers > Vector Tiles - Formatting > Fill Color. See Add a layer.
Tile sources
| Source | What to enter | Also set |
|---|---|---|
| A vector tile server | A tile template such as https://example.com/tiles/{z}/{x}/{y}.pbf. The tiles must be Mapbox Vector Tiles. |
|
| A hosted PMTiles archive | The link to the .pmtiles file. |
Vector Tiles - Setup > Use PMTiles |
| An ArcGIS vector tile service | The link to the VectorTileServer. |
Source is ArcGIS |
Use PMTiles is one switch for the whole Vector Tiles layer. Every level or layer must then be a PMTiles archive.
Source is ArcGIS sends your ArcGIS credential with the tile requests. It is available when the ArcGIS Authentication Type is OAuth2 (Client ID & Secret) or Username & Password. See Connect to ArcGIS.
To join data to an ArcGIS vector tile service when you use Sign in with ArcGIS or an API key, use the ArcGIS layer instead. It accepts vector tile services directly.
A PMTiles archive up to 25 MB can also be uploaded into the report with the Shapes from files layer, so that no hosting is needed.
How the join works
Each feature in a tile has properties. The layer compares your Feature Reference value with a property of each feature, as text. Where they are the same, the feature takes that row's formatting and tooltips and can be selected. Features with no matching row are unmatched.
- Turn on Match a Specific Tile Property and enter the Property to Match. This is the recommended setup. It is faster, and the match does not depend on the order of the properties in the tiles. The property name is case sensitive.
- With Match a Specific Tile Property off, every property of every feature is checked, which is slower.
- If several rows have the same Feature Reference value, the first row is used.
Layer Name(s) names the layer inside the tiles to draw. To use more than one, separate the names with commas and no spaces, for example districts,wards. Layer names are case sensitive. If the tiles hold more than one layer, always name the one you want.
Zooming to your data
Tiles do not tell the map where your matched features are until they are loaded, so the map needs help to zoom to them. There are two ways:
- Add Longitude (X) and Latitude (Y) for each row. The map uses them to zoom and to place data labels.
- Turn on Vector Tiles - Setup > Auto Detect Bounds. The map reads tiles in advance to find where each feature is.
How Auto Detect Bounds reads the tiles depends on the source:
- For a tile server, it requests every tile at the Zoom Level used to Detect Bounds. Choose a level at which your features exist. Higher levels mean many more tiles.
- For a PMTiles archive, it reads the tiles within the archive's extent, up to the Auto Detect Max Zoom Limit.
At most 4,096 tiles are read. If more would be needed, a lower zoom level is used.
Drill down and several layers
The layer can hold up to five tile sources. Display multiple layers as in Vector Tiles - Setup decides how they are used:
- Drill-down - one source is drawn at a time, following Power BI's drill level. Put a hierarchy in ID, set Number of Drill-down Levels, and give each level its own link, layer name, property and formatting. Level 1 is drawn at the top of the hierarchy, level 2 after drilling once, and so on. For Feature Reference, add one field used at every level, or one field for each level in the order of the hierarchy.
- Multiple Layers - all the sources are drawn together, each with its own settings and Z-Index.
Choose the level or layer to edit in Apply settings to:. Every level needs its own link.
Formatting
Matched features are formatted in Vector Tiles - Formatting. Fill Color, Outline Color, the transparencies, Outline Width, Circle Radius and Extrusion Height accept conditional formatting, so each feature can be styled from its row.
- Polygons are drawn with a fill and an outline, lines with the outline settings, and points as circles of Circle Radius.
- Line Format Type set to Based On Zoom changes the outline width with the zoom level, from Start Outline Width at Start Zoom Level to End Outline Width at End Zoom Level. Use it to keep outlines thin when zoomed out and visible when zoomed in. In this mode the width is the same for every feature.
- Extrusion Height raises a matched polygon into a 3D block. Tilt the map to see it.
Unmatched features use Vector Tiles - Unmatched Formatting, gray by default. Turn on Remove Unmatched Shapes to hide them. This is useful when the tiles cover a much larger area than your data.
Selection, tooltips and labels
- Click a matched feature to select its row and cross-filter the rest of the report. Unmatched features cannot be selected. See Selection, cross-filtering and highlighting.
- Pointing at a matched feature shows the fields in Tooltips.
- Add Tooltips to Unmatched Shapes shows the tile's own properties on unmatched features.
- Data labels need a position for each row, from Longitude (X) and Latitude (Y) or from Auto Detect Bounds. See Data labels.
Settings
All settings are in Format pane > Data Layers. With more than one level or layer, the group titles include its number. Settings marked fx accept conditional formatting.
Vector Tiles - Setup
| Setting | What it does | Default |
|---|---|---|
| Use PMTiles | Reads the links as PMTiles archives. | Off |
| Auto Detect Bounds | Reads tiles in advance to find your features, for auto zoom and labels. | Off |
| Zoom Level used to Detect Bounds | The zoom level whose tiles are read. Shown for tile servers. | 5 |
| Auto Detect Max Zoom Limit | The highest zoom level read. Shown for PMTiles. | 7 |
| Display multiple layers as | Drill-down or Multiple Layers. | Drill-down |
| Number of Drill-down Levels / Number of Layers | How many sources, 1 to 5. | 1 |
| Apply settings to: | The level or layer that the groups below edit. | 1 |
Vector Tiles - Configuration
| Setting | What it does | Default |
|---|---|---|
| Vector Tile XYZ URL | The tile template or PMTiles link. fx | Empty |
| Source is ArcGIS | Sends your ArcGIS credential with the requests. | Off |
| Match a Specific Tile Property | Compares one named property instead of every property. | Off |
| Property to Match | The property that holds your key. fx | Empty |
| Remove Unmatched Shapes | Hides features with no matching row. | Off |
| Add Tooltips to Unmatched Shapes | Shows the tile's properties on unmatched features. | Off |
| Include Tooltip | Shows tooltips on matched features. fx | Yes |
| Include in Auto Zoom | Includes matched features when the map zooms to fit your data. fx | Yes |
| Selectable | Lets report users select features. fx | Yes |
| Layer Name(s) | The layer or layers inside the tiles to draw, separated by commas. | Empty |
| Max Zoom Level | The layer is hidden when the map is zoomed in past this level. | 24 |
| Min Zoom Level | The layer is hidden when the map is zoomed out past this level. | 0 |
| Z-Index | Position in the drawing order. Layers with a higher value draw on top. | 450 |
Vector Tiles - Formatting
| Setting | What it does | Default |
|---|---|---|
| Fill Color | Fill color of matched features. fx | Theme color |
| Outline Color | Outline and line color. fx | Theme color |
| Fill Transparency | 0 is solid, 100 is invisible. fx | 1 |
| Outline Transparency | 0 is solid, 100 is invisible. fx | 1 |
| Line Format Type | Static or Based On Zoom. | Static |
| Outline Width | Width in pixels. Shown for Static. fx | 1 |
| Start Outline Width, Start Zoom Level | The width at the lower zoom level. Shown for Based On Zoom. | 1, 1 |
| End Outline Width, End Zoom Level | The width at the higher zoom level. Shown for Based On Zoom. | 1, 24 |
| Circle Radius | The size of circles in pixels when the tiles include points. fx | 2 |
| Extrusion Height | Height to extrude polygons, 0 to 1000. fx | 0 |
Vector Tiles - Unmatched Formatting
| Setting | What it does | Default |
|---|---|---|
| Unmatched Fill Color | Fill color of unmatched features. | #CCCCCC |
| Unmatched Outline Color | Outline color of unmatched features. | #555555 |
| Unmatched Fill Transparency | 0 is solid, 100 is invisible. | 1 |
| Unmatched Outline Transparency | 0 is solid, 100 is invisible. | 1 |
| Unmatched Line Format Type | Static or Based On Zoom. | Static |
| Unmatched Outline Width | Width in pixels. Shown for Static. | 1 |
| Unmatched Start Outline Width, Unmatched Start Zoom Level | The width at the lower zoom level. | 1, 1 |
| Unmatched End Outline Width, Unmatched End Zoom Level | The width at the higher zoom level. | 1, 24 |
| Unmatched Circle Radius | The size of unmatched circles in pixels. | 2 |
In the Layer Manager
Each tile source is a row in the Layer Manager. Select the row to change:
- Source - Tile link, Source layer, Property to match your data and Hide shapes with no matching row. Replace the link or file swaps the link and keeps the layer's place and style.
- Style - Fill, Outline and Outline width.
- On the map - Visible at zoom.
Only the last source can be removed with the bin button. See Edit, reorder and remove layers.
Tips and limits
- Nothing is colored. Check Layer Name(s) and Property to Match against the tiles. Both are case sensitive. Then check that your Feature Reference values are written the same way as the property, including leading zeros.
- The map does not zoom to the data. Add coordinates for each row or turn on Auto Detect Bounds.
- A PMTiles archive can be zoomed in past its most detailed level. The map keeps drawing the most detailed tiles it has.
- Up to five tile sources.
- The Vector Tiles layer is not available when the basemap is a custom image.
- Dash patterns and the detail zoom settings are part of the Legacy engine, see the documentation for 1.1.0.9 and earlier.