
Heatmap
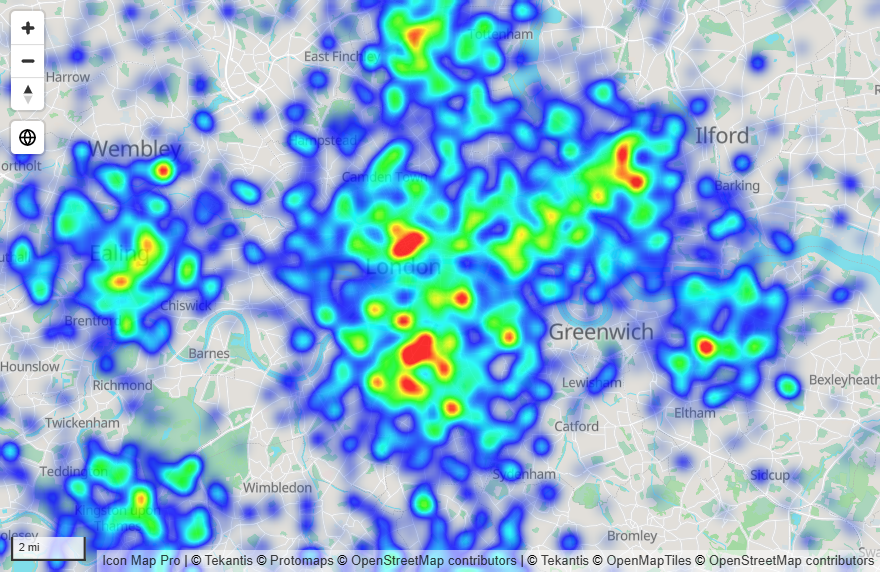
The Heatmap layer shows where points concentrate, as a glow that runs from cool to hot colors. Use it when you have many locations and the pattern matters more than the individual points.
What you need
| Field well | What to put in it |
|---|---|
| * ID (required) | A unique value for each row |
| Longitude (X) | Longitude in decimal degrees, summarized as Average |
| Latitude (Y) | Latitude in decimal degrees, summarized as Average |
| Heatmap Weight | A number that says how much each point counts |
Heatmap Weight is required: a row with no weight is not part of the heatmap. If every point should count the same, use a measure that returns the same number for every row. Read How the weight is used before choosing that number.
These fields must be empty on a heatmap's rows: Circle Size, Destination Longitude, Destination Latitude, Image / WKT / GeoJSON, Feature Reference and Cell (H3/S2/A5/Geohash) Weight.
A row with a value in Circle Size is a circle, not a heatmap point. If you started with circles, take the field out of Circle Size.
Add a heatmap to the map
- Add fields to * ID (required), Longitude (X) and Latitude (Y). Set the coordinates to Average.
- Add a number to Heatmap Weight.
- If the panel What kind of map are you making? is showing, select the Heatmap tile. It turns the layer on and opens the Layer Manager on it. Otherwise, in the Format pane expand Layer Manager, switch on Open Layer Manager, and select Add a layer, Data layer, Heatmap.
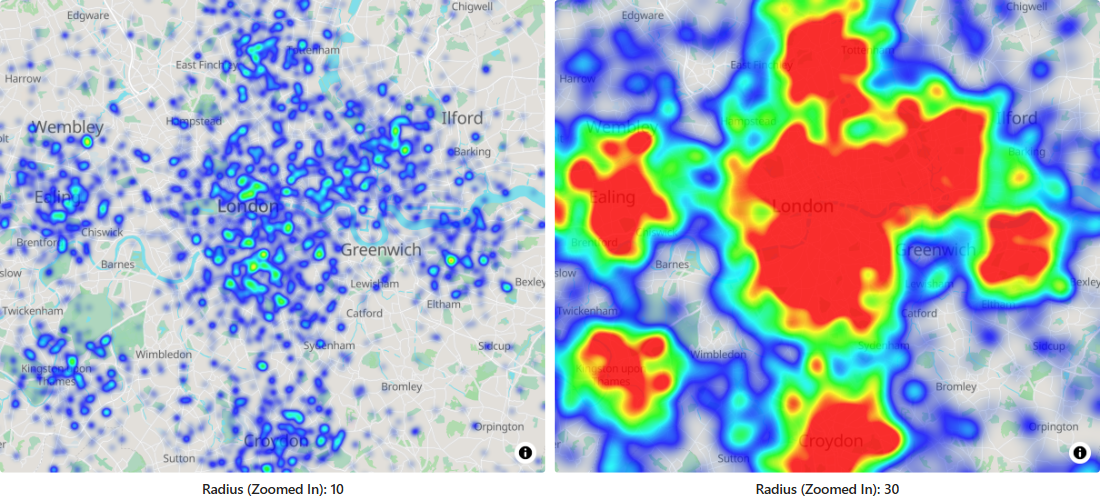
- Set the Radius: the left handle is the size of each point's glow when zoomed out, the right handle when zoomed in.
- If you are adding the layer, select Add to map. Then select Apply changes.
The Layer Manager offers Radius (the same as Radius (Zoomed Out) and Radius (Zoomed In) in the Format pane) and Visible at zoom (the same as Display Min Zoom and Display Max Zoom). Colors, transparency and the advanced settings are in Format pane > Data Layers.
How the heatmap is built
Each point adds a soft glow around its location. Where glows overlap they add up, and the total decides the color. Four things control the result:
| Control | Effect |
|---|---|
| Weight | How much one point adds. |
| Radius | How far each point's glow spreads, in pixels. A larger radius gives a smoother, more blended map. |
| Intensity | A multiplier on everything. Raise it when the map looks too faint, lower it when everything is the hottest color. |
| Colors | The colors used from the lowest to the highest density. |
Radius and intensity change with zoom. When you zoom out, points crowd together on screen, so a small radius and low intensity work best. When you zoom in, points spread apart, so a larger radius and higher intensity keep the heatmap visible. The visual blends between the zoomed out and zoomed in values as you zoom.
How the weight is used
The Heatmap Weight value of each point is converted to a contribution between 0 and 1, using the two settings in the Heatmap - Weight group:
- A weight at or below Zoomed Out At (default 0) adds nothing.
- A weight at or above Zoomed In At (default 6) adds the full amount.
- Weights in between are scaled evenly.
With the defaults, a weight of 3 counts half as much as a weight of 6, and every weight of 6 or more counts the same. Both settings accept 0 to 24. If your weights are larger than that, for example sales amounts, scale them in a measure so that the values you want to tell apart fall inside the range. A measure that returns 1 for every row gives a plain density map at the default settings.
To see these two settings, switch on Advanced Settings.
Settings
All of these are in Format pane > Data Layers, shown when the Heatmap switch is on.
Heatmap - Configuration
| Setting | What it does | Default | fx |
|---|---|---|---|
| Display Min Zoom | The heatmap is hidden when the map is zoomed out past this level. 0 to 24. | 0 | |
| Display Max Zoom | The heatmap is hidden when the map is zoomed in past this level. 0 to 24. | 24 | |
| Radius (Zoomed Out) | Radius of each point's glow in pixels when the map is zoomed out. 1 to 500. | 2 | |
| Radius (Zoomed In) | Radius of each point's glow in pixels when the map is zoomed in. 1 to 500. | 20 | |
| Advanced Settings | Shows the Heatmap - Weight, Heatmap - Radius and Heatmap - Intensity groups. | Off | |
| Include in Auto Zoom | Whether a point counts toward the area the map zooms to. | Yes | Yes |
| EPSG | Coordinate system of your longitude and latitude. | 4326 | |
| Z-Index | Drawing order among the layers. Higher draws on top. 0 to 999. | 400 |
Heatmap - Weight
Shown when Advanced Settings is on. See How the weight is used.
| Setting | What it does | Default |
|---|---|---|
| Zoomed Out At | The weight value that adds nothing to the heatmap. 0 to 24. | 0 |
| Zoomed In At | The weight value that adds the full amount. 0 to 24. | 6 |
Heatmap - Radius
Shown when Advanced Settings is on.
| Setting | What it does | Default |
|---|---|---|
| Zoomed Out At | The zoom level at which the radius is Radius (Zoomed Out). Below this level the radius stays at that value. | 0 |
| Radius (Zoomed Out) | The same setting as in Heatmap - Configuration. | 2 |
| Zoomed In At | The zoom level at which the radius reaches Radius (Zoomed In). Above this level it stays at that value. | 9 |
| Radius (Zoomed In) | The same setting as in Heatmap - Configuration. | 20 |
Heatmap - Intensity
Shown when Advanced Settings is on.
| Setting | What it does | Default |
|---|---|---|
| Zoomed Out At | The zoom level at which the intensity is Intensity (Zoomed Out). | 0 |
| Intensity (Zoomed Out) | Intensity multiplier when the map is zoomed out. 0 to 100. | 1 |
| Zoomed In At | The zoom level at which the intensity reaches Intensity (Zoomed In). | 9 |
| Intensity (Zoomed In) | Intensity multiplier when the map is zoomed in. 0 to 100. | 3 |
Heatmap - Formatting
| Setting | What it does | Default |
|---|---|---|
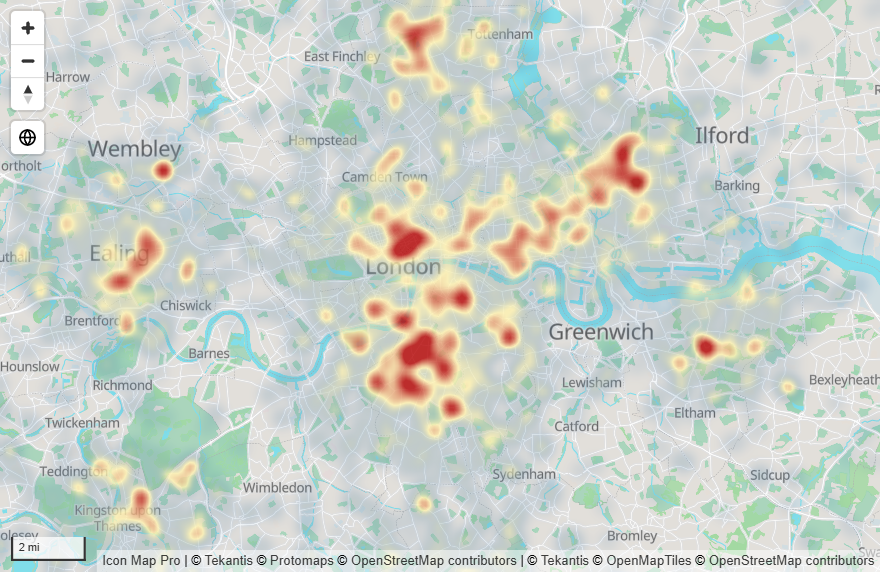
| Transparency | Transparency of the whole heatmap. 0 is solid, 100 is invisible. | 20 |
| Number of Colors in Gradient | How many colors the gradient uses, 2 to 5. | 5 |
| Color 1 | The color for the lowest density. | #0000FF |
| Color 2 | The second color. | #00FFFF |
| Color 3 | Shown with 3 or more colors. | #00FF00 |
| Color 4 | Shown with 4 or more colors. | #FFFF00 |
| Color 5 | The color for the highest density, with 5 colors. | #FF0000 |
The colors are spread evenly from low to high density. Areas with no points are fully transparent, and the heatmap fades in toward Color 1.
Selection, tooltips and labels
A heatmap shows a pattern, not individual points, so it has no tooltips, no data labels, and its points cannot be selected. If you need to select points, use Circles with clustering, or Cells, which group points into areas you can select.
The heatmap can have an entry in the legend. See Legend.
Tips and limits
- If the map is one solid hot color, lower the radius or the intensity, or check that your weights are not all above Zoomed In At in the Heatmap - Weight group.
- If the heatmap is hard to see, raise the radius or the intensity, or lower Transparency.
- A heatmap works well with large numbers of rows. See Data rows and limits to load more than 30,000.
- A row is either a heatmap point or a circle, never both. To show a heatmap and circles together, see Combine several layers in one map.
- The Units, Size, Multiplier and Alpha Range settings are part of the Legacy engine, see the documentation for 1.1.0.9 and earlier.