
Reference layers overview
Reference layers give your data context: boundaries from a file, imagery from a tile server, a layer from ArcGIS or a WMS service, live weather or traffic. They are drawn as they are published and do not come from your data model.
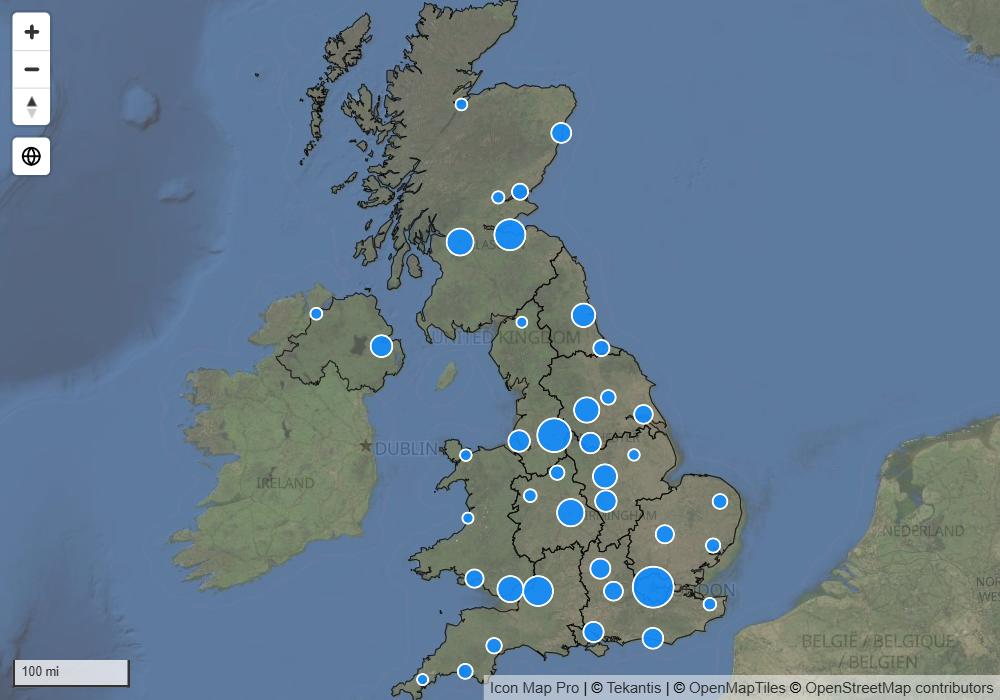
Reference layers and data layers
A map in Icon Map Pro is a basemap, plus data layers, plus reference layers.
| Data layers | Reference layers | |
|---|---|---|
| Where the content comes from | The rows of your report, through the field wells | A file, a link or a service that you point the map at |
| What a row does | One row draws one thing | Rows are not needed. A reference layer draws with no fields at all |
| Click and select | Selects the row and cross-filters the report | Not selectable. Hovering can show a tooltip |
| Styling from data | Conditional formatting (fx) on most settings | Fixed styling, or styling by a property inside the file or service |
A reference layer is not joined to your data, but your data can still control it. Several settings take conditional formatting (fx), so a measure or a slicer can decide what is drawn:
- Visible on file, raster, WMS and ArcGIS layers shows or hides the layer.
- Filter Value on a file layer keeps only the features whose property matches your data. See Files and feeds.
- SQL WHERE Clause on an ArcGIS layer and CQL Filter (optional) on a WMS layer filter the service.
- The link itself can come from a measure on most layer types.
If you want shapes that are colored by your data and that cross-filter the report when clicked, use a data layer instead: Shapes from files, ArcGIS layers bound to data, Vector tiles or Icon Map Catalog layers.
Types of reference layer
| Type | Name in the Format pane | What it draws | How many |
|---|---|---|---|
| Files | GeoJSON / Shape / KML File | Points, lines and polygons from a GeoJSON link or an uploaded file: GeoJSON, TopoJSON, KML, shapefile or a PMTiles archive | 5 |
| Raster tiles | Raster Layer | Imagery or a tiled map from a tile template or a Cloud Optimized GeoTIFF | 5 |
| WMS | WMS Layer | Map images from a Web Map Service | 5 |
| ArcGIS | ArcGIS Feature Layer | The features of an ArcGIS feature layer | 5 |
| Weather | Weather | Live weather from OpenWeatherMap | 1 |
| Traffic | Traffic | Live traffic flow or incidents from Azure Maps | 1 |
| Daylight | Daylight Terminator | Shading over the part of the world that is in darkness | 1 |
| Map labels | Map Labels | Place names drawn above your data | 1 |
File layers can also carry their own text labels. See Labels on reference layers.
Add a reference layer
- In the Format pane, open Reference Layers > Layer Selection.
- Switch on the type you want, for example GeoJSON / Shape / KML File or WMS Layer.
- A configuration group for that type appears below Layer Selection. Enter the link or upload the file there.
More than one layer of a type
Files, ArcGIS, WMS and raster layers each have five slots. The Format pane shows the settings of one slot at a time.
- Files and ArcGIS layers: set Number of Layers (1 to 5), then choose the layer to edit in Apply settings to.
- WMS and raster layers: the first layer has its own group. Set Number of Additional Layers (0 to 4), then choose the additional layer to edit in Apply settings to.
Drawing order
Every layer on the map, reference or data, has a Z-Index. A layer with a higher Z-Index is drawn nearer the viewer. Reference layers and data layers share one scale, so a reference layer can sit under your data, between two data layers, or on top of everything.
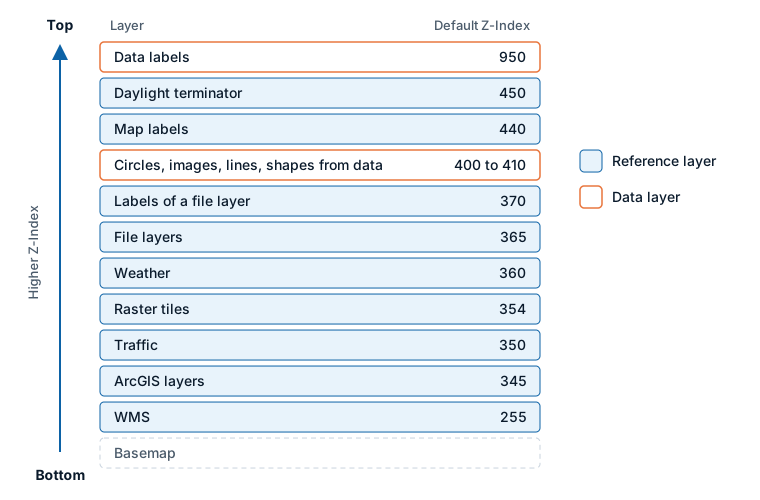
| Layer | Default Z-Index |
|---|---|
| Daylight terminator | 450 |
| Map labels | 440 |
| Labels of a file layer | 370 |
| File layers | 365 |
| Weather | 360 |
| Raster layer 1 | 354 |
| Traffic | 350 |
| ArcGIS layers | 345 |
| Additional raster and WMS layers | 344 |
| WMS layer 1 | 255 |
For comparison, circles default to 405 and data labels to 950. The defaults put imagery and boundaries under your data and place names above it.
To change the order, edit the Z-Index of a layer in its configuration group in the Format pane. Values run from 0 to 1000.
Zoom range and visibility
File, raster, WMS and ArcGIS layers each have a minimum and maximum zoom. Outside that range the layer is not drawn. Use this to show detailed boundaries only when the reader has zoomed in.
The same layer types have a Visible setting that takes conditional formatting (fx). Return "Yes" or "No" from a measure to show a layer only for a slicer choice or a bookmark.
Legend
File layers can each have an entry in the legend. Switch entries on and name them under Format pane > Legend > Legend labels. See Legend.
Tips and limits
- Reference features cannot be selected and do not cross-filter the report.
- Links must start with
https://. - A layer that is read from a link is read by the browser of the person viewing the report. The server must allow requests from Power BI (CORS). See below for servers that do not.
- Uploaded files are stored in the report, so they work wherever the report does.
Servers that block Power BI
Some servers do not allow a Power BI visual to read them. The Icon Map proxy can fetch the layer on the map's behalf. It needs an Icon Map license key and proxied requests may consume additional usage credits.
WMS layers have a Use CORS Proxy switch.
For what the proxy sends and how to switch it off for a whole report, see API keys, authentication and the proxy.