
Fields reference
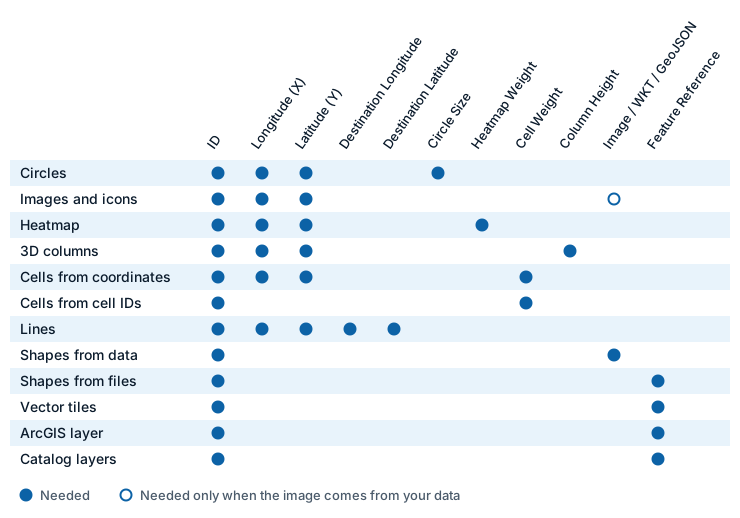
Icon Map Pro has fifteen field wells. This page lists each one, what it accepts and which layers use it. The fields a row fills in decide which layer draws that row.
The short version
- Every map needs * ID (required). Without it Power BI sends no rows.
- Add the fields for the layer you want. Circles need Longitude (X), Latitude (Y) and Circle Size. Shapes from a file need Feature Reference.
- A row is drawn by the layer whose fields it fills in, and only if the fields that belong to other layers are empty on that row. See Combine several layers in one map.
- Tooltips, Cluster Group and Daylight Date & Time never affect which layer draws a row.
Field wells
The wells are listed in the order the Build pane shows them.
| Field well | What to put in it | Accepts | Used by |
|---|---|---|---|
| * ID (required) | A unique value for each thing you want on the map, such as a name or code. For cells drawn from cell IDs, the cell ID | Any type. Several fields make a drill-down hierarchy | Every layer |
| Longitude (X) | The longitude of a point, or the origin of a line. Decimal degrees, summarized as Average | One numeric field | Circles, Images, Heatmap, 3D columns, Cells from coordinates, Lines |
| Latitude (Y) | The latitude of a point, or the origin of a line. Decimal degrees, summarized as Average | One numeric field | The same layers as Longitude (X) |
| Destination Longitude | The longitude of the point a line is drawn to | One numeric field | Lines |
| Destination Latitude | The latitude of the point a line is drawn to | One numeric field | Lines |
| Circle Size | A number that sets each circle's size | One numeric field | Circles. Also allowed on line rows, for circles at the ends of lines |
| Cluster Group | A category that splits clusters into groups | Up to two fields of any type: the first for the cluster group, the second for the secondary cluster group | Clusters of circles and images |
| Heatmap Weight | A number that weights each point | One numeric field | Heatmap |
| Cell (H3/S2/A5/Geohash) Weight | A number aggregated into each cell, or the value of each cell when you supply cell IDs | One numeric field | Cells |
| Column Height | A number that sets each column's height | One numeric field | 3D columns |
| Image / WKT / GeoJSON | An image URL or SVG for each row, or the geometry of a shape as WKT or GeoJSON text | Any type | Images, Shapes from data |
| Feature Reference | A value that matches a property of each shape in a file, tile set, ArcGIS layer or catalog layer, for example a postcode | Any type. One field per drill-down level | Shapes from files, Vector tiles, ArcGIS layers bound to data, Catalog layers bound to data |
| Feature Weight | A value that sets the color of a shape from a file when you are not using conditional formatting | One field | Shapes from files |
| Daylight Date & Time | A date and time. The Daylight Terminator shows day and night as they would be at that time instead of now | A date and time field | Daylight Terminator reference layer |
| Tooltips | Any fields you want in the tooltip | Any number of fields | Every layer with tooltips |
The Icon Map Pro guide and messages shorten Cell (H3/S2/A5/Geohash) Weight to "Cell Weight".
Field well names and descriptions follow the report's language. See Languages.
Fields each layer needs
A layer draws a row when the row fills in everything in Needs and leaves everything in Must be empty blank.
| Layer | Needs | Must be empty on its rows |
|---|---|---|
| Circles | ID, Longitude (X), Latitude (Y), Circle Size | Destination Longitude, Destination Latitude, Image / WKT / GeoJSON, Feature Reference, Heatmap Weight, Cell Weight, Column Height |
| Images and icons | ID, Longitude (X), Latitude (Y). Image / WKT / GeoJSON when the image comes from your data | Destination Longitude, Destination Latitude, Feature Reference, Heatmap Weight, Cell Weight, Circle Size |
| Heatmap | ID, Longitude (X), Latitude (Y), Heatmap Weight | Destination Longitude, Destination Latitude, Circle Size, Image / WKT / GeoJSON, Feature Reference, Cell Weight |
| 3D columns | ID, Longitude (X), Latitude (Y), Column Height | Destination Longitude, Destination Latitude, Circle Size, Image / WKT / GeoJSON, Feature Reference, Cell Weight, Heatmap Weight |
| Cells from coordinates | ID, Longitude (X), Latitude (Y), Cell Weight | Destination Longitude, Destination Latitude, Circle Size, Heatmap Weight, Image / WKT / GeoJSON, Feature Reference |
| Cells from cell IDs | ID (holding the cell ID), Cell Weight | Longitude (X), Latitude (Y) and the fields listed for cells from coordinates |
| Lines | ID, Longitude (X), Latitude (Y), Destination Longitude, Destination Latitude | Feature Reference, Image / WKT / GeoJSON, Heatmap Weight, Cell Weight |
| Shapes from data | ID, Image / WKT / GeoJSON | Longitude (X), Latitude (Y), Destination Longitude, Destination Latitude, Heatmap Weight, Cell Weight, Feature Reference, Circle Size |
| Shapes from files | ID, Feature Reference | Image / WKT / GeoJSON, Longitude (X), Latitude (Y), Destination Longitude, Destination Latitude, Heatmap Weight, Cell Weight, Circle Size |
| Vector tiles | ID, Feature Reference | Image / WKT / GeoJSON, Heatmap Weight, Cell Weight, Circle Size |
| ArcGIS layers bound to data | ID, Feature Reference | None |
| Icon Map Catalog layers bound to data | ID, Feature Reference | None |
What counts as empty
A field is empty on a row when its value is null or BLANK(). A blank text value, which is an empty string or only spaces, also counts as empty. This matters for tables loaded from CSV or Excel, where an empty cell often arrives as blank text.
This applies to the fields that decide a row's layer: Longitude (X), Latitude (Y), Destination Longitude, Destination Latitude, Circle Size, Heatmap Weight, Cell Weight, Column Height, Image / WKT / GeoJSON and Feature Reference.
A column dropped into a field well usually has a value on every row. To keep a field empty on some rows, use a measure that returns BLANK() for them.
Tips and limits
- Set Longitude (X) and Latitude (Y) to summarize as Average, so that each ID keeps its own coordinates.
- A row with both Circle Size and Column Height is ambiguous and is not drawn by either layer.
- A row with a destination is a line, not a circle, unless the Lines layer is drawing circles at the ends of its lines.
- A row can be drawn by more than one layer. For example, a row with a Feature Reference value can color a shape from a file and a catalog layer bound to data.
- Power BI sends 30,000 rows by default. To raise the limit see Data rows and limits.
- Power BI can hold 32,766 characters in one text value, which limits the size of a WKT or GeoJSON shape held in Image / WKT / GeoJSON. See Shapes from data (WKT and GeoJSON).