
Data layers overview
A data layer draws the rows of your Power BI data on the map: as circles, images, a heatmap, cells, 3D columns, lines or shapes. This page lists every data layer, the fields it needs, and how to turn it on.
How data layers work
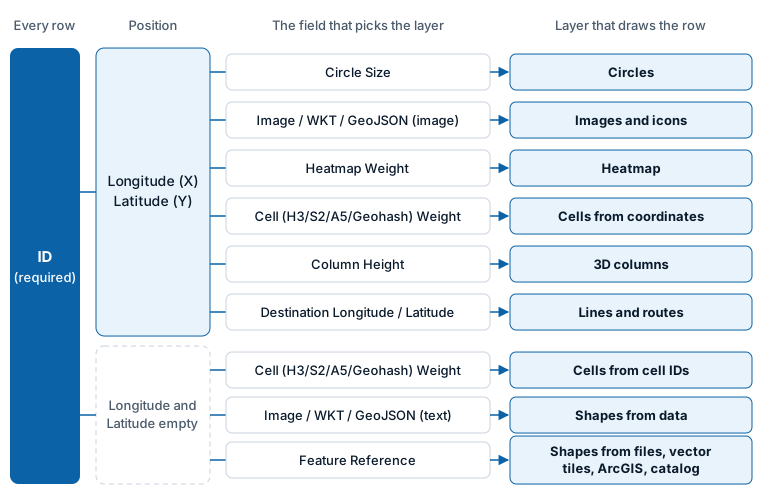
Every data layer reads the same set of field wells. You do not choose a layer for each row. Instead, each row is drawn by the layer whose fields it fills in:
- Every row needs a value in * ID (required). The visual draws one thing per ID value.
- Point-based layers also need Longitude (X) and Latitude (Y).
- One more field decides the layer: a row with a Circle Size is a circle, a row with a Heatmap Weight is a heatmap point, a row with a Column Height is a 3D column, and so on.
- The fields that belong to other layers must be empty on that row. A blank text cell counts as empty.
- The layer must be turned on.
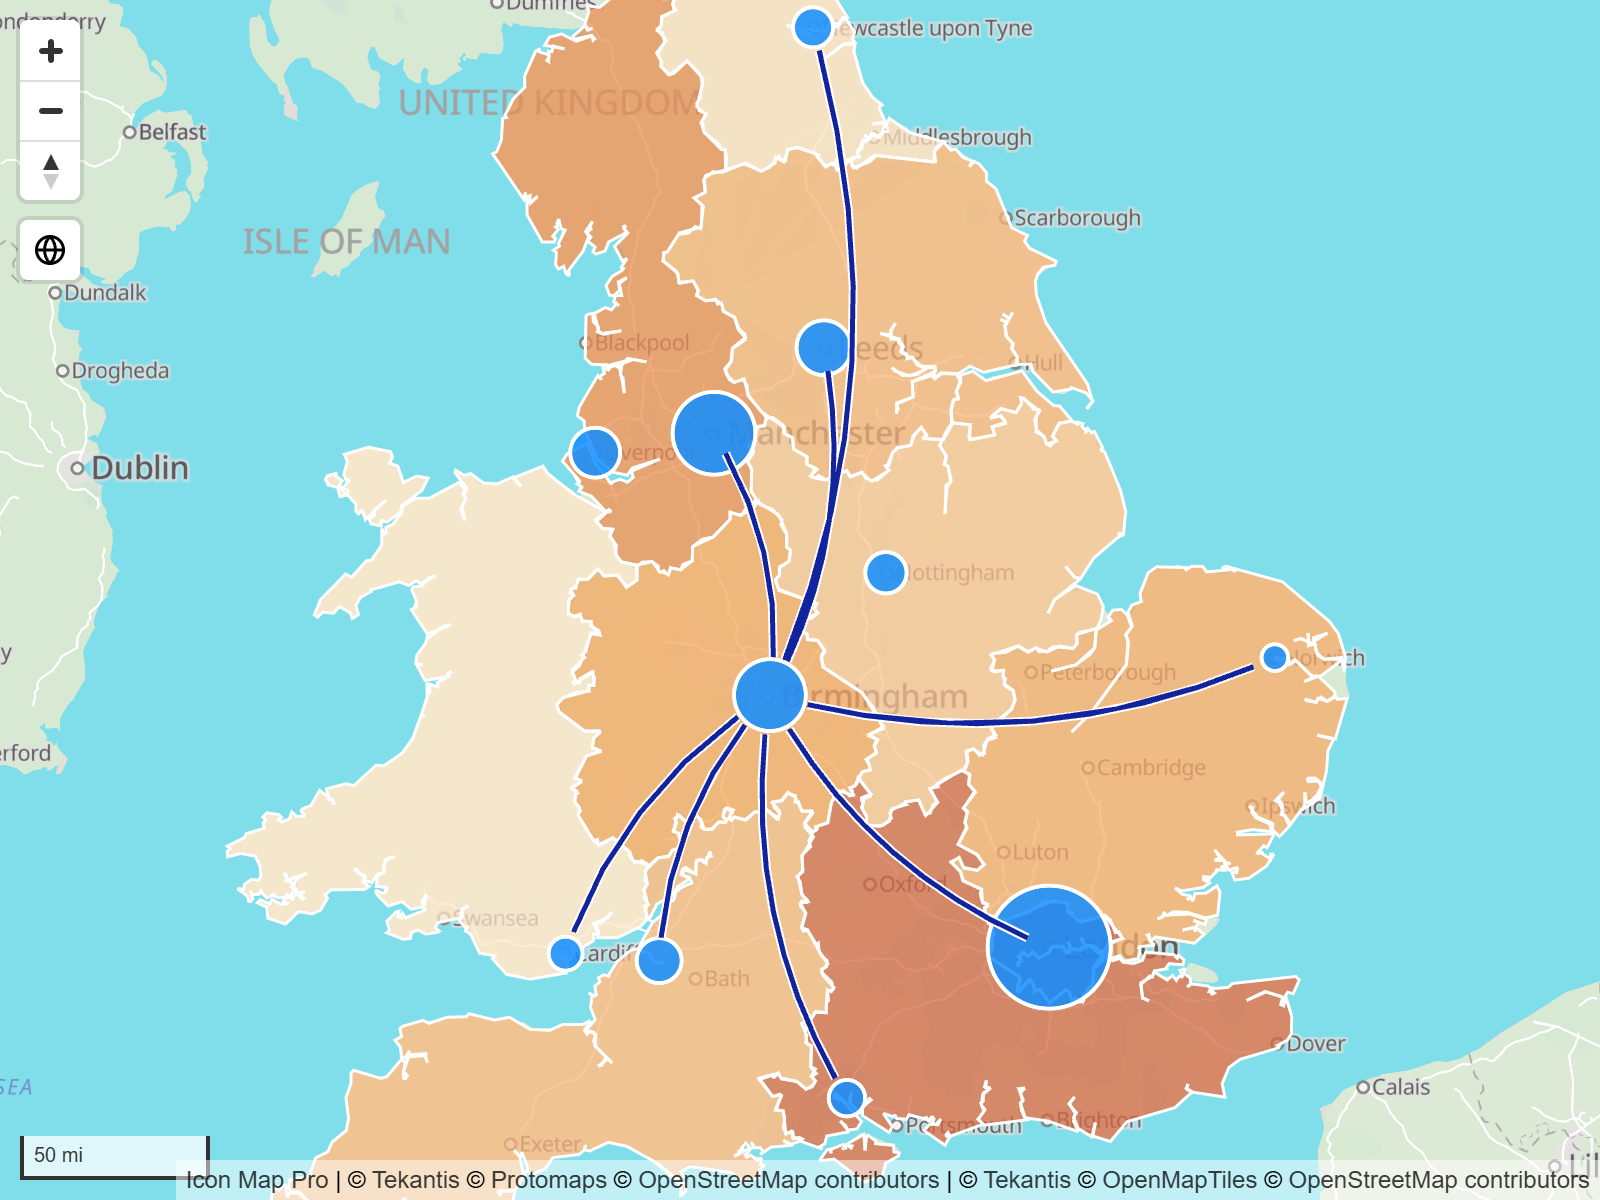
A map with one layer type usually needs no extra thought: add the fields that layer needs and leave the others out of the visual. To show several layer types on one map, see Combine several layers in one map.
Layer types and the fields they need
All layers need * ID (required). The table lists the other fields.
| Layer | What it shows | Fields it needs |
|---|---|---|
| Circles | A circle at each location, sized and colored by your data | Longitude (X), Latitude (Y), Circle Size |
| Images and icons | A picture, icon or text badge at each location | Longitude (X), Latitude (Y), Image / WKT / GeoJSON (not needed for the icon library or one image for every point) |
| Clusters | Nearby circles or images grouped into one chart | The fields for circles or images, optionally Cluster Group |
| Heatmap | Where points concentrate, as a color glow | Longitude (X), Latitude (Y), Heatmap Weight |
| Cells | Points aggregated into H3, S2, A5 or Geohash cells, or into your own polygons | Longitude (X), Latitude (Y), Cell (H3/S2/A5/Geohash) Weight - or a cell ID in * ID (required) and the weight |
| 3D columns | A column rising from each location | Longitude (X), Latitude (Y), Column Height |
| Lines | Lines, arcs and flows from an origin to a destination | Longitude (X), Latitude (Y), Destination Longitude, Destination Latitude |
| Routes | Lines that share a street, drawn side by side | The same fields as lines |
| Shapes from data | Polygons and lines held in your data as WKT or GeoJSON text | Image / WKT / GeoJSON |
| Shapes from files | Boundaries from a file or service, colored by your data | Feature Reference |
| Vector tiles | Very large boundary sets from vector tiles or PMTiles | Feature Reference |
| ArcGIS layers bound to data | Features of an ArcGIS feature layer, styled by your data | Feature Reference |
| Icon Map Catalog layers | Ready-made boundaries such as countries and postcodes | Feature Reference |
Two more fields work with every layer and never affect which layer draws a row: Tooltips adds fields to the tooltip, and Cluster Group splits clusters by category. For every field well in detail, see the Fields reference.
Longitude (X) and Latitude (Y) take decimal degrees. Power BI summarizes numeric fields, so set both to Average (or use a measure) rather than Sum.
Turn a layer on
A new map starts with Circles turned on and every other data layer off.
Turn layers on in Format pane > Data Layers > Data Layers, which has a switch for each layer type. When a layer is on, its settings groups appear lower down in the same card, for example Circles - Configuration and Circles - Formatting.
While you are editing, the visual also helps you choose. If your rows do not reach any layer, a panel titled What kind of map are you making? appears over the map. Select a tile to see the fields that layer needs and to turn it on. See Choose a layer type.
Settings that every point layer shares
The layers that draw at a longitude and latitude share a few ideas. Each layer's page lists its own settings.
| Idea | What it means |
|---|---|
| Drawing order | Each layer has a Z Index (or Z-Index). A layer with a higher number draws on top. |
| Zoom range | Minimum and maximum zoom settings hide a layer when the map is zoomed out or in past them. |
| Auto zoom | Each layer can be included in, or left out of, the area the map zooms to. See View, zoom and projection. |
| EPSG | The coordinate system of your longitude and latitude values. The default, 4326, is ordinary decimal degrees. Enter another EPSG code and the visual converts the coordinates for you. |
| Conditional formatting | Many settings have an fx button, so a rule, a color scale or a field can set them row by row. See Conditional formatting. |