
Map labels on top of your data
A basemap draws its place names under your data, so a filled shape, a heatmap or an imagery layer covers them. The Map Labels reference layer draws place names again above your data, so readers can still see where they are.
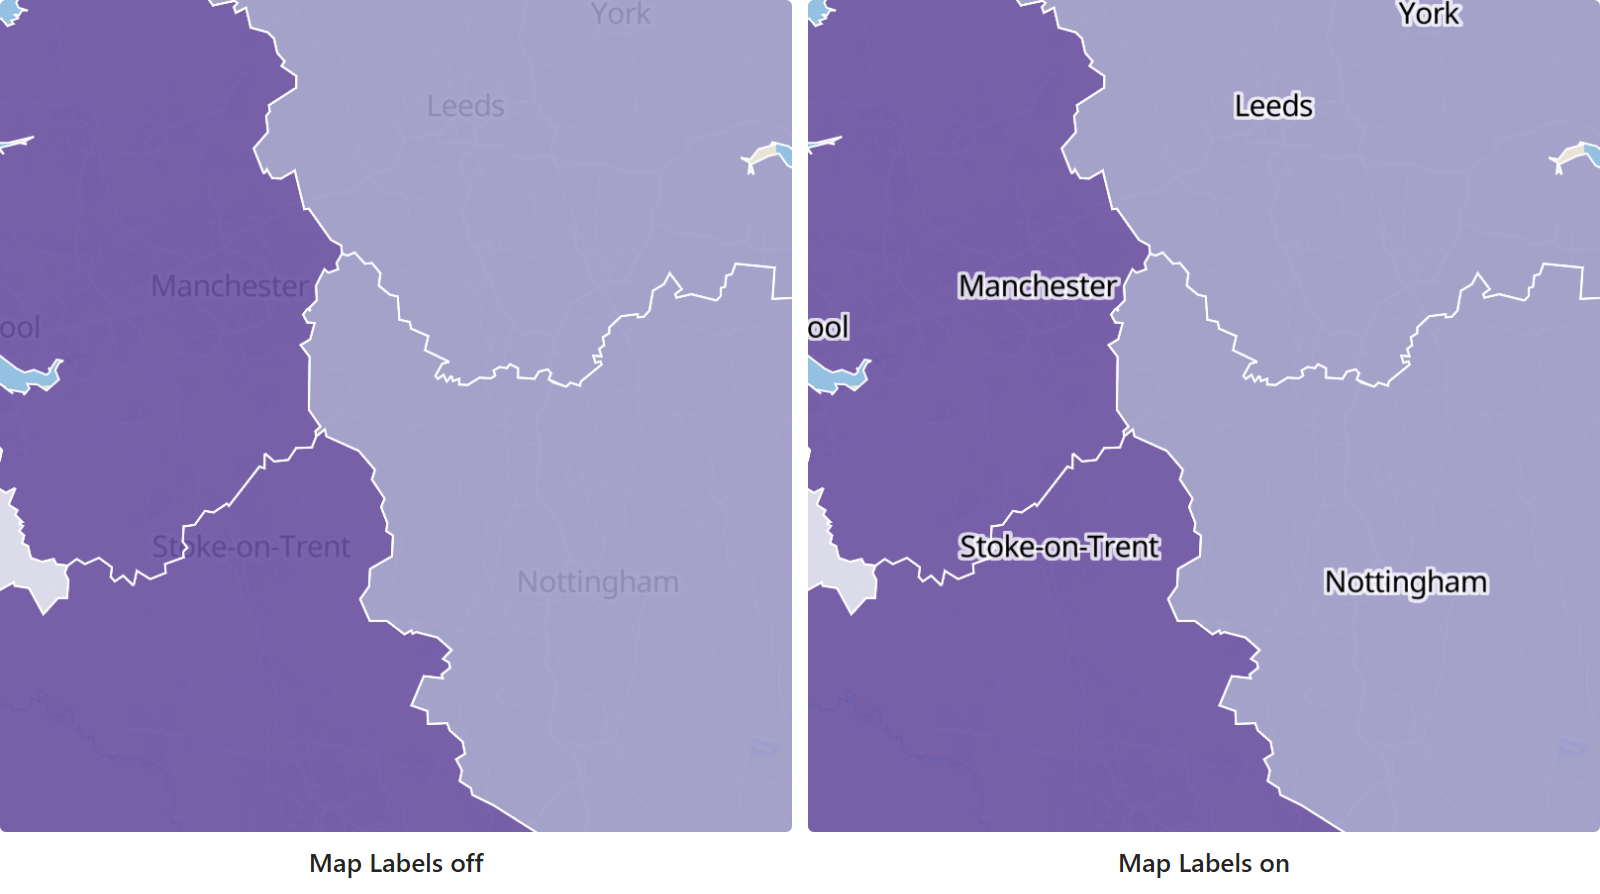
Add map labels
- In the Format pane, open Reference Layers > Layer Selection.
- Switch on Map Labels. The Labels - Configuration group appears below.
Pair Map Labels with a basemap style that has no labels of its own, so that each name is drawn once. See Icon Map basemap styles.
Choose the look
Labels Source chooses where the labels come from:
- Icon Map uses the labels of the Icon Map basemap styles. Pick the style to match your basemap in Label Style.
- Azure Maps uses the labels of Azure Maps. It needs an Azure Maps key under API Keys & Authentication.
Your own colors
With Labels Source set to Icon Map, set Label Style to Custom to choose the colors yourself. You get a color for each kind of place name, from neighborhoods up to countries, and control over the halo that separates the text from the map.
Language
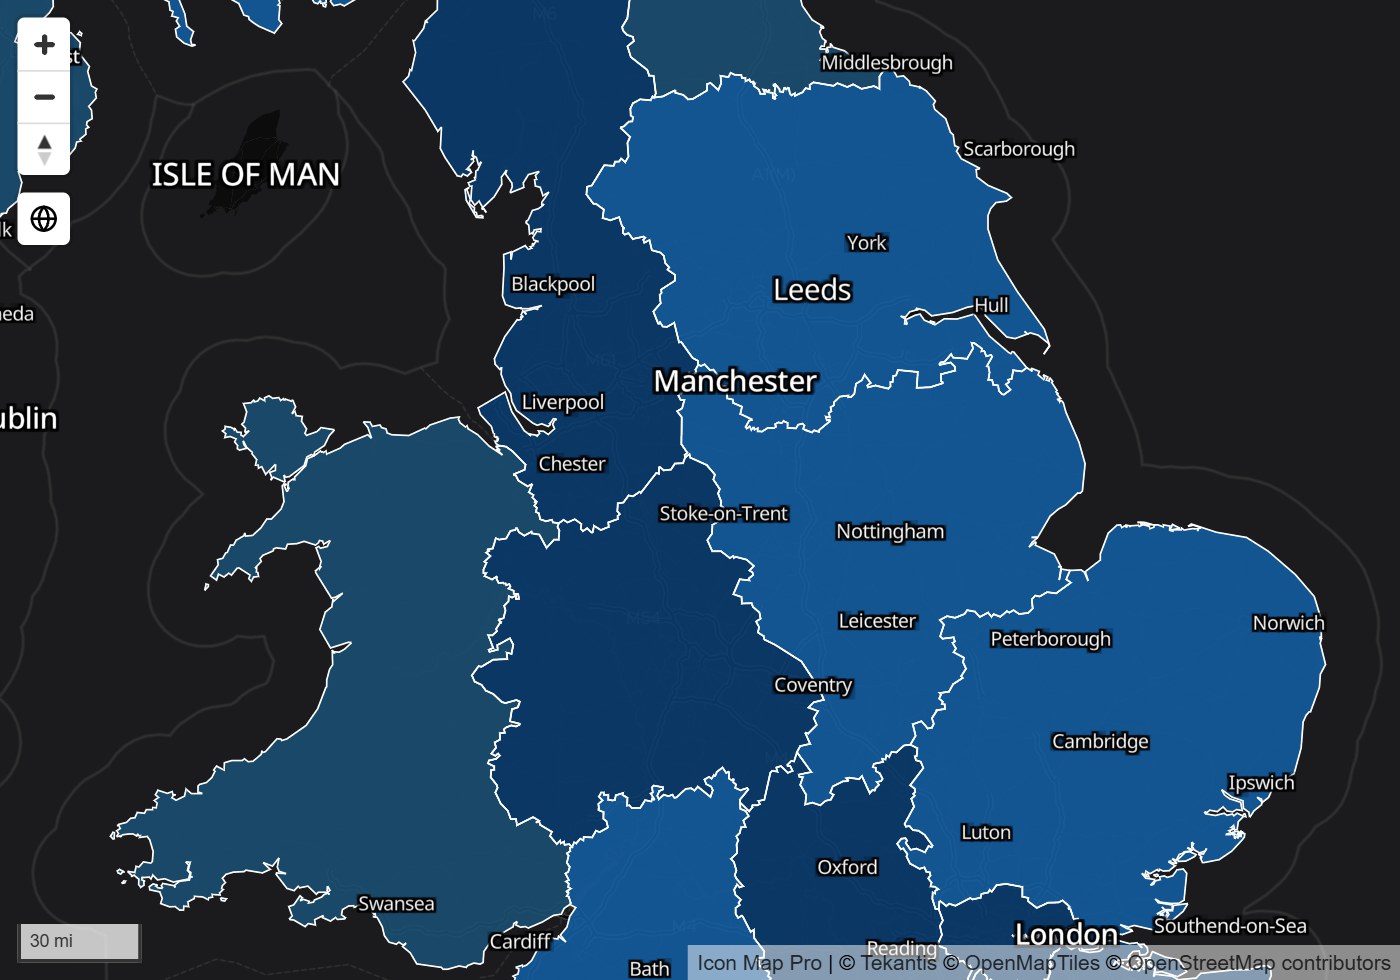
Language sets the language of the place names. It is available for label styles that support more than one language, and for Custom. It takes conditional formatting (fx): return a two-letter language code such as en or fr from a measure to follow the reader's language.
Settings
Format pane > Reference Layers > Labels - Configuration
| Setting | What it does | Default |
|---|---|---|
| Labels Source | Icon Map or Azure Maps | Icon Map |
| Label Style | One of the Icon Map basemap styles, or Custom. The list holds every background style, not only the styles with labels. Shown for Icon Map | The standard style |
| Language | The language of the place names. Takes conditional formatting (fx). Shown for Icon Map | English |
| Neighborhood Color | Color of neighborhood names. Shown for Custom | #000000 |
| Locality Color | Color of town and city names. Shown for Custom | #000000 |
| Region Color | Color of region names. Shown for Custom | #000000 |
| Country Color | Color of country names. Shown for Custom | #000000 |
| Halo Color | Color of the halo around the text. Shown for Custom | #FFFFFF |
| Halo Width | Width of the halo, 0 to 10. Shown for Custom | 2 |
| Halo Blur Width | How far the halo fades out, 0 to 10. Shown for Custom | 1 |
| Min Zoom | The labels are hidden when the map is zoomed out past this level | 0 |
| Max Zoom | The labels are hidden when the map is zoomed in past this level | 24 |
| Z Index | Drawing order, 0 to 1000. Higher is nearer the viewer | 440 |
Languages
Arabic (ar), Bulgarian (bg), Chinese (Simplified) (zh-Hans), Chinese (Traditional) (zh-Hant), Croatian (hr), Czech (cs), Danish (da), Dutch (nl), English (en), Estonian (et), Finnish (fi), French (fr), German (de), Greek (el), Hebrew (he), Hindi (hi), Hungarian (hu), Indonesian (id), Irish (ga), Italian (it), Japanese (ja), Korean (ko), Latvian (lv), Lithuanian (lt), Maltese (mt), Marathi (mr), Nepali (ne), Norwegian (no), Persian (fa), Polish (pl), Portuguese (pt), Romanian (ro), Russian (ru), Slovak (sk), Slovenian (sl), Spanish (es), Swedish (sv), Turkish (tr), Ukrainian (uk), Urdu (ur), Vietnamese (vi).
Tips and limits
- The default Z Index of 440 puts map labels above circles, lines, shapes and file layers, and below data labels. Lower it to tuck the labels under a layer.
- Use Min Zoom and Max Zoom to show the extra labels only at the zoom levels where your data hides the basemap's own.
- ArcGIS and Mapbox label sources are part of the Legacy engine. See the documentation for 1.1.0.9 and earlier.
- To label the features of your own files, see Labels on reference layers. To label the rows of your data, see Data labels.