
Conditional formatting
Conditional formatting (fx) lets a setting take its value from your data instead of a fixed value. Use it to color circles by a measure, set a different image for each row, or switch a layer on and off with a slicer.
Before you start
- Conditional formatting is set in the Format pane. Look for the fx button next to a setting.
- The layer must be on, and the visual must have data, before its settings appear.
Color circles by a measure
- In the Format pane, open Data Layers > Circles - Formatting.
- Select the fx button next to Fill Color.
- In Format style, choose Gradient, Rules or Field value.
- Choose the field or measure the color is based on, set the colors or rules, and select OK.
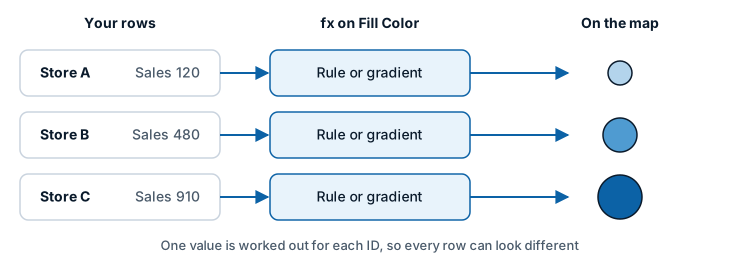
Each circle now takes the color worked out for its own row. To go back to one color, select the fx button again and remove the formatting, or use the eraser next to the setting.
How it works
Power BI works out a conditional formatting value for each value of the * ID (required) field, which is one value per row the visual receives. Icon Map Pro reads that value when it draws the row.
The three format styles do different jobs:
| Format style | Use it for | Example |
|---|---|---|
| Gradient | A color that runs from low to high | Fill color from light to dark by sales |
| Rules | A fixed set of outcomes | Red when a status measure is 1, green when it is 2 |
| Field value | A value your data already holds, or a measure builds | A column of hex colors, an image URL, a line width, a Yes or No |
Field value is the one that makes non-color settings work. A measure can return a number for a width, text for a link, or "Yes" and "No" for a switch such as Visible.
Settings read from every row and settings read once
Most data layer settings are read for every row, so each item can differ. Some settings apply to a whole layer, such as a link, a resolution or a visibility switch. For those, Icon Map Pro uses the value from the first row. Give them a measure that returns the same value on every row, for example a measure that reads a slicer selection.
| Read for every row | Read once for the layer |
|---|---|
| Colors, transparency, widths and sizes of circles, images, lines, columns and shapes | Links and URLs of file, tile and ArcGIS layers |
| Selectable, Include Tooltip, Include in Auto Zoom | Visible switches of layers |
| Image URLs, rotations and icon names | Cell Resolution and its Min Value, Mid Value and Max Value |
| Label text and label colors | Catalog layer Layer Visible and Selected Variant |
Large datasets
With more than 30,000 rows, keep Data Layers > Data Rows > Use new data load logic on. It lets conditional formatting apply to the rows loaded after the first 30,000. See Data rows and limits.
Patterns
Color from a column of color values
Hold a hex color such as #0c62a6 in a column, or build one in a measure. Select fx on the color setting, choose Field value, and pick the column or measure.
Per-row values without a field well
Some values have no field well and are set per row with Field value. Lines are the main example: Width, Color, Weight for Flow, Route Name and Dash Array all take a value per row this way. See Lines.
Show or hide per row
Selectable, Include Tooltip and Include in Auto Zoom are Yes or No settings that accept fx. Return "Yes" or "No" from a measure with Field value, or use Rules, to exclude some rows from selection, tooltips or the auto zoom. Display Label in Labels > Content works the same way for data labels.
Switch a layer or link with a slicer
Use a measure that reads the slicer, for example with SELECTEDVALUE, and bind it with Field value to a layer's Visible setting or to its link. The same measure value must come back on every row.
Filter a reference layer from your data
On a file reference layer, bind Filter Value with Field value. Icon Map Pro reads the value from every row and shows the features that match any of them. See Files and feeds: GeoJSON, KML, CSV, WFS.
Legend entries from a field
In Legend > Legend labels, the description setting of each layer accepts fx > Field value to label legend entries from a data field. See Legend.
Settings that accept conditional formatting
Names are as they appear in the Format pane. A setting is listed only where the fx button is offered.
Data layers
| Layer | Group | Settings with fx |
|---|---|---|
| Circles | Circles - Configuration | Include in Auto Zoom, Include Tooltip, Selectable |
| Circles | Circles - Formatting | Fill Color, Fill Transparency, Fill Style, Hatch Angle, Hatch Width, Outline Color, Outline Transparency, Outline Width, Dash Array, Blur |
| Clusters | Cluster - Configuration, Secondary Cluster - Configuration | Color (when the colors come from a field or rule). Each category takes the color of its first row |
| Images / Icons | Images - Configuration | Image URL, Icon Name / Text, Icon Text Color, Icon / Background Color, Icon Background Transparency, Image Rotation, Image Width, Image Height, Transparency, Include in Auto Zoom, Include Tooltip, Selectable |
| Heatmap | Heatmap - Configuration | Include in Auto Zoom |
| Cells | Cells - Configuration | Resolution, Start Resolution, Start Resolution Zoom Level, End Resolution, End Resolution Zoom Level, Include in Zoom, Selectable |
| Cells | Cells - Formatting | Fill Color, Min Value, Mid Value, Max Value, Extrusion Height. With Use Power BI Formatting on: Outline Color, Outline Transparency, Fill Transparency |
| 3D columns | Columns - Configuration | Include in Zoom, Allow Selection, Include Tooltip |
| 3D columns | Columns - Formatting | Base Height, Width, Color |
| Lines | Lines - Configuration | Include in Auto Zoom, Include Tooltip, Selectable, Include circle(s) at:, and the image URL, height, width, rotation and transparency of the start and end images |
| Lines | Lines - Formatting | Line Shape, Route Name, Color, Transparency, Weight for Flow, Width, Amplitude, Dash Array, Outline Blur, Invisible Line Width, Include Line Symbol, Line Symbol Text, Line Symbol Color, Line Symbol Size, Line Symbol Repeat, Symbol Halo Color, Symbol Halo Width, Symbol Halo Blur |
| Shapes (from data) | Shapes (from data) - Configuration | Include in Auto Zoom, Include Tooltip, Selectable, Circle Size, Image URL, Image Size, Icon Name, Icon Size, Icon Color, Invisible Line Width, Polygon Extrusion Height, Polygon Extrusion Base Height, Linestring Shape, Route Name, and the image URL, rotation, width and height of the linestring start and end images |
| Shapes (from data) | Shapes (from data) - Formatting | Fill Color, Fill Transparency, Fill Style, Hatch Width, Pattern / Image URL, Outline Color, Outline Transparency, Outline Width, Include Line Symbol, Line Symbol Text, Line Symbol Color, Line Symbol Size, Line Symbol Repeat, Symbol Halo Color, Symbol Halo Width, Symbol Halo Blur |
| Shapes (from files) | Configuration group | The file link, Property to Match to Feature Reference Field (when it is a text box), Visible, Include Tooltip, Include in Auto Zoom, Selectable, Circle Size, Polygon Extrusion Height |
| Shapes (from files) | Fill and outline groups | Fill Color, Fill Transparency, Fill Style, Hatch Width, Pattern / Image URL, Outline Color, Outline Transparency, Outline Width |
| Vector Tiles | Vector Tiles - Configuration | Vector Tile XYZ URL, Property to Match, Layer Name(s), Visible, Include Tooltip, Include in Auto Zoom, Selectable |
| Vector Tiles | Vector Tiles - Formatting | Fill Color, Fill Transparency, Outline Color, Outline Transparency, Outline Width, Circle Radius, Extrusion Height |
| ArcGIS layer bound to data | Configuration group | The ArcGIS layer URL, Property to Match (when it is a text box), Visible, ArcGIS SQL WHERE Clause, Include Tooltip, Include in Auto Zoom, Selectable |
| ArcGIS layer bound to data | Formatting group | Fill Color, Fill Transparency, Outline Color, Outline Transparency, Outline Width |
| Catalog layers | The layer's own group in Catalog (Preview) | Layer Visible, Selected Variant, the layer's filters, Color Data Field, Extrusion Data Field, Fill Color, Outline Color, Extrusion Height, Z Index |
Labels and legend
| Card | Group | Settings with fx |
|---|---|---|
| Labels | Content | Display Label, Label Text or Body Text, Title Text, Image, Footer Text |
| Labels | Style | Text Color |
| Labels | Container, Halo or Card | Display Container, the fill, tint or halo color, Transparency, Border Color, Border Width, Border Radius |
| Labels | Placement | Position |
| Legend | Legend labels | The description of each layer |
Reference layers and basemap
| Layer | Settings with fx |
|---|---|
| File reference layers | The file or service link, Filter Value, Label Property Name, Visible, Fill Color, Property for Fill Color, Outline Color, Property for Outline Color, and the start, mid and end values of a gradient |
| ArcGIS reference layers | The ArcGIS layer URL, Visible, SQL WHERE Clause |
| WMS reference layers | Visible, Style, and the Query, LayerDefs and CQL filters. WMS Server URL and Layer when the layer is entered by hand |
| Raster reference layers | The tile template or link, Visible |
| Map Labels | Language |
| Basemap from your own tiles or style (Format pane) | URL template for tile server, URL of the style JSON file |
| Map | Zoom Level When Single Item |
The controls, the legend's layout, interactivity transparencies and API keys do not accept conditional formatting.
Tips and limits
- A measure used with Field value must return the type the setting expects: a color, a number, text, or "Yes" or "No".
- If a setting driven by fx seems to be ignored, check the value Power BI returns. Copy the visual, change the copy to a table, and add the measure to it.
- Cells aggregated from coordinates take their colors from the layer's own color scale. Per-row colors from conditional formatting apply to cells drawn from cell IDs, with Use Power BI Formatting on.
- A Flow Tree takes one color per origin, from the first row of that origin.