
Format pane map
The Format pane holds every setting of Icon Map Pro. This page lists each card and group in the order the pane shows them, with a link to the page that explains it.
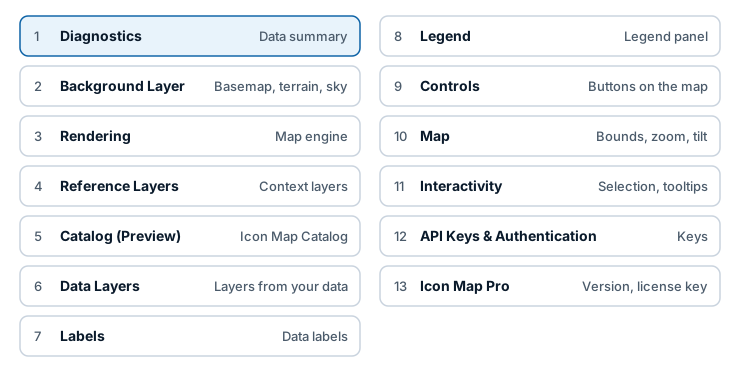
Open the Format pane
- Add at least one field to the visual. Until then the pane shows one card with the message "Add data to the visual before configuring formatting options." and the version number.
- Select the visual.
- Open the Format pane (the paintbrush icon). In Power BI Desktop with the on-object interaction turned on, select More options on the formatting menu to show the full pane.
How the pane is organized
- A card is a top-level section, such as Data Layers.
- A group is a collapsible block inside a card, such as Circles - Formatting.
- Most groups appear only when the thing they configure is switched on. Turn on Circles in Data Layers and the circle groups appear.
- A setting with an fx button accepts conditional formatting. See Conditional formatting.
This page describes the Modern engine. A map on the Legacy engine shows different groups. See the documentation for 1.1.0.9 and earlier, and Modern and Legacy engines to find out which engine a map uses.
Diagnostics
| Group | What it holds | Documented in |
|---|---|---|
| Diagnostic Tools | Show Data Configuration Summary, a switch that opens a summary of the rows the visual received and which layer draws each one | Combine several layers in one map |
Background Layer
| Group | What it holds | Documented in |
|---|---|---|
| Map Source | Background map source: which provider draws the basemap | Set the basemap in the Format pane |
| Icon Map Tiles - Configuration | The Icon Map style, label language and 3D buildings | Icon Map basemap styles |
| ArcGIS - Configuration | An ArcGIS basemap | Other basemap providers |
| Azure Maps - Configuration | An Azure Maps basemap | Other basemap providers |
| Mappable - Configuration | A Mappable basemap | Other basemap providers |
| Ordnance Survey - Configuration | An Ordnance Survey basemap | Other basemap providers |
| Raster Tiles - Configuration | A basemap from your own raster tile server | Other basemap providers |
| Vector Tiles - Configuration | A basemap from a vector style link | Other basemap providers |
| WMS - Configuration | A basemap from a WMS server | Other basemap providers |
| Hill Shading | Shaded relief over any basemap | Terrain, hillshade, sky and lighting |
| 3D Terrain | Raised terrain | Terrain, hillshade, sky and lighting |
| Light | The light on 3D content | Terrain, hillshade, sky and lighting |
| Sky | Sky, fog and the globe's atmosphere | Terrain, hillshade, sky and lighting |
Only the provider group that matches Background map source is shown.
Rendering
| Group | What it holds | Documented in |
|---|---|---|
| Rendering | Map engine (Modern or Legacy) and Antialiasing | Modern and Legacy engines |
Reference Layers
| Group | What it holds | Documented in |
|---|---|---|
| Layer Selection | A switch for each reference layer type: Map Labels, Traffic, Weather, Daylight Terminator, GeoJSON / Shape / KML File, ArcGIS Feature Layer, WMS Layer, Raster Layer | Reference layers overview |
| Labels - Configuration | Place names drawn above your data | Map labels on top of your data |
| Weather - Configuration | Weather overlay | Weather, traffic and daylight |
| Traffic - Configuration | Traffic overlay | Weather, traffic and daylight |
| Daylight Terminator - Configuration | Day and night shading | Weather, traffic and daylight |
| ArcGIS Feature Layer - Setup and one Configuration group per layer | ArcGIS feature layers as reference layers | ArcGIS layers |
| GeoJSON / Shape / KML - Setup | How many file layers the map has | Files and feeds: GeoJSON, KML, CSV, WFS |
| GeoJSON / Shape / KML Layer 1 - Configuration and - Formatting (one pair per layer) | The link or upload, filters and styling of each file layer | Files and feeds: GeoJSON, KML, CSV, WFS |
| GeoJSON / Shape / KML Layer 1 - Labels (one per layer) | Labels for each file layer | Labels on reference layers |
| Raster - Configuration and Additional Raster Layer groups | Raster tile layers | Raster tiles, WMTS and WMS |
| WMS - Configuration and WMS Additional Layer groups | WMS layers | Raster tiles, WMTS and WMS |
Catalog (Preview)
| Group | What it holds | Documented in |
|---|---|---|
| Catalog Layers | Configure Layers opens the Icon Map Catalog dialog | Icon Map Catalog layers |
| One group per catalog layer, named after the layer | Visibility, variant, colors, extrusion and order of that layer | Icon Map Catalog layers |
This card is hidden when Airgapped Environment is on. See Power BI Report Server (on-premises).
Data Layers
The first group holds a switch for each data layer type. The groups for a layer appear when its switch is on.
| Group | What it holds | Documented in |
|---|---|---|
| Data Layers | The switches: Circles, Columns, Heatmap, Cells (H3/S2/A5/Geohash), Images / Icons, Lines, Shapes (from data) WKT / GeoJSON features, Shapes (from files) GeoJSON / Shapefile / KML / IMDF, Vector Tiles and the ArcGIS layer switch | Data layers overview |
| Circles - Configuration, Circles - Formatting | Circle size, color and behavior | Circles |
| Cluster - Configuration, Secondary Cluster - Configuration | Clustering of circles and images | Clusters |
| Heatmap - Configuration, Heatmap - Formatting | The heatmap. With advanced settings on: Heatmap - Weight, Heatmap - Radius, Heatmap - Intensity | Heatmap |
| Cells - Configuration, Cells - Formatting | Grid cells and custom shapes | Cells: H3 hexagons and grids |
| Images - Configuration | Images and icons | Images and icons |
| Lines - Configuration, Lines - Formatting | Lines, flows and routes | Lines and Routes |
| Columns - Configuration, Columns - Formatting | 3D columns | 3D columns |
| Shapes (from data) - Configuration, Shapes (from data) - Formatting | Shapes held in your data as WKT or GeoJSON | Shapes from data (WKT and GeoJSON) |
| Vector Tiles - Setup, - Configuration, - Formatting, - Unmatched Formatting | Vector tiles joined to your data | Vector tiles |
| Shapes (from files) - Setup, then configuration, fill, outline and unmatched groups for each level or layer | Shapes from a file joined to your data | Shapes from files |
| ArcGIS layer Setup, Configuration and Formatting groups | An ArcGIS layer joined to your data | ArcGIS layers bound to data |
| Data Rows | Maximum data rows and Use new data load logic | Data rows and limits |
The ArcGIS switch and its groups are named ArcGIS Feature Layer.
Labels
This card appears when a data layer that can carry labels is on: Circles, Images / Icons, Shapes (from data), Shapes (from files), Vector Tiles, Lines or Cells.
| Group | What it holds | Documented in |
|---|---|---|
| Content | What the label says | Data labels |
| Style | The label style and text | Data labels |
| Container, Halo or Card (the title follows the style) | The box or halo around the text | Data labels |
| Placement | Where the label sits | Data labels |
| Size and Zoom | Label size and the zoom range it shows at | Data labels |
Legend
The card has its own on/off switch.
| Group | What it holds | Documented in |
|---|---|---|
| Legend | Position, title and display mode | Legend |
| Legend labels | Per-layer titles and descriptions | Legend |
| Conditional formatting legends | Legend entries for settings driven by conditional formatting | Legend |
Controls
| Group | What it holds | Documented in |
|---|---|---|
| Controls | A switch for each on-map control: zoom, globe toggle, pitch, bearing, zoom level, search, basemap selector, scales, distance tool, zoom lock, lasso and clear selections. Also Projection, Control Size and Additional Attribution | Map controls |
| Layer control | The panel that lets readers turn layers on and off | Map controls |
Map
| Group | What it holds | Documented in |
|---|---|---|
| Map Bounds | The default view and the area the map is limited to | View, zoom and projection |
| Animation | Animated moves between views | View, zoom and projection |
| Zoom | Auto zoom, zoom limits, Default Pitch and Default Bearing | View, zoom and projection |
Interactivity
| Group | What it holds | Documented in |
|---|---|---|
| Item selection | How selected and unselected items look | Selection, cross-filtering and highlighting |
| Cross Highlighted Items | How items highlighted from other visuals look | Selection, cross-filtering and highlighting |
| Tooltips | Combine Tooltips | Tooltips |
API Keys & Authentication
| Group | What it holds | Documented in |
|---|---|---|
| API Keys | Keys for Azure Maps, Mappable, Ordnance Survey and Open Weather Map | API keys, authentication and the proxy |
| ArcGIS Authentication | How the map connects to ArcGIS | Connect to ArcGIS |
Icon Map Pro
The last card. It appears once the visual has data.
| Group | What it holds | Documented in |
|---|---|---|
| (first group, no title) | The running version, License Key (for non-user based licensing), Reference and Instance | License keys and activation |
| Customization | Airgapped Environment and Custom Styles URL | Power BI Report Server (on-premises) |
| Information for Support | A trace of the license check for support, Opt out of telemetry and Detailed telemetry for support | Get support and Security and certification |