
Troubleshooting
Most problems fall into four groups: a license message, a basemap that does not load, data that does not draw, or one linked layer that stays empty. Work through them in this order.
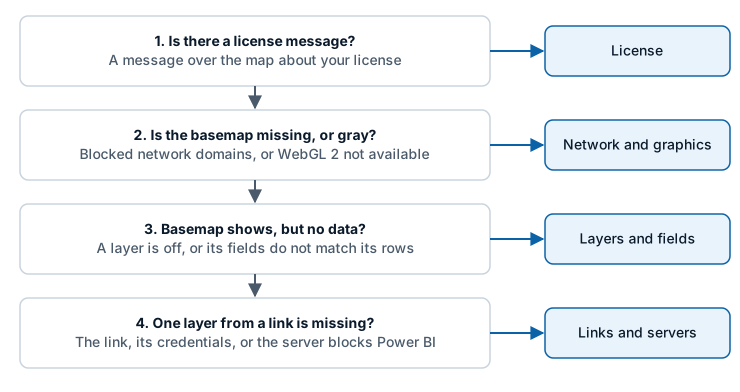
1. The map shows a license message
A message over the map means the visual found no valid license. While you edit a report, the message offers the Get FREE Developer License button and a box for a license key with an Apply Key button.
| You see | Do this |
|---|---|
| "A license is required to use Icon Map Pro" | Get the free developer license, enter a license key, or buy a license |
| "No license configured" | Ask the report owner to assign you a license or add a license key to the report |
| "Unsupported Environment" | The report uses a developer license, which readers cannot use. Request a publish trial or buy a license |
| "Unable to validate license" | The licensing service could not be reached. Check that validate.iconmappro.com and validate2.iconmappro.com are allowed on your network |
| You bought a user license but the message remains | Check the license is assigned to you, then refresh the report or restart Power BI Desktop. It can take up to 30 minutes |
Every message is explained in License keys and activation.
2. The basemap is blank or gray
Blocked network addresses
This is the most common cause in corporate networks. The visual loads its basemap over the internet, and a firewall or proxy server that blocks the address leaves the map empty while the rest of the report works.
For Icon Map basemaps, allow styles.iconmappro.com. The full list, including the addresses for licensing, the Icon Map Catalog and other providers, is in Supported environments and limits.
To confirm a block, open the browser's developer tools (F12) in the Power BI service, select the Network tab, reload the report and look for failed requests to the addresses in that list. Give the failed addresses to your network team.
WebGL 2 is not available
The Modern engine needs WebGL 2. Where it is missing, the map shows the message "WebGL 2 is not available in this environment." and falls back to the Legacy engine for that session.
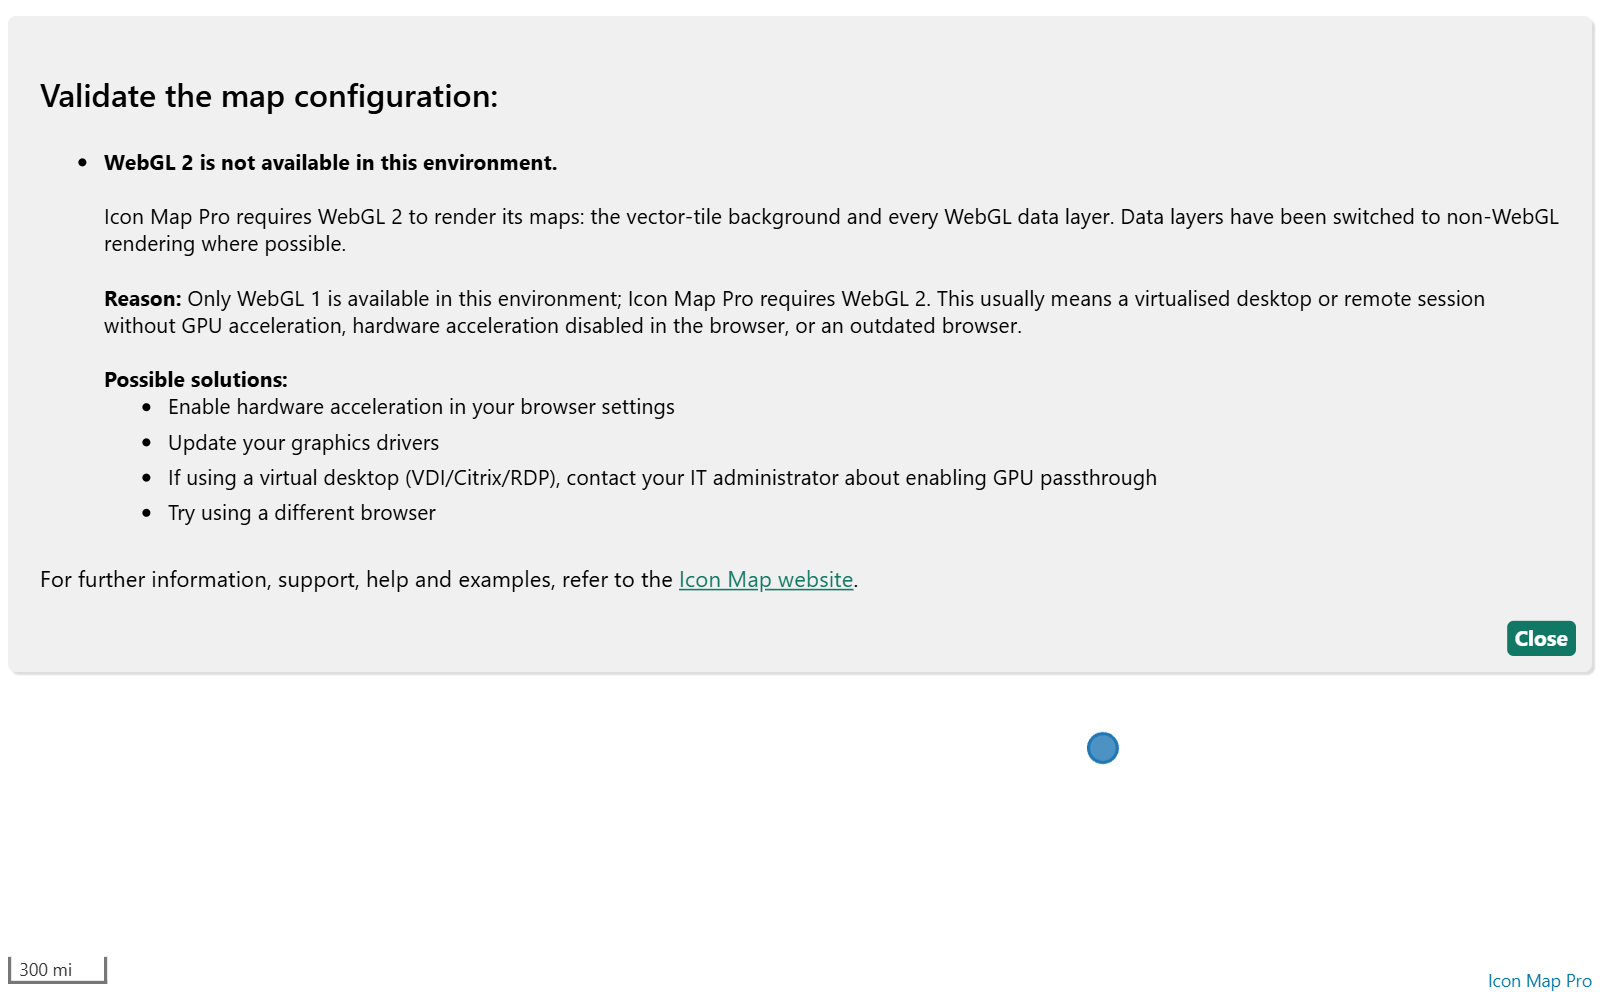
- Enable hardware acceleration in your browser settings.
- Update your graphics drivers.
- On a virtual desktop (VDI, Citrix, RDP), ask your IT administrator about enabling GPU passthrough.
- Try a different browser.
The basemap needs the Legacy engine
A message such as "The Google Maps background requires the Legacy map engine setting. Switch the map engine in Rendering, or choose another background." means the report's saved basemap is one the Modern engine does not draw. Choose another basemap, or switch Rendering > Map engine to Legacy. See Modern and Legacy engines.
A provider key is missing or wrong
Azure Maps, Mappable and Ordnance Survey basemaps need an API key. Check it in API Keys & Authentication > API Keys. See API keys, authentication and the proxy.
The whole visual is replaced by a message from Power BI
"Uncertified visuals from AppSource, or added from a file, are not available due to your admin settings" means your tenant blocks uncertified visuals. A Power BI administrator can add Icon Map Pro as an organizational visual. See Security and certification.
Power BI Report Server shows blank space
On a server without internet access, Power BI tries and fails to reach AppSource. Follow Power BI Report Server (on-premises).
3. The basemap shows but a data layer draws nothing
Each row is drawn by the layer whose fields it fills in. A layer draws nothing when it is switched off, when a field it needs is missing, or when its rows also fill in a field that belongs to another layer.
Open the Data Configuration Summary
Turn on Format pane > Diagnostics > Diagnostic Tools > Show Data Configuration Summary. The summary shows how many rows Power BI sent, how many each layer can draw, and warnings such as a layer that has rows but is switched off.
Check these in turn
| Check | How |
|---|---|
| The layer is switched on | Format pane > Data Layers > Data Layers |
| The visual has an ID | * ID (required) must hold a field. Without it Power BI sends no rows |
| The layer has every field it needs | See Fields reference |
| Its rows leave other layers' fields empty | A column in a field well has a value on every row. Use a measure that returns BLANK() on the rows that belong to another layer. See Combine several layers in one map |
| Longitude and latitude are not summed | Set Longitude (X) and Latitude (Y) to summarize as Average |
| The values are valid | A coordinate out of range, or text where a number is expected, stops a row being drawn |
| Rows are not being cut off | Power BI sends 30,000 rows by default. See Data rows and limits |
| A filter or slicer is not removing every row | Clear the filters on the visual and the page |
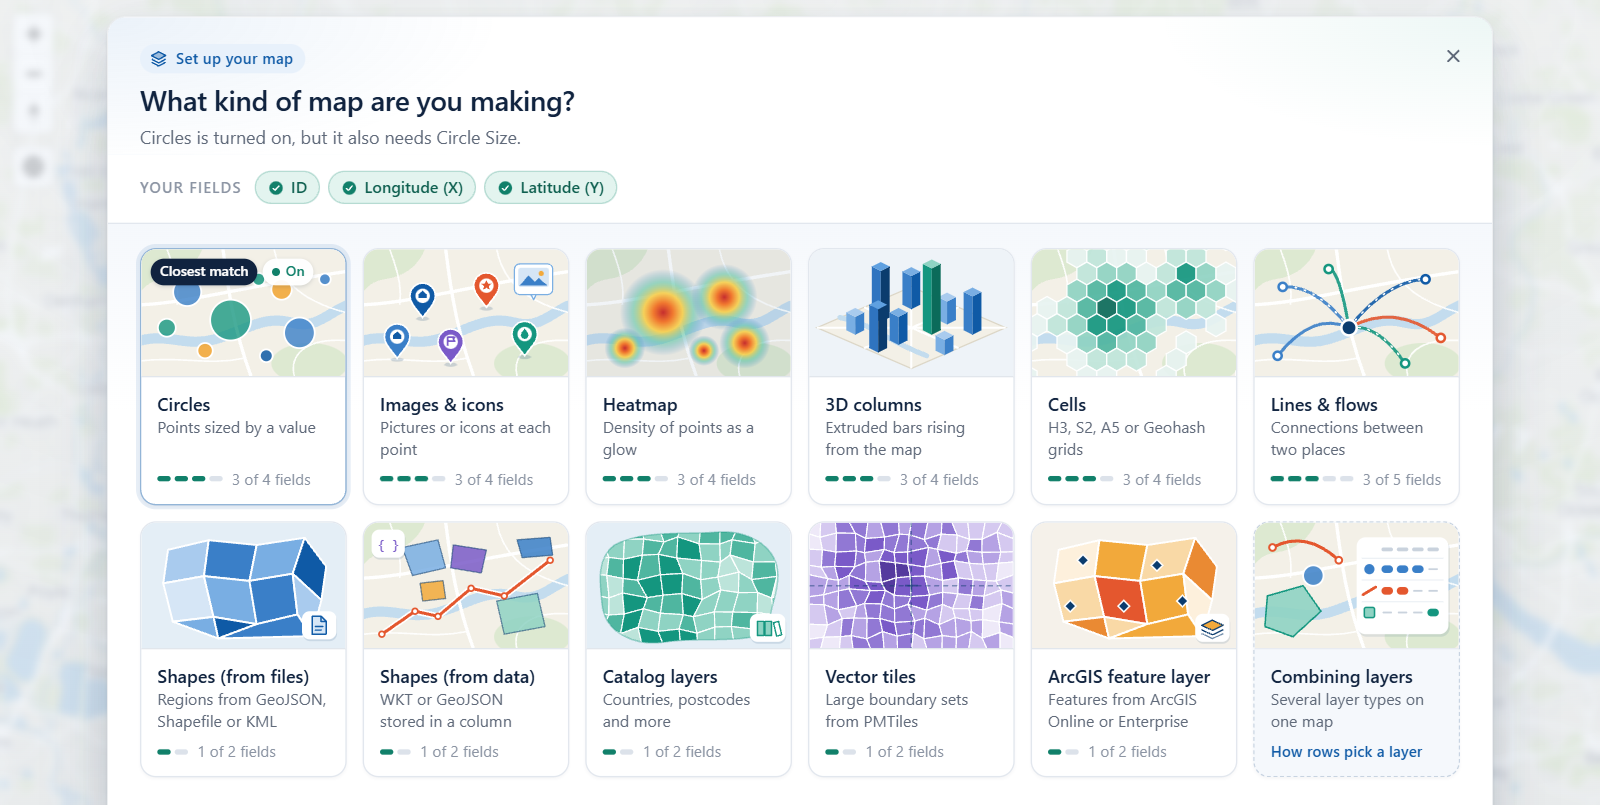
While you edit a map whose rows reach no layer, the "What kind of map are you making?" guide appears over the map and shows which fields each layer type needs. See Choose a layer type.
See what Power BI is sending
To see the values the visual receives, including values from measures, copy the map visual, paste the copy on the same page and change it to a table. The table shows one row per ID with the value of every field.
Shapes from WKT or GeoJSON text are missing
Power BI can hold 32,766 characters in one text value. A longer shape is cut off and cannot be drawn. Check the length with a measure such as WKT Length = LEN ( MAX ( 'Table'[WKT Column] ) ), and see Shapes from data (WKT and GeoJSON) for ways to shorten shapes.
4. One layer from a link stays empty
A layer that comes from a link, such as a GeoJSON file, a tile server, a WMS or an ArcGIS service, depends on a server the visual must be able to read.
| Cause | How to tell | Fix |
|---|---|---|
| The server does not allow Power BI (CORS) | The link opens in a browser, but the layer is empty in the map | Allow CORS on the server for an origin of * or null, or use the Icon Map proxy |
| The link is not reachable | The link does not open from the machine showing the report | Check the address, VPN and firewall |
| The credential is missing or expired | The server asks for a sign-in, or returns an error such as "Invalid Token" | Check API Keys & Authentication. For "Invalid Token" from ArcGIS Enterprise, set Send Credential As to Authorization Header (Bearer) |
| The join does not match | Shapes appear but are not colored by your data | Check that Feature Reference values match the property you chose in the layer's settings |
Power BI runs custom visuals in a sandbox, so a server has to allow requests from it explicitly. That is why a link can work in a browser tab and fail in the map.
For a WMS reference layer on a server that does not allow CORS, you can turn on Use CORS Proxy in the layer's settings. See API keys, authentication and the proxy for what the proxy is and what passes through it.
Other problems
A fix or feature in the release notes is not there
Check the version that is running in Format pane > Icon Map Pro. Power BI uses the version AppSource has published, which can lag behind the newest release. See Release notes.
Tooltips or selection do nothing
Tooltips and selection are inactive where Power BI does not allow interaction with visuals, such as in exports. For layers, check Include Tooltip and Selectable in the layer's settings. See Selection, cross-filtering and highlighting.
The visual is in the wrong language
The visual follows the report's language. See Languages.
The Icon Map Catalog card is missing
Icon Map Pro > Customization > Airgapped Environment is on. It hides the catalog because the catalog needs internet access.
Still stuck?
Get support. Include the version number, where the report is running, and what you have already checked.