
Tooltips
A tooltip appears when a reader points at an item on the map. Icon Map Pro uses Power BI's own tooltips, so they look and behave like the tooltips on every other visual in the report, including report page tooltips.
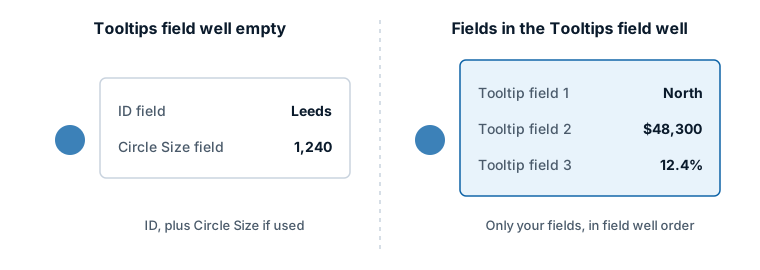
Default tooltips
With nothing in the Tooltips field well, the tooltip of a data item shows:
- the ID field, with its name and value
- the Circle Size field, with its name and value, when the row has one
Add your own fields
- Select the map.
- In the Build pane, drag one or more fields or measures into the Tooltips field well.
The tooltip now lists only those fields, one line each, in the order they sit in the field well. Each value is shown in the format you gave the field in Power BI, including a measure's dynamic format string. A field with no value on a row is left out of that row's tooltip.
Once you add a field to Tooltips, the ID is no longer shown by default. Add the ID field to Tooltips as well if you still want it.
Report page tooltips
Icon Map Pro supports Power BI report page tooltips. Build a tooltip page in your report, then select the map and set Format pane > General > Tooltips > Type to Report page and choose the page. When a reader points at an item, Power BI filters the tooltip page to that item's row.
Turn tooltips off for a layer or a row
Each data layer has its own tooltip switch in the Data Layers card of the Format pane.
| Layer | Setting | Default |
|---|---|---|
| Circles, Images and icons, Lines, shapes, 3D columns | Include Tooltip: Yes or No. Takes conditional formatting (fx), so a measure can switch tooltips off for some rows. | Yes |
| Clusters | Show Tooltips | On |
| Cells | Include Tooltips | Off |
| Heatmap | No tooltips. |
Clusters
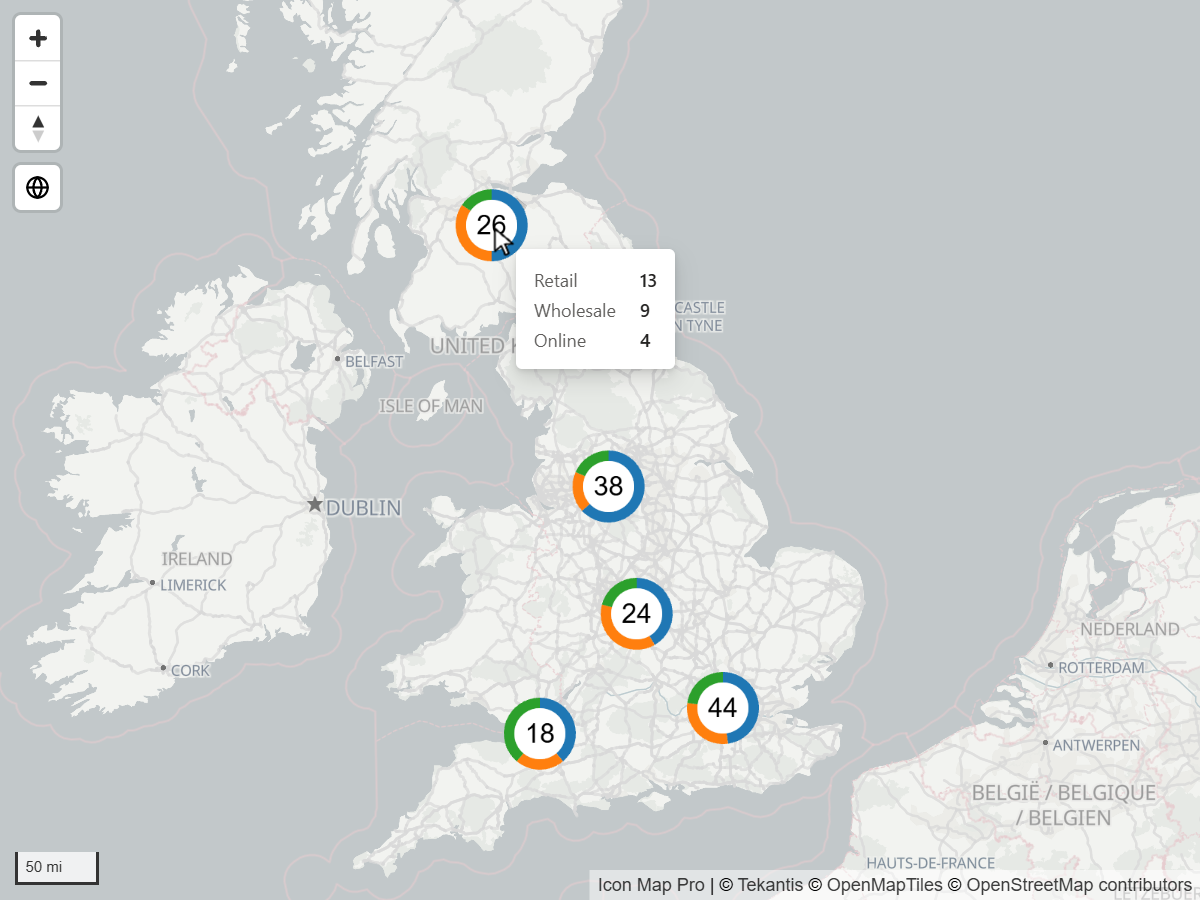
When circles are clustered and Show Tooltips is on, pointing at a cluster shows:
- one line for each value of the Cluster Group field, with its count in the cluster
- then, if you use a second Cluster Group field, a blank line followed by a line for each of its values
- with no Cluster Group field, a single line, Count, with the number of points in the cluster
The tooltip updates as the pointer moves from one cluster to the next. See Clusters.
Cells and other aggregates
A cell built from many points (H3, S2, A5, Geohash or Custom shapes) stands for several rows, so its tooltip shows aggregated values. Switch on Include Tooltips in the Cells settings first; it needs the Cell (H3/S2/A5/Geohash) Weight field.
- With fields in Tooltips, each field is aggregated across the rows in the cell, using the summarization you chose for the field in Power BI: Sum, Average, Minimum, Maximum, Count, Count (Distinct), First, Last or Median. If none is set, numbers are summed and text shows the first value.
- With no fields in Tooltips, the tooltip shows the name of the weight field and the cell's value.
A cell that comes from a cell ID in your data is one row, so it has an ordinary row tooltip.
Aggregate tooltips only ever show fields from your report. The map does not add counts or totals of its own.
Shapes joined to a file
For Shapes from files, the tooltip of a matched shape is its row's tooltip. You can add the shape's own properties from the file:
| Setting | What it does | Default |
|---|---|---|
| Add Property to Tooltip | Adds the property used to match the shape to your data. | Off |
| Add All Properties to Tooltip | Adds every property of the shape. | Off |
| Add Tooltips to Unmatched Shapes | Gives shapes with no matching row a tooltip made of their file properties. It shows something only when one of the two settings above is also on. | Off |
Properties that only describe styling, such as fill and outline colors, are never listed.
Several items under the pointer
When items overlap, Format pane > Interactivity > Tooltips > Combine Tooltips decides what the tooltip shows.
| Combine Tooltips | Result |
|---|---|
| Off (default) | One line per field, with the value from the top item. |
| On | One line per field, with the different values from every item under the pointer, separated by commas. |
Reference layers
Reference layers are not joined to your data, so their tooltips come from the layer itself.
- Files and feeds (GeoJSON, KML, CSV, WFS): switch on Show Tooltips for the layer. The tooltip lists every property of the feature, or only the ones you name in Tooltip Property (1) and Tooltip Property (2), each with an optional title. See Files and feeds.
- ArcGIS layers: switch on Include Tooltips, and optionally name a Tooltip Field and Tooltip Title. See ArcGIS layers.
- Icon Map Catalog layers: tooltips are set up in the catalog window. See Icon Map Catalog layers.
- Raster tiles, weather and traffic layers have no tooltips.
Tips and limits
- Tooltips are plain text. To show a picture or a formatted card on hover, use a data label with Label Visibility set to On mouse over, or a report page tooltip.
- The tooltip follows the pointer and closes when the pointer leaves the item.
- Tooltips only appear where Power BI allows interaction with the visual.