
Shapes from data (WKT and GeoJSON)
This layer draws shapes whose geometry is held in your data as text: Well-Known Text (WKT) or GeoJSON. Use it when your boundaries, routes or assets come from a database or change over time, so the map always shows the shapes in the current data.
What you need
Each row is one shape. Add these fields to the visual:
| Field well | What to put in it |
|---|---|
| ID | A unique value for each shape. |
| Image / WKT / GeoJSON | The geometry of the shape as WKT or GeoJSON text. |
Add fields to Tooltips if you want them.
These fields must be empty on a shape's row, otherwise the row belongs to another layer and the shape is not drawn: Longitude (X), Latitude (Y), Destination Longitude, Destination Latitude, Circle Size, Heatmap Weight, Cell (H3/S2/A5/Geohash) Weight and Feature Reference. See Combine several layers in one map.
A row of data looks like this:
| ID | Image / WKT / GeoJSON |
|---|---|
| North | POLYGON ((-2.6 53.5, -2.1 53.5, -2.1 53.2, -2.6 53.2, -2.6 53.5)) |
| Pipeline 4 | LINESTRING (-1.9 52.5, -1.7 52.6, -1.5 52.6) |
| Depot | {"type":"Point","coordinates":[-1.55,53.8]} |
Add the layer
- Add ID and Image / WKT / GeoJSON to the visual.
- In the Format pane, expand Data Layers. In the Data Layers group, turn on Shapes (from data) WKT / GeoJSON features.
- In the Shapes (from data) - Formatting group, set Fill Color, Outline Color and Outline Width. Use conditional formatting (fx) to color each shape from your data.
Text formats
Each row holds one complete geometry.
WKT
The text must start with one of these geometry types and end with a closing parenthesis:
POINT, MULTIPOINT, LINESTRING, MULTILINESTRING, POLYGON, MULTIPOLYGON, GEOMETRYCOLLECTION
Upper or lower case both work. A geometry that contains the word EMPTY, such as POLYGON EMPTY, is skipped.
Text that starts with SRID=4326; is not recognized, because it does not start with a geometry type. Remove the prefix and use the EPSG setting instead. Also remove anything after the final parenthesis, including trailing spaces.
GeoJSON
Text that starts with { is read as GeoJSON. Each row can hold:
- A geometry object, such as
{"type":"Polygon","coordinates":[...]}. - A Feature, such as
{"type":"Feature","geometry":{...},"properties":{...}}. The geometry is drawn. The Feature's own properties are not used.
A FeatureCollection is not accepted. Put one geometry or Feature on each row.
What is drawn
| Geometry | Drawn as |
|---|---|
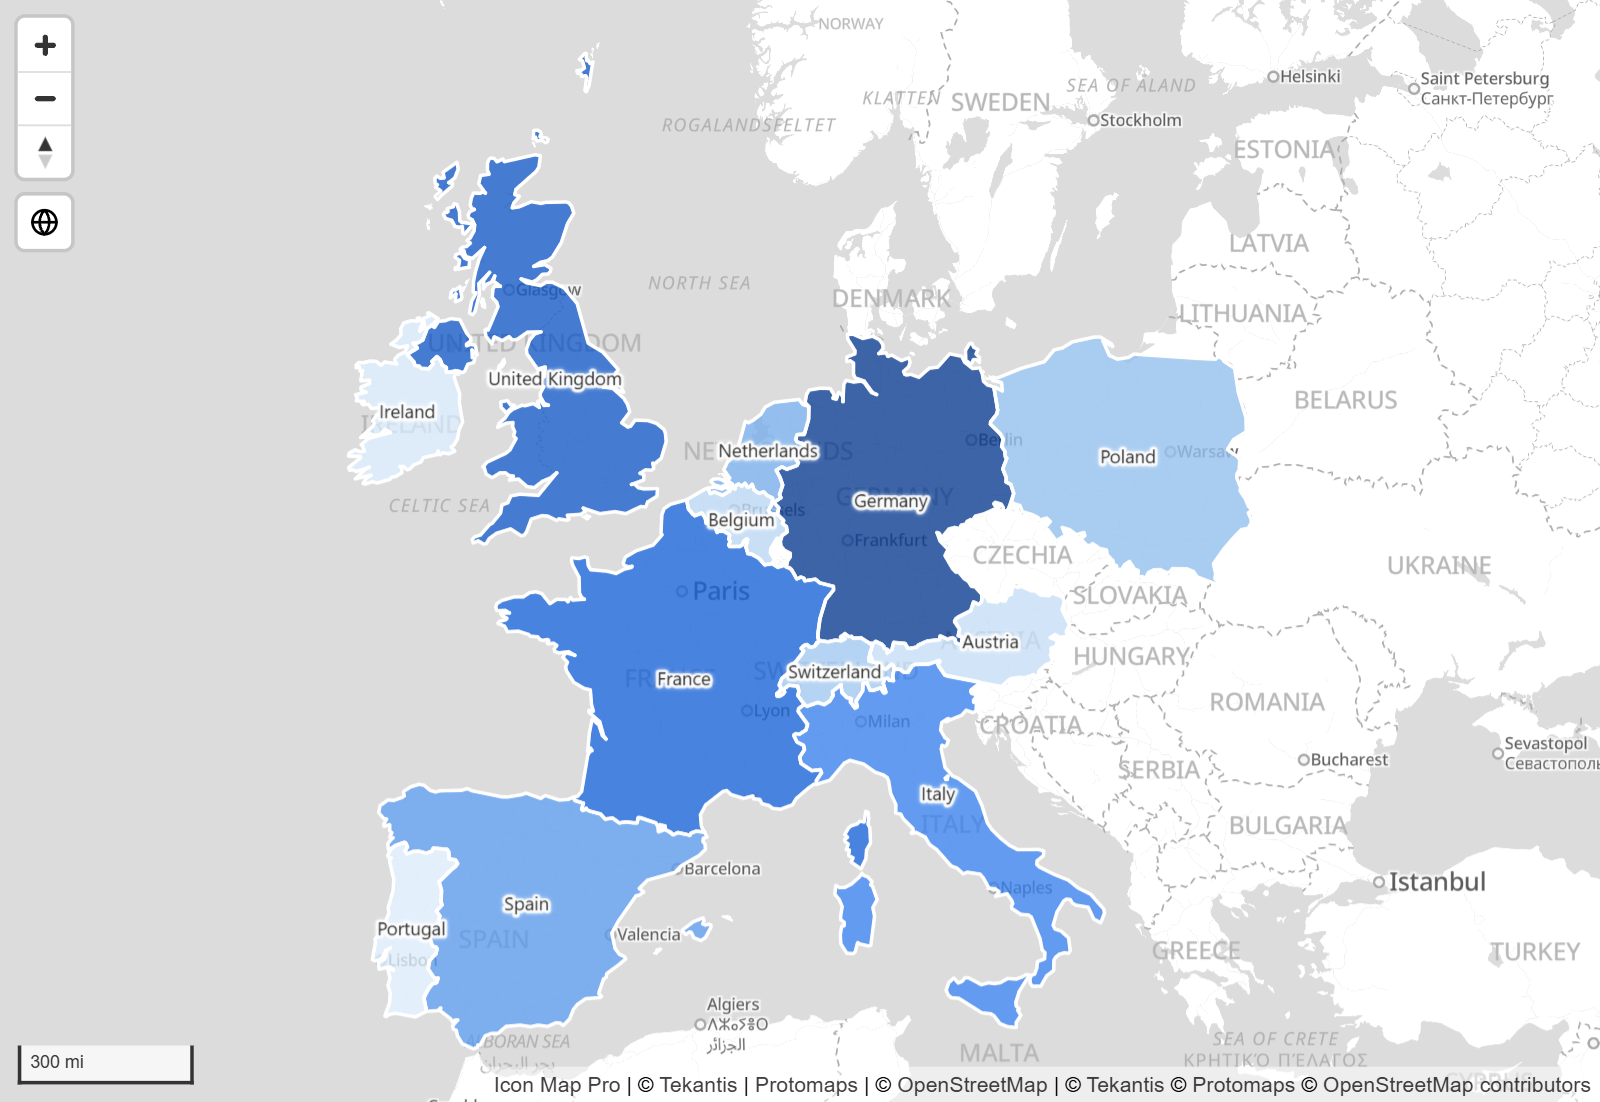
| Point, MultiPoint | A circle, pin, icon or image. See Points. |
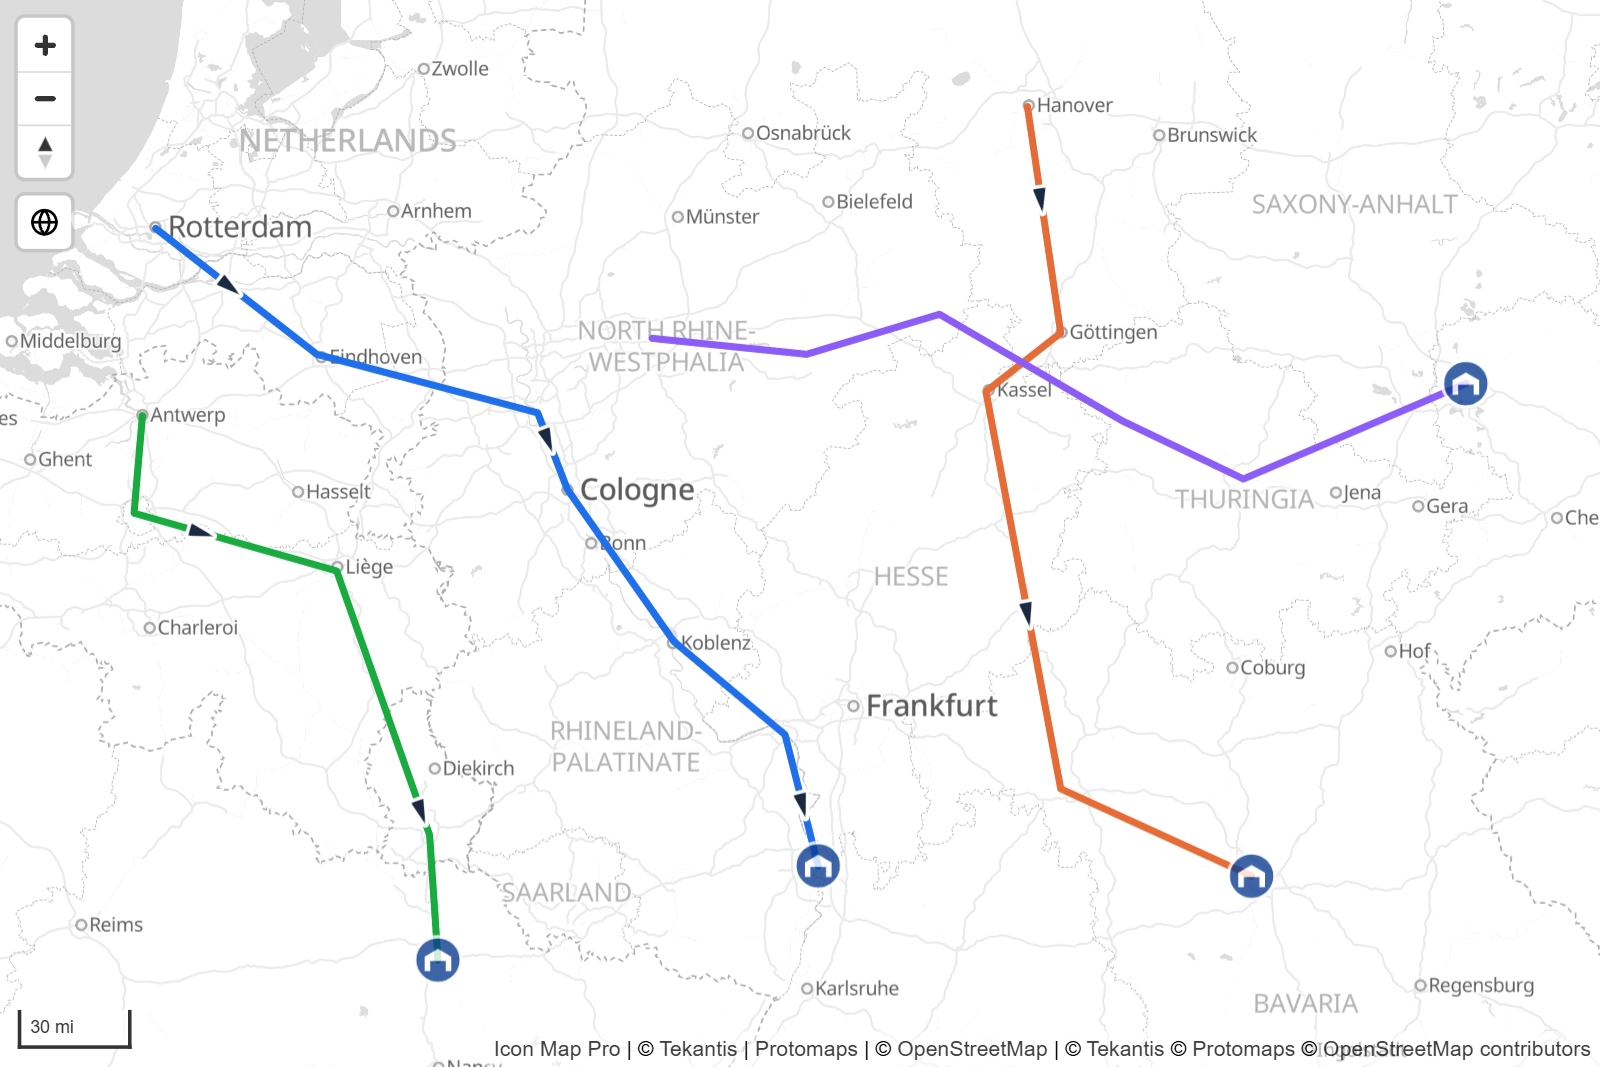
| LineString, MultiLineString | A line. See Lines. |
| Polygon, MultiPolygon | A filled shape with an outline, or a 3D extrusion. See Polygons. |
| GeometryCollection | Each geometry in the collection. |
A third number on each coordinate (a Z value) is accepted and ignored.
A row whose text cannot be read is skipped. No message is shown on the map, so if shapes are missing, check the text of those rows first.
The 32,766 character limit
Power BI stores at most 32,766 characters in a text value. A detailed shape can be longer than that. Power BI then cuts the text short, the geometry is no longer valid, and the row is skipped.
There are three ways to deal with this. You can combine them.
Simplify the shapes before they reach Power BI. Detailed boundaries rarely need every vertex on a report map. Simplify them in a GIS tool, or in the source database. For example, SQL Server has Reduce() and PostgreSQL has ST_SimplifyPreserveTopology():
-- SQL Server, Azure SQL
SELECT shape_name, wkb_geometry.MakeValid().Reduce(100).STAsText() AS wkt FROM shapes

-- PostgreSQL
SELECT shape_name, ST_AsText(ST_SimplifyPreserveTopology(geom, 100)) AS wkt FROM shapes
Reduce the number of decimal places. Coordinates are often stored with far more decimal places than a map needs. In PostgreSQL, ST_SnapToGrid(geom, 0.001) rounds them.
Split the text across rows and join it with a measure. A column holds 32,766 characters, but a DAX measure can return much longer text.
- In Power Query, select the geometry column, then Split Column > By Number of Characters. Enter 32000 and, under the advanced options, split into Rows.
- Add an index column so the pieces keep their order.
- Create a measure that joins the pieces back together:
Combined WKT =
CONCATENATEX ( Shapes, Shapes[geom], "", Shapes[chunk_order] )
- Use the shape's code or name for ID and the measure for Image / WKT / GeoJSON.
Very large shapes are slow to send and draw. For large boundary sets, consider Shapes from files, Vector tiles or Icon Map Catalog layers instead.
Coordinate systems
By default coordinates are longitude then latitude in decimal degrees (EPSG 4326). If your shapes use another coordinate system, enter its EPSG number in Format pane > Data Layers > Shapes (from data) - Configuration > EPSG, for example 27700 for British National Grid. Enter the number only. About 3,900 EPSG codes are built in. The setting applies to WKT and GeoJSON text alike. It is not available when the basemap is a custom image.
Points
Show Points As sets how every Point and MultiPoint in the layer is drawn:
| Option | What it draws | Settings |
|---|---|---|
| Circle | A circle, using the layer's fill and outline. | Circle Size |
| Pin | A map pin of a fixed size. | None |
| Icon from Icon Library | An icon from the icon library, in a color you choose. | Icon Name, Icon Size, Icon Color. Turn on Show Icon Library to search the library and pick an icon. |
| Image | An image from a URL. | Image URL, Image Size |
Lines
Lines are drawn with the Outline Color, Outline Width and Outline Transparency.
- Linestring Shape changes how a line runs between its points. Straight draws the line as supplied. Smoothed replaces it with a smooth curve that passes through every point. Bezier uses the first and last points as the ends and the points between as control points, so the curve bends toward them without passing through them. Routes draws lines that share a street side by side, see Routes. Smoothed and Bezier apply to WKT
LINESTRINGandMULTILINESTRINGtext. - Color Type set to Gradient colors every line from Gradient Color 1 at its start to Gradient Color 2 at its end.
- Invisible Line Width adds a hidden, wider line under each line that takes clicks and tooltips, so thin lines are easier to select.
- Image URL at Linestring Start and Image URL at Linestring End place an image at the first or last point of a line. Each has its own rotation, width and height. They take an
https://image URL, a data URI or SVG markup. Start Image Pitch Alignment and End Image Pitch Alignment decide what happens when the map is tilted: Map lays the image flat on the map, Viewport keeps it upright. - Include Line Symbol draws text or a character, such as an arrow, along each line. The options are the same as for the Lines layer.
Dash patterns for this layer are part of the Legacy engine, see the documentation for 1.1.0.9 and earlier.
Polygons
Polygons take the Fill Color, Fill Transparency and the outline settings. Each accepts conditional formatting, so you can color every shape by a measure.
Fill Style has three options:
- Solid - the fill color.
- Hatched - diagonal stripes in the fill color. Hatch Width sets the width of the stripes.
- Pattern - a repeating pattern or image. Enter a pattern name or an
https://image URL in Pattern / Image URL, or turn on Show Pattern Library to pick one. Patterns from the library take the fill color.
3D extrusion
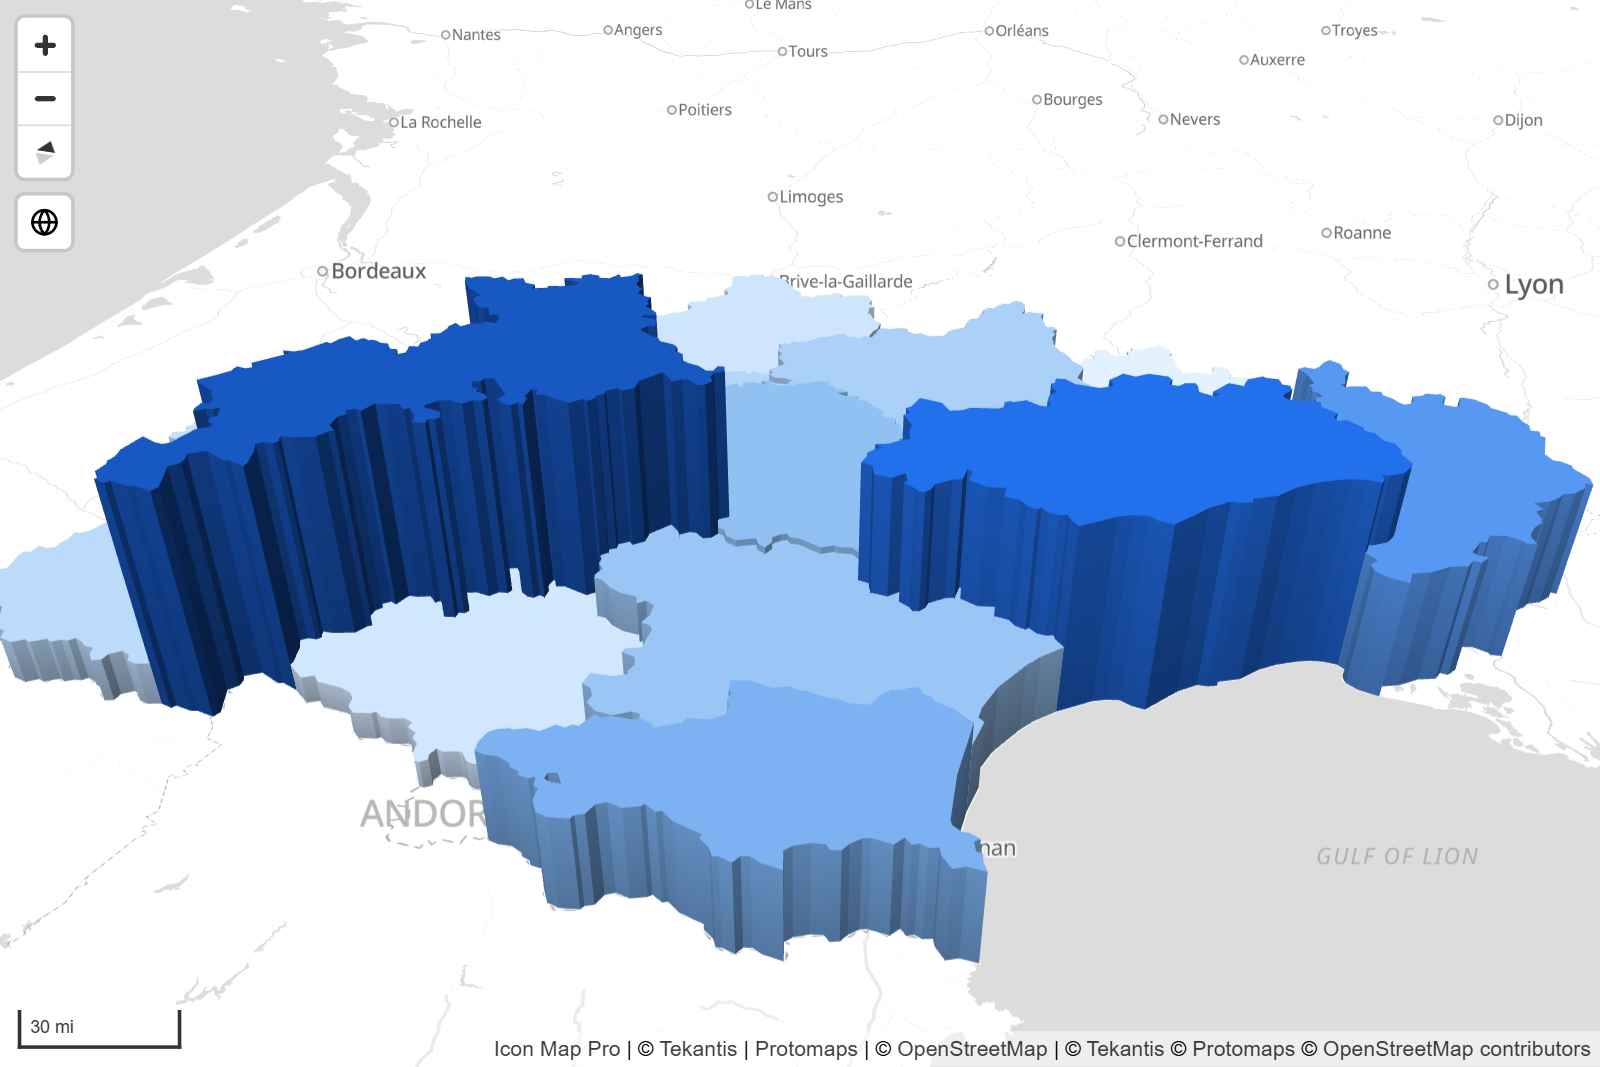
Polygon Extrusion Height raises a polygon into a 3D block, in meters. Polygon Extrusion Base Height sets the height it starts from, so a shape can float above the ground. Both accept conditional formatting, so the height can come from a measure. A polygon with a height of 0 or blank stays flat.
Tilt the map to see the height. See View, zoom and projection. Extruded polygons are drawn in a solid color: Fill Style does not apply to them.
The Polygon Extrusion Height box in the Format pane accepts 0 to 1000. Shapes the size of a region need larger heights to show. Set those with conditional formatting (fx), which is not limited.
Selection, tooltips and labels
- Click a shape to select its row and cross-filter the rest of the report. Hold Ctrl to add to the selection. The other shapes are dimmed. Set Selectable to No to turn this off. See Selection, cross-filtering and highlighting.
- Pointing at a shape shows the fields in Tooltips. Set Include Tooltip to No to turn tooltips off.
- Each shape can carry a data label. See Data labels.
- Shapes with Include in Auto Zoom set to Yes are included when the map zooms to fit your data.
Settings
All settings are in Format pane > Data Layers. Settings marked fx accept conditional formatting.
Shapes (from data) - Configuration
| Setting | What it does | Default |
|---|---|---|
| Include in Auto Zoom | Includes the shapes when the map zooms to fit your data. fx | Yes |
| Include Tooltip | Shows tooltips on shapes. fx | Yes |
| Selectable | Lets report users select shapes. fx | Yes |
| Show Points As | Pin, Icon from Icon Library, Image or Circle. | Circle |
| Circle Size | Circle radius in pixels, 0 to 500. Shown for Circle. fx | 5 |
| Image URL | The image to draw at each point. Shown for Image. fx | Empty |
| Image Size | Size of the image, 0 to 500. Shown for Image. fx | 5 |
| Icon Name | The icon library name of the icon. Shown for Icon from Icon Library. fx | Empty |
| Show Icon Library | Opens the icon library so you can pick an icon. | Off |
| Icon Size | Size of the icon, 0 to 200. fx | 5 |
| Icon Color | Color of the icon. fx | #000000 |
| Invisible Line Width | Width of a hidden line that makes narrow lines easier to click. fx | 5 |
| Polygon Extrusion Height | Height to extrude polygons, in meters, 0 to 1000. fx | 0 |
| Polygon Extrusion Base Height | Height the extrusion starts from, in meters. fx | 0 |
| Linestring Shape | Straight, Smoothed, Bezier or Routes. fx | Straight |
| Image URL at Linestring Start | Image at the first point of each line. fx | Empty |
| Start Image Rotation | Rotation in degrees, 0 to 360. fx | 0 |
| Start Image Width, Start Image Height | Size in pixels, 0 to 1000. fx | 30 |
| Start Image Pitch Alignment | Map or Viewport. | Map |
| Image URL at Linestring End | Image at the last point of each line. fx | Empty |
| End Image Rotation | Rotation in degrees, 0 to 360. fx | 0 |
| End Image Width, End Image Height | Size in pixels, 0 to 1000. fx | 30 |
| End Image Pitch Alignment | Map or Viewport. | Map |
| Minimum Zoom | The layer is hidden when the map is zoomed out past this level. | 0 |
| Maximum Zoom | The layer is hidden when the map is zoomed in past this level. | 24 |
| Z Index | Position in the drawing order. Layers with a higher value draw on top. | 400 |
| EPSG | The coordinate system of the geometry. | 4326 |
When Linestring Shape is Routes, the card also shows Route Name, Merge Distance (m), Route Outline Color, Route Outline Width and Route Badges. See Routes.
Shapes (from data) - Formatting
| Setting | What it does | Default |
|---|---|---|
| Color Type | Solid or Gradient, for lines. | Solid |
| Gradient Color 1, Gradient Color 2 | Colors at the start and end of each line. Shown for Gradient. | #0000FF, #FF0000 |
| Outline Color | Color of lines and polygon outlines. Shown for Solid. fx | Theme color |
| Outline Transparency | 0 is solid, 100 is invisible. fx | 0 |
| Outline Width | Width in pixels, 0 to 100. fx | 2 |
| Fill Color | Fill color of polygons and circles. fx | Theme color |
| Fill Transparency | 0 is solid, 100 is invisible. fx | 20 |
| Fill Style | Solid, Hatched or Pattern. fx | Solid |
| Hatch Width | Width of the stripes. Shown for Hatched. fx | 2 |
| Pattern / Image URL | The pattern or image for Pattern. fx | Empty |
| Show Pattern Library | Opens the pattern library so you can pick a pattern. | Off |
| Include Line Symbol | Draws text along each line. fx | No |
| Line Symbol Text | The text or character to draw. fx | ► |
| Line Symbol Color | Color of the symbol. fx | Theme color |
| Line Symbol Size | Size of the symbol, 1 to 100. fx | 20 |
| Line Symbol Repeat | Repeats the symbol along the line. No draws it once at the center. fx | Yes |
| Line Symbol Orientation | Keep Upright or With Line Direction. | With Line Direction |
| Symbol Halo Color | Color of the outline around the symbol. fx | #FFFFFF |
| Symbol Halo Width | Width of the halo, 0 to 100. fx | 0 |
| Symbol Halo Blur | Blur of the halo, 0 to 100. fx | 0 |
Tips and limits
- A map has one Shapes (from data) layer. It can hold points, lines and polygons together.
- Show Points As is one choice for the whole layer.
- Each row is one geometry. Geometry cannot be spread across several columns.
- The same field well, Image / WKT / GeoJSON, also feeds the Images and icons layer. A row with an image and coordinates is an image. A row with WKT or GeoJSON text and no coordinates is a shape.
- The visual receives 30,000 rows by default. See Data rows and limits.