
Spatial Cells (H3, S2, A5 and Geohash)
Icon Map Slicer can render spatial grid cells directly on the map without having to provide the polygon geometries. Four grid systems are supported:
- H3 - Uber's hexagonal hierarchical grid. Resolutions 0 to 15.
- S2 - Google's spherical cell grid. Levels 0 to 30.
- A5 - a pentagonal equal-area grid. Resolutions 0 to 30.
- Geohash - the classic base-32 string grid. Precisions 1 to 12.
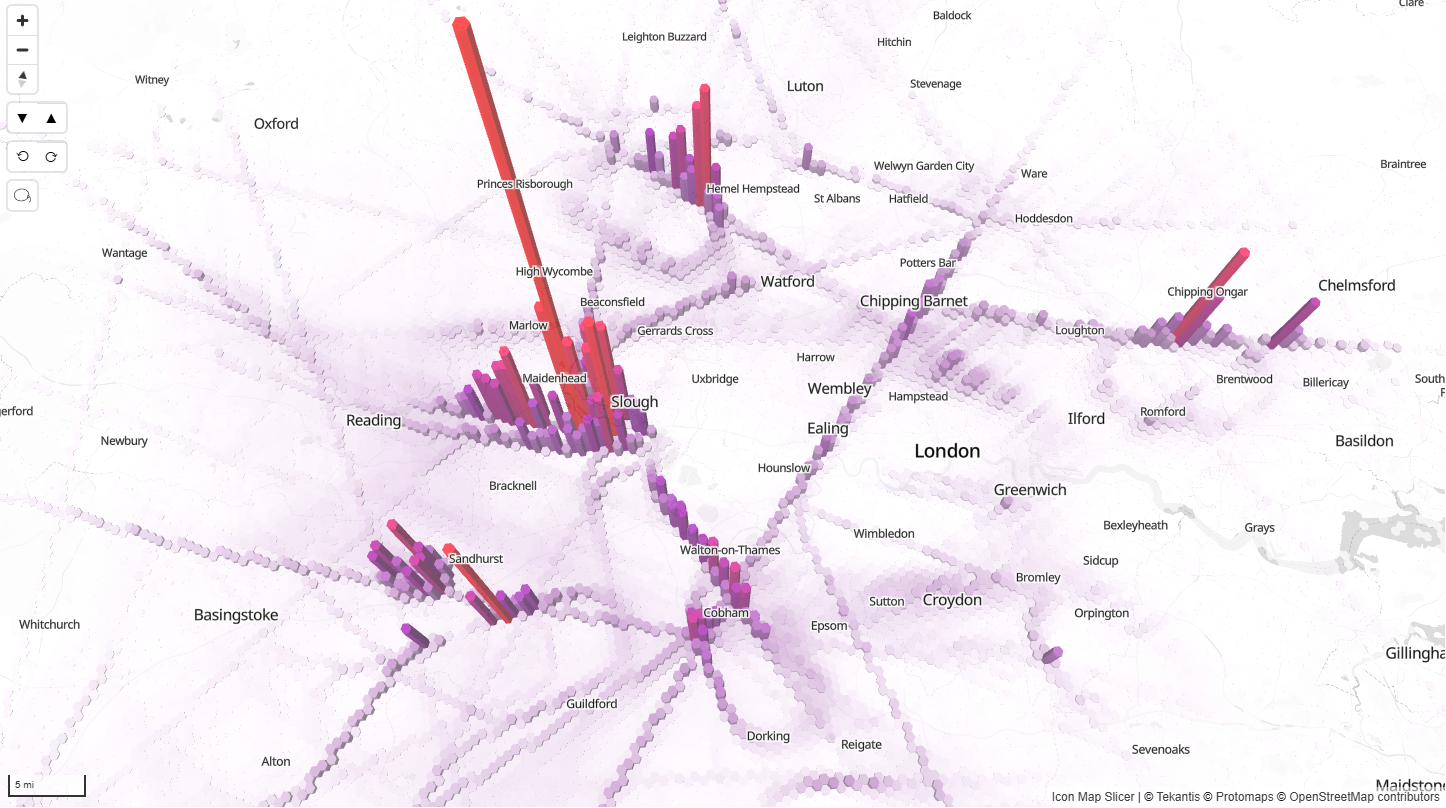
There are two ways that cells can be used within Icon Map Slicer, and both work the same way for every grid system:
- Cluster from raw points – Use Icon Map Slicer to group up to 480,000 rows of longitude and latitude data into cells, coloring them by the aggregated values.
- Display pre-processed cells – Generate the cell IDs and aggregated values in advance, then load into Power BI for rendering in Icon Map Slicer.
Reports built with earlier versions carry on working unchanged: the H3 options are the defaults, and the layer is still switched on with the same toggle in the Data Layers card.
Data Setup
Clustering performed by Icon Map Slicer
The following field configuration is required for Icon Map Slicer to cluster into cells:
- ID – A unique ID for that location.
- Longitude
- Latitude
- Cell Weight – A numeric value relating to that location. The values for the locations within each cell are aggregated within the visual (sum by default) to result in a final value for that cell.
Sample data
| ID | Longitude | Latitude | Destination Longitude | Destination Latitude | Circle Size | Cluster Group | Cell Weight | Heatmap Weight | Image / WKT / GeoJSON | Feature Reference | Feature Weight |
|---|---|---|---|---|---|---|---|---|---|---|---|
| ID1 | -2.576 | 51.481 | null | null | null | null | 62 | null | null | null | null |
| ID2 | -2.576 | 51.481 | null | null | null | null | 88 | null | null | null | null |
| ID3 | -2.955 | 51.332 | null | null | null | null | 45 | null | null | null | null |
| ID4 | -2.155 | 51.632 | null | null | null | null | 51 | null | null | null | null |
Display of pre-processed cells
If your dataset already contains cell IDs:
- ID – The cell ID, in the format matching the Source option you choose (see the table below).
- Cell Weight – A numeric value relating to that specific cell.
| Grid system | Source option | ID format | Example |
|---|---|---|---|
| H3 | H3 Indexes as ID (hex) | 15 character hex index | 85283473fffffff |
| H3 | H3 Indexes as ID (64bit integers) | the same index as a 64-bit integer | 599686042433355775 |
| S2 | S2 Cell IDs (64bit integers) | 64-bit S2 cell ID | 5221431186726846464 |
| S2 | S2 Cell tokens (hex) | S2 hex token | 48764 |
| A5 | A5 Cell IDs (64bit integers) | 64-bit A5 cell ID, or 0x-prefixed hex |
7156079070403362816 |
| Geohash | Geohashes as ID | base-32 geohash string | gcpvj0 |
Load H3 integer, S2 and A5 cell IDs into Power BI as Text columns. Power Query's default Decimal Number type rounds values above 2^53 and the cell will not be found. S2 tokens can also consist only of digits (for example 487605), so keep those as text too.
Cell IDs that cannot be parsed for the selected grid system are skipped rather than drawn.
Sample data
| ID | Longitude | Latitude | Destination Longitude | Destination Latitude | Circle Size | Cluster Group | Cell Weight | Heatmap Weight | Image / WKT / GeoJSON | Feature Reference | Feature Weight |
|---|---|---|---|---|---|---|---|---|---|---|---|
| 85283473fffffff | null | null | null | null | null | null | 62 | null | null | null | null |
| 8528347bfffffff | null | null | null | null | null | null | 88 | null | null | null | null |
Cell Configuration
Enable Cells in the Data Layers formatting options to reveal the Cell Configuration and Cell Formatting cards.
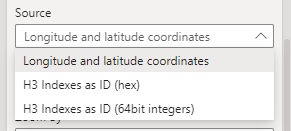
Source
The Source dropdown selects both the grid system and whether Icon Map Slicer should cluster your Longitude and Latitude coordinates or use cell IDs directly from your dataset:
- H3 from Longitude and latitude coordinates
- H3 Indexes as ID (hex)
- H3 Indexes as ID (64bit integers)
- S2 from Longitude and latitude coordinates
- S2 Cell IDs (64bit integers)
- S2 Cell tokens (hex)
- A5 from Longitude and latitude coordinates
- A5 Cell IDs (64bit integers)
- Geohash from Longitude and latitude coordinates
- Geohashes as ID
Aggregation Type
(Only displayed for the from Longitude and latitude coordinates sources)
How the Cell Weight values of the locations within each cell are combined: Sum (the default), Count, Average, Min or Max.
Resolution Method
(Only displayed for the from Longitude and latitude coordinates sources)
- Fixed – every cell uses the single Resolution below.
- Based on Zoom – cells are generated at every resolution from the Start Resolution to the End Resolution, and the map switches between them as you zoom between the Start Resolution Zoom Level and the End Resolution Zoom Level.
Resolution
(Only displayed for the from Longitude and latitude coordinates sources)
A numeric value representing the size of the cells. The valid range depends on the grid system: H3 0 to 15, S2 levels 0 to 30, A5 0 to 30 and Geohash precisions 1 to 12. A value outside the range of the selected system is clamped to it. Can be controlled dynamically via conditional formatting.

Zoom By
(Only displayed for the from Longitude and latitude coordinates sources)
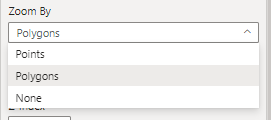
- Polygons – Auto zoom based on the full cell area.
- Points – Auto zoom based on the underlying coordinates.
- None – Cells are excluded from auto zoom.
Selectable
Controls whether cells can be selected for cross-filtering or cross-highlighting other visuals.

- With the from Longitude and latitude coordinates sources, selection is based on the underlying location IDs.
- With the cell ID sources, selection is based on the cell IDs.
Include Tooltips
Whether to show a tooltip with the aggregated value for the cell. Columns in the Tooltips field are aggregated per cell.
Show data labels
Whether to label each cell with its aggregated value (coordinate sources) or the labels field (cell ID sources), using the shared Labels formatting.
EPSG (Coordinate Reference System)
Specifies the coordinate reference system for longitude/latitude data. Default is 4326 (WGS84). Other EPSG codes can be used, such as 27700 for British National Grid.
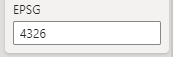
Available for all of the from Longitude and latitude coordinates sources; not available when using cell IDs.
Cell Formatting options
Use Power BI Formatting
(Available when cells are shown based on the ID field)
Switches from the Start/Mid/End color gradient to Power BI conditional formatting for Fill and Outline colors.
Note: Power BI conditional formatting is not recommended for datasets over 30,000 rows.
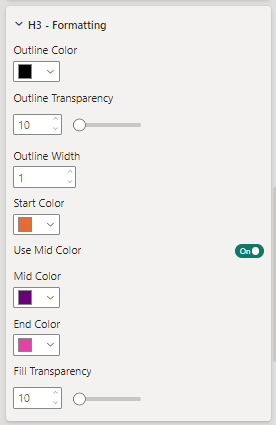
Outline Color
The color of the cell borders.
Outline Transparency
The transparency of the cell borders.
Outline Width
The width of the borders in pixels (can be decimal).
Start Color
The color for the lowest value cells.
Use Mid Color
Enables a three-color gradient.
End Color
The color for the highest value cells.
Fill Transparency
Transparency of the cell fill.
Specify Values
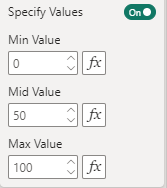
Manually define the numeric breakpoints for Start, Mid, and End colors. Supports DAX measures for dynamic control.
Extrude Cells
Adds 3D height to cells based on their values. For the coordinate sources, Min Extrusion Height and Max Extrusion Height set the columns for the lowest and highest values. For the cell ID sources, Extrusion Start Height and Extrusion End Height set the base and the top of the column for the highest value, and can be driven per cell by conditional formatting.