
Vector tiles over the basemap
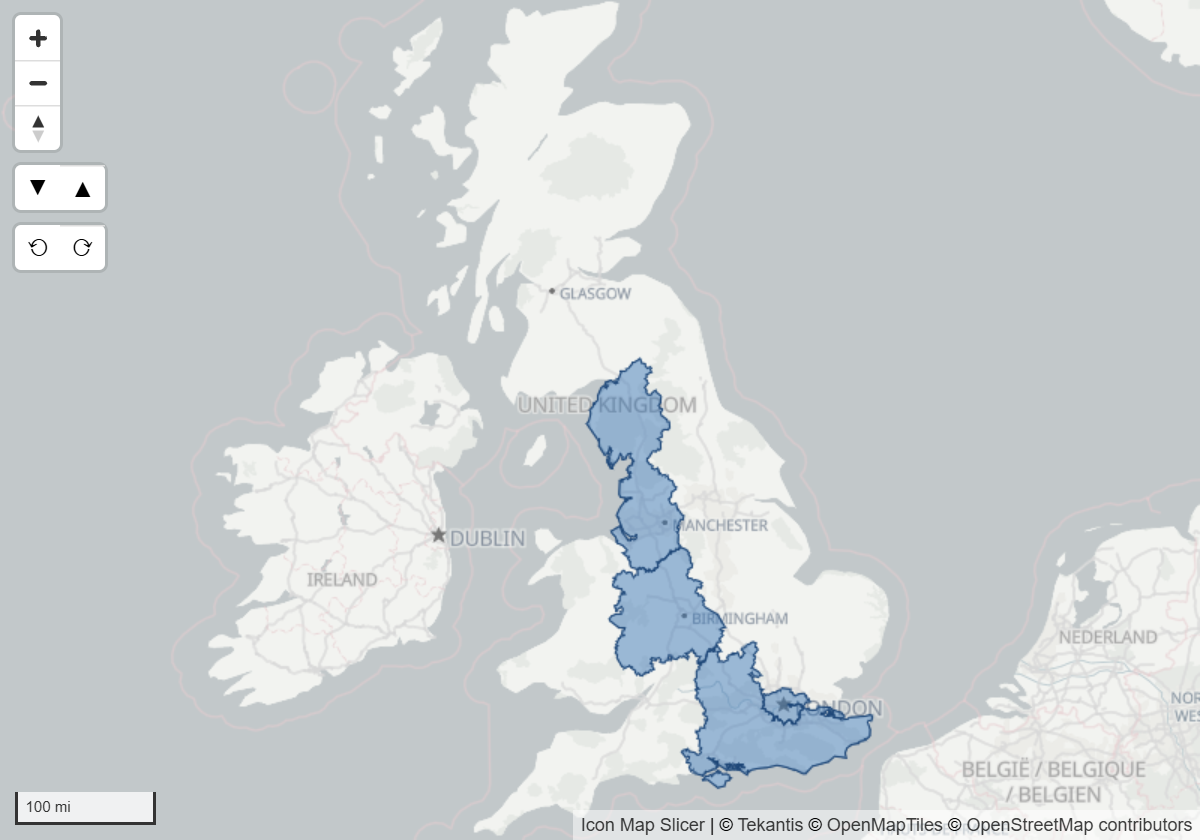
The Vector Tiles reference layer takes a MapLibre style and draws its layers over the basemap, for example a railway network, sea marks or a set of boundaries served as vector tiles. Point it at the style's JSON file, choose the layers you want, and filter them with your data if you like.
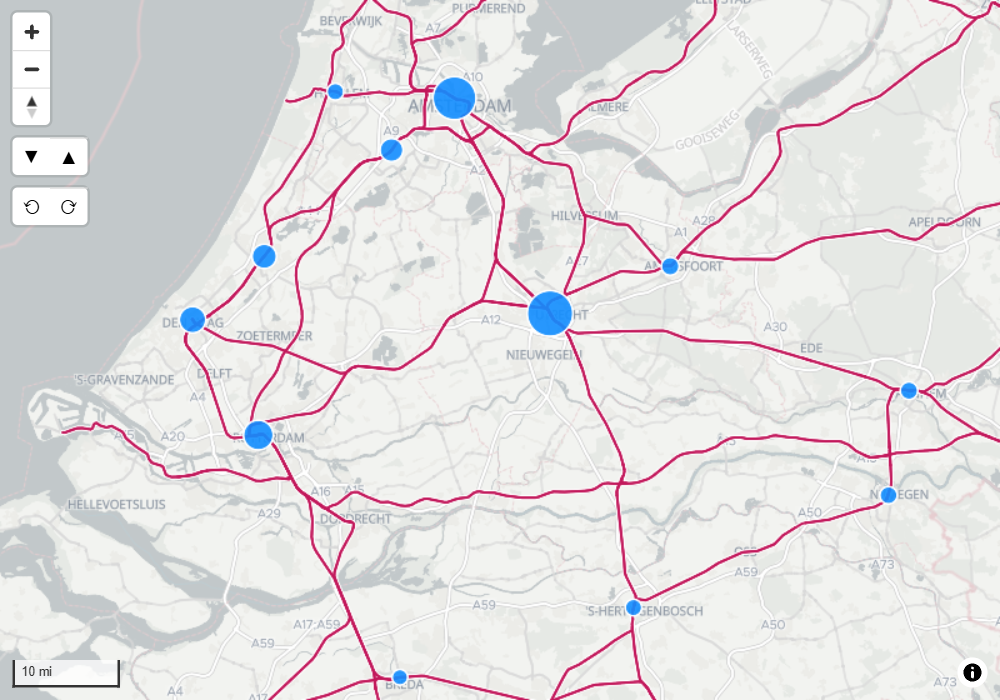
This page is about a style that is drawn as it is published. To color vector tile shapes by your data and filter the report page when one is clicked, use the Vector tiles data layer instead.
Before you start
You need the https:// link of a MapLibre style file: the JSON file that lists the style's sources and layers. Its server, and the servers of the tiles, sprites and data it names, must allow Power BI to read them (CORS). This layer cannot use the Icon Map proxy.
Add the layer
The layer is set up in the Format pane.
- Open Format pane > Reference Layers and switch on Vector Tiles. The switch is in the group's heading.
- Paste the style link into URL of the style JSON file.
- To draw only some of the style's layers, list them in Layer Names.
The Vector Tiles layer is not offered under Add a layer in the Layer Manager. Once it is on, it appears in the Layer Manager's list as Vector style. There you can change its Style link, move it up or down the drawing order, or remove it.
How the style is merged
The map reads the style file and adds its sources and layers to the basemap's own style, just above the Vector Tiles layer's place in the drawing order.
- Background and hillshade layers are left out, so the style does not cover the basemap.
- Icons and patterns from the style's sprite are drawn, alongside the basemap's own icons.
- Text in the style is drawn with the basemap's fonts. A font that the basemap's font server does not have is swapped for the closest one it has. When the basemap has no fonts of its own, the style's fonts are used.
- Zoom ranges come from the style. Each of its layers appears at the zoom levels the style gives it.
- Attribution from the style's sources is added to the map's attribution.
Prepare a style for this
A style that is meant to be drawn over another map works best:
- No background layer, and no layers that repeat what the basemap already shows.
- Colors, line widths and opacities that stand out against the basemap.
Choose the layers to draw
Layer Names is a comma-separated list. A layer of the style is drawn when its id, or the name of the source layer it reads, is in the list. Leave it empty to draw every layer. Quotes around a name are optional.
For example, railway_line, railway_station draws the layers with those ids, or the layers that read those source layers.
Layer Names takes conditional formatting (fx).
Filter the features by your data
Filter Property names a property of the features, and Filter Value lists the values to keep. With either one empty, nothing is filtered. The filter applies to the style's fill, line, symbol, circle, extrusion and heatmap layers.
| Filter Value | Keeps |
|---|---|
North |
Features whose property is North |
42 |
Features whose property is 42, as a number or as text |
'North', 'South' |
Features whose property is North or South. Put each text value in quotes when there are several |
1, 2, 3 |
Features whose property is 1, 2 or 3. Numbers need no quotes |
Text with commas but no quotes, such as York, North, is read as one value.
Features that do not have the property at all are always kept. This lets layers whose features do not carry the property stay on the map.
Filter Value takes conditional formatting (fx). When you bind it to a field or measure, the values of all the rows in the visual are combined into one list, so the layer follows the slicers on the page.
Settings
Format pane > Reference Layers > Vector Tiles
The switch in the group's heading, Vector Layer, turns the layer on and off.
| Setting | What it does | Default |
|---|---|---|
| URL of the style JSON file | The link to the MapLibre style. Takes conditional formatting (fx) | Empty |
| Layer Names | The style layers to draw, by layer id or source layer name, separated by commas. Empty draws them all. Takes conditional formatting (fx) | Empty |
| Filter Property | The feature property that the filter compares. Empty turns the filter off | Empty |
| Filter Value | The values to keep. Takes conditional formatting (fx) | Empty |
| Z Index | Drawing order, 0 to 1000. Higher is nearer the viewer | 355 |
Tips and limits
- There is one Vector Tiles reference layer per map.
- Its features have no tooltips, cannot be selected and have no legend entry.
- The layer has no zoom range of its own in the Format pane. Use the zoom ranges in the style.
- If nothing appears, open the style link in a browser to check it loads, and check that Layer Names matches the style's layer ids or source layers.
- Changing Filter Property or Filter Value updates the layer in place. Changing the link or Layer Names reads the style again.
Related
- Reference layers overview
- Vector tiles - vector tiles joined to your data
- Raster tiles, WMTS and WMS