
Raster tiles, WMTS and WMS
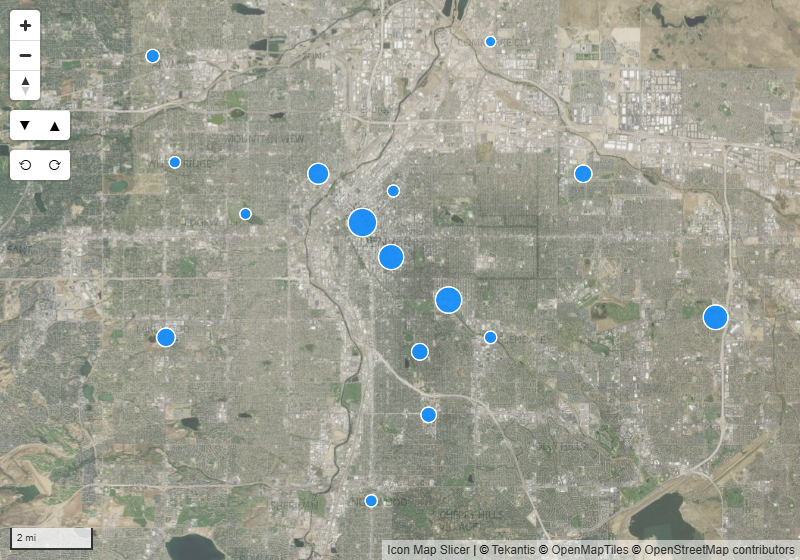
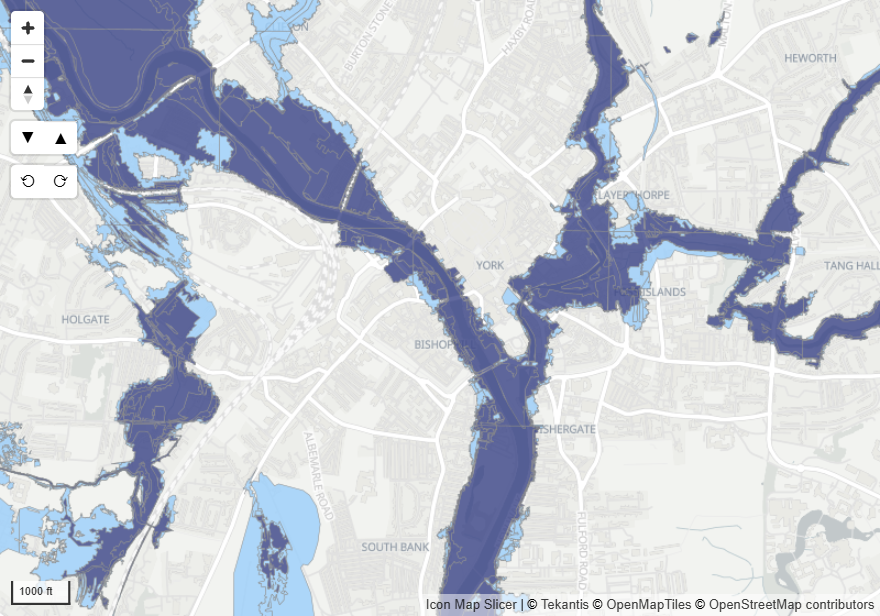
Raster layers draw pictures of a map over the basemap: aerial imagery, a scanned plan, a flood model, a published map service. Use a raster layer for a tile template, a WMTS service or a Cloud Optimized GeoTIFF, and a WMS layer for a Web Map Service. You can have up to five of each.
Which one to use
| You have | Use | Looks like |
|---|---|---|
| A tile template | Raster layer | https://tile.example.com/{z}/{x}/{y}.png |
| A GeoTIFF file on a web server | Raster layer, with Cloud Optimized GeoTIFF (COG) on | A link ending .tif or .tiff |
| A raster PMTiles archive on a web server | Raster layer | A link ending .pmtiles |
| A WMS service | WMS layer | https://example.com/geoserver/wms |
A WMTS service also goes in a raster layer: paste the service's GetCapabilities link.
All links must start with https://.
Add a raster layer
- In the Format pane, open the Layer Manager card and switch on Open Layer Manager.
- Select Add a layer, then Reference layer, then the Tiles & imagery tile.
- Paste a tile template, a WMTS GetCapabilities link, a GeoTIFF link or a raster PMTiles link, and select Check.
- Read the result. A tile template is tested by loading one tile. A WMTS link shows the layer that will be drawn. A GeoTIFF link or a PMTiles link is recognized from its file extension.
- Set the transparency under Style and options, select Add to map, then Apply changes.
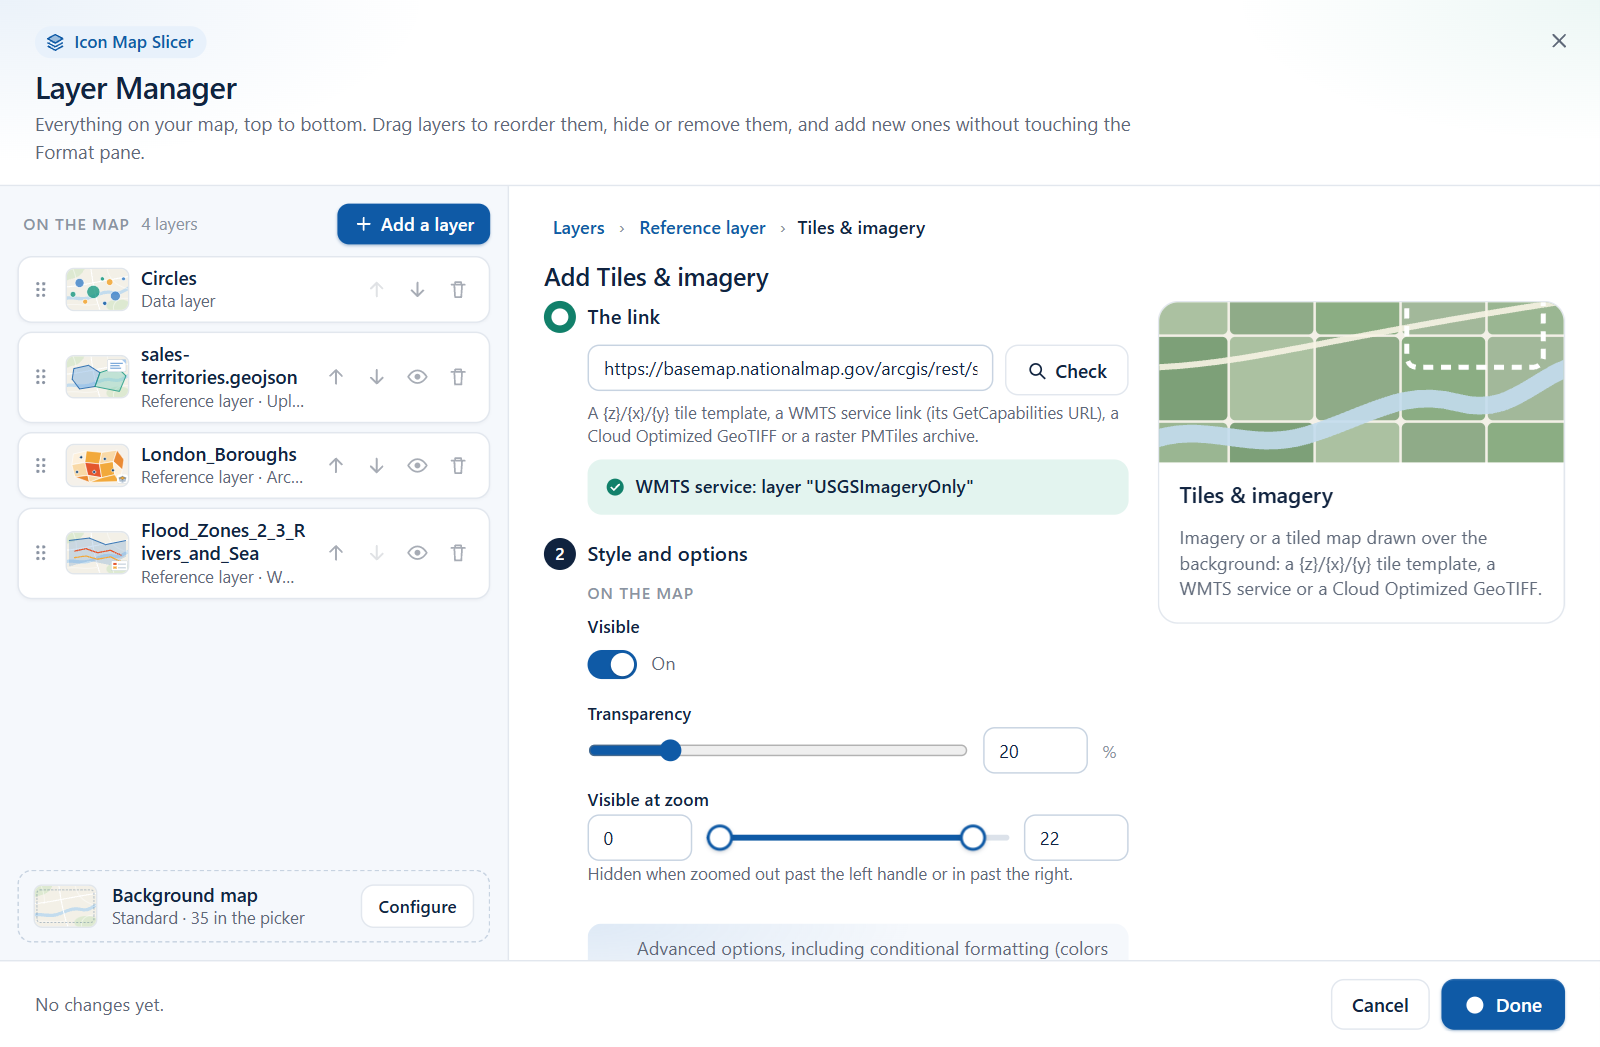
For some tile servers the check cannot read the test tile even though the map can draw the layer. The wizard says so and lets you add the layer anyway.
To do the same in the Format pane:
- Open Reference Layers and switch on Raster Tiles. The switch is in the group's heading.
- In Raster Tiles, paste the link into URL template for tile server. A WMTS GetCapabilities link works in this field too.
- For a GeoTIFF link, switch on Cloud Optimized GeoTIFF (COG).
WMTS services
Paste the GetCapabilities link of the service. The map reads the capabilities and draws the service's tiles in the Web Mercator tile scheme (GoogleMapsCompatible, EPSG:3857).
A WMTS layer that is not published in Web Mercator cannot be drawn. The map shows a message when that is the case.
Servers that block Power BI
If the check of a WMTS link reports "This server does not allow Power BI to read it", tick Read it through the Icon Map CORS proxy (only for servers you trust). The server is always tried directly first. The proxy needs an Icon Map license key and may consume additional usage credits. When Airgapped Environment is on, or your license rules the proxy out, the check box is not offered. See ArcGIS sign-in and the proxy.
The Format pane has no proxy switch for raster layers. To change it later, select the layer in the Layer Manager and change Use proxy when required in its Source section.
A Cloud Optimized GeoTIFF is read in parts, as the map needs them. Its server must support HTTP range requests and allow Power BI to read it (CORS).
If the tile provider asks for attribution, add it in Format pane > User Interface > Controls > Additional Attribution. See Map controls.
More raster layers
Set Number of Additional Layers (0 to 4). An Additional Raster Layer {n} group appears with the same settings. Choose which additional layer it shows in Apply settings to.
Raster settings
Format pane > Reference Layers > Raster Tiles
The switch in the group's heading, Raster Layer, turns raster layers on and off.
| Setting | What it does | Default |
|---|---|---|
| URL template for tile server | A {z}/{x}/{y} tile template, a GeoTIFF link or a raster PMTiles link. Takes conditional formatting (fx) |
Empty |
| Tile Size | The size of the server's tiles in pixels, 256 to 4096 | 256 |
| Cloud Optimized GeoTIFF (COG) | Switch on when the link is a GeoTIFF file | Off |
| Transparency | 0 is solid, 100 is invisible | 20 for the first layer, 0 for additional layers |
| Min Zoom | The layer is hidden when the map is zoomed out past this level | 0 |
| Max Zoom | The layer is hidden when the map is zoomed in past this level | 22 for the first layer, 24 for additional layers |
| Visible | Shows or hides the layer. Takes conditional formatting (fx) | Yes |
| Z-Index | Drawing order, 0 to 1000. Higher is nearer the viewer | 354 for the first layer, 344 for additional layers |
| Number of Additional Layers | How many more raster layers the map has, 0 to 4 | 0 |
| Apply settings to | The additional layer that the Additional Raster Layer group shows. Shown when there is one | Layer 1 |
Add a WMS layer
A WMS server draws map images on request. The server must use an https:// address, must allow Power BI to read it (CORS), and must be able to serve the layer in Web Mercator (EPSG:3857). WMS layers cannot use the Icon Map proxy.
- In the Layer Manager, select Add a layer, then Reference layer, then the WMS tile.
- Paste the WMS service address and select Check. The wizard reads the service and reports how many layers it offers.
- Pick the Layer to draw. The list can include the service's group layer as well as its individual layers.
- Select Add to map, then Apply changes.
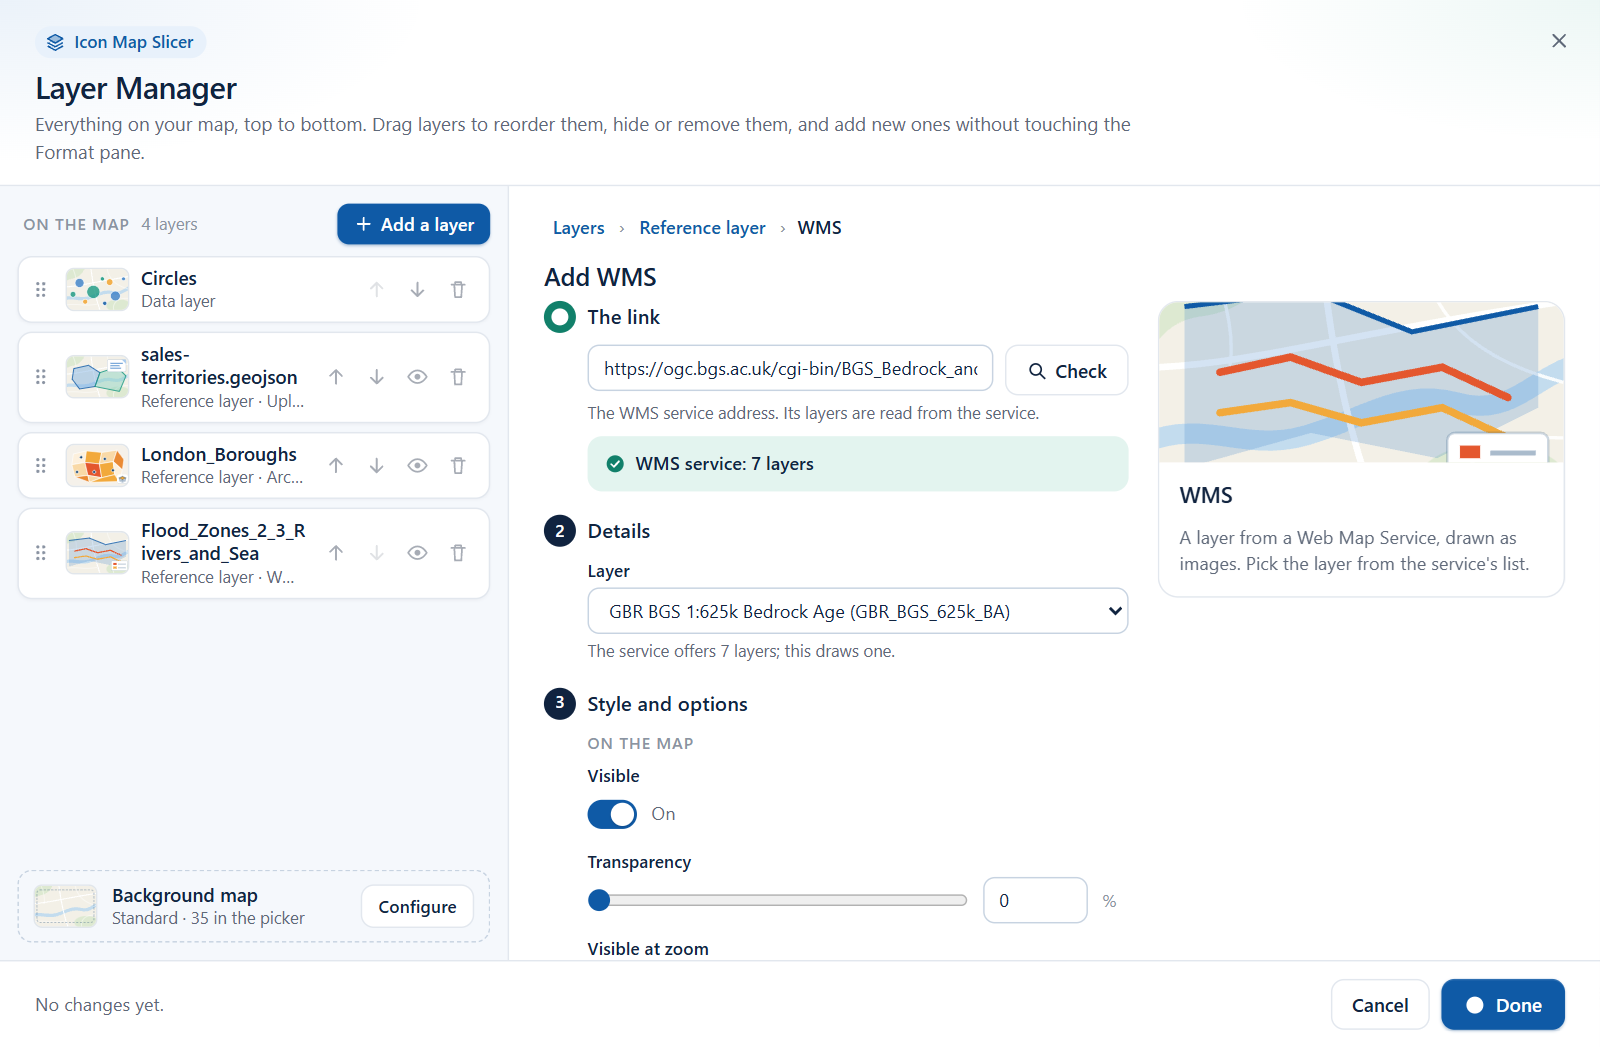
Authentication, filters, styles and custom parameters are set in the Format pane. If the service needs any of them, set it up in the Format pane as described below.
If the check reports that the server does not allow Power BI to read it, the wizard says "Its CORS rules block the request. Ask its owner to allow Power BI." A WMS layer is always read directly, so ask the owner of the server to allow Power BI.
To add a WMS layer in the Format pane:
- In the Format pane, open Reference Layers and switch on OGC WMS. The switch is in the group's heading.
- In OGC WMS, paste the service address into WMS Server URL. Either the plain address or its GetCapabilities link works.
- If the service needs a sign-in, set Authentication Type and fill in its fields. See WMS authentication.
- Pick the layer in Layer. The list is read from the service.
- Pick the image Format. Use a format that supports transparency, such as image/png, unless the layer is meant to cover the basemap.
While Manual configuration is off, the map asks the WMS server for its list of layers as you edit the report. Once the layer is working, switch Manual configuration on. The layer and format you picked are kept as text and the extra requests stop.
If the layer list cannot be read
If the pane shows "Unable to read layers from WMS server.", the map could not read the service's capabilities. Check the address and the authentication first. Then:
If the server does not allow Power BI to read its capabilities (CORS), switch on Manual configuration and type the Layer name and Format (for example
image/png) yourself.With Basic (Username and Password) authentication, the layer list is read with your user name and password. If it still cannot be read, check them, or use Manual configuration.
If the server draws maps but does not publish its capabilities, do the same.
Filter a WMS layer
- CQL Filter (optional) sends a CQL filter with each request, for servers that support it, such as GeoServer. For example
Name='York'. It takes conditional formatting (fx), so a measure can filter the layer to the current selection. - Custom Parameter Name (optional) and Custom Parameter Value (optional) add one parameter of your choice to each request. The value takes conditional formatting (fx). Every WMS layer has them.
More WMS layers
Set Number of Additional Layers (0 to 4). A WMS Additional Layer {n} group appears. Choose which additional layer it shows in Apply settings to.
Additional layers are always set up by hand: type the Layer name and the Format as text. To find the names, set the service up as the first WMS layer and read them from its Layer list.
WMS authentication
Set Authentication Type on each WMS layer.
| Authentication Type | Use it for | Fields |
|---|---|---|
| None | Public services | |
| Basic (Username and Password) | Servers that use basic authentication | Username, Password |
| Token / API Key in URL | Servers that take a key as a parameter of the address | Authentication Property Name (eg apikey or token), Authentication Property Value |
| Token / API Key in Header | Servers that take a key as a request header | Authentication Property Name (eg apikey or token), Authentication Property Value |
A report that already has ArcGIS saved as the Authentication Type, for example one built in Icon Map Pro, shows it in the list too, so you can switch to another type. It adds no credential, so the layer is requested as with None.
For a key in the URL, take the key out of the address. If the service's example address is https://example.com/wms?request=GetCapabilities&apikey=abc123, enter the address without &apikey=abc123 in WMS Server URL, apikey as the property name and abc123 as the property value.
A credential saved in a report is used for everyone who opens the report. Use an account or key that only has access to what the report should show.
WMS settings
Format pane > Reference Layers > OGC WMS
The switch in the group's heading, WMS Layer, turns WMS layers on and off.
| Setting | What it does | Default |
|---|---|---|
| WMS Server URL | The address of the WMS service. Takes conditional formatting (fx) when Manual configuration is on | Empty |
| Authentication Type | How the map signs in to the server. See the table above | None |
| CQL Filter (optional) | A CQL filter sent with each request. Takes conditional formatting (fx) | Empty |
| Custom Parameter Name (optional), Custom Parameter Value (optional) | One extra request parameter. The value takes conditional formatting (fx) | Empty |
| Manual configuration | On: you type the layer, format and style. Off: the layer and format are picked from lists read from the server | Off |
| Layer | The layer to draw. In manual mode it takes conditional formatting (fx) | Empty |
| Format | The image format: image/png, image/jpeg, image/svg+xml or image/vnd.jpeg-png, where the server offers them | image/png |
| Style (optional) | A named style that the server offers for the layer. Takes conditional formatting (fx). Shown when Manual configuration is on | Empty |
| Transparency | 0 is solid, 100 is invisible. Shown once a layer is chosen, or in manual mode | 10 |
| Minimum Zoom | The layer is hidden when the map is zoomed out past this level | 0 |
| Maximum Zoom | The layer is hidden when the map is zoomed in past this level | 24 |
| Z-Index | Drawing order, 0 to 1000. Higher is nearer the viewer | 255 |
| Visible | Shows or hides the layer. Takes conditional formatting (fx) | Yes |
| Number of Additional Layers | How many more WMS layers the map has, 0 to 4 | 0 |
| Apply settings to | The additional layer that the WMS Additional Layer group shows. Shown when there is one | Layer 1 |
Format pane > Reference Layers > WMS Additional Layer {n} has WMS Server URL, Authentication Type and its fields, CQL Filter (optional), Layer, Style (optional), Format, Transparency (default 0), Visible, Minimum Zoom, Maximum Zoom and Z-Index (default 344). It also has Custom Parameter Name (optional) and Custom Parameter Value (optional).
In the Layer Manager
Select a raster or WMS layer in the Layer Manager to edit its main settings.
| Layer | Settings |
|---|---|
| Tiles and imagery | Tile template or WMTS link, Cloud Optimized GeoTIFF, Tile size, Use proxy when required (hidden when the proxy is ruled out), Visible, Transparency, Visible at zoom |
| WMS | WMS service address, Layer, Image format, Visible, Transparency, Visible at zoom |
Replace the link or file swaps the source and keeps the layer's place and style. For a WMS layer it is also the way to pick a different layer from the service's list.
Tips and limits
- WMS layers are requested in Web Mercator (EPSG:3857). A server that cannot serve that projection cannot be drawn.
- The WMS version is taken from a
version=parameter in the address you paste. Without one, version 1.1.1 is used. - Parameters in a pasted WMS address that are not part of the standard request, such as a map or workspace name, are kept and sent with every request.
- Raster and WMS layers are pictures. They have no tooltips, cannot be selected and have no legend entry.
Related
Other basemap providers - use a tile server or WMS service as the basemap instead