
Data rows and limits
Power BI sends data to a visual in blocks of 30,000 rows. Icon Map Slicer loads one block by default and can load up to 16, for a maximum of 480,000 rows. This page explains the setting and how to keep a large map responsive.
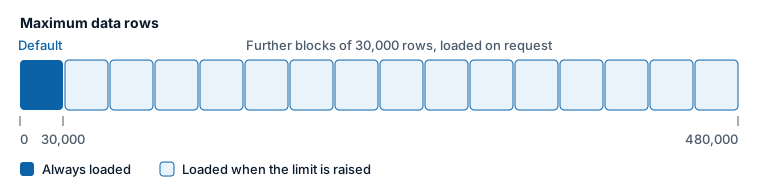
Load more than 30,000 rows
- In the Format pane, expand Data Layers.
- Expand the Data Rows group, at the bottom of the card.
- Set Maximum data rows to the number you need, from 30000 to 480000.
The visual then asks Power BI for further blocks of 30,000 rows until it reaches your limit or the end of the data. A large dataset takes longer to appear than a small one.
One row is one value of the field in * ID (required). If the map shows fewer items than you expect, check whether your data has more rows than Maximum data rows.
Settings
| Setting | Where | What it does | Default |
|---|---|---|---|
| Maximum data rows | Format pane > Data Layers > Data Rows | The most rows the visual loads. 30000 to 480000. Data is loaded in blocks of 30000 rows. | 30000 |
| Max Selections | Format pane > Selection > User Selection | The most items a reader can select at once. 1 to 100000. | 5000 |
The Data Rows group also has Use new data load logic, on by default. It decides how the blocks beyond the first 30,000 rows are loaded, and keeps conditional formatting working on them. Leave it on. It is there so that a report saved with it off can be switched back.
Conditional formatting works on every row the visual loads, including rows beyond the first 30,000.
How many items a reader can select
Selecting on the map filters the rest of the report page to the IDs of the selected items. A large selection makes a large filter, which slows down every visual on the page. Max Selections caps it.
When a selection holds more items than Max Selections, the visual keeps the first items up to the limit and leaves the rest out of the filter, without a message. This can happen with a lasso, a circle or travel time selection, with Select Intersecting Items, or when one cell or shape stands for many rows. If readers need to select very many items at once, raise Max Selections, or give them a slicer or a coarser layer, such as Cells, instead. See How Icon Map Slicer filters.
Keep large maps fast
Loading more rows makes the map slower to draw. Before raising the limit, consider whether the reader needs every point.
| Approach | Why it helps |
|---|---|
| Aggregate in the data model | Draw one row per site, area or cell instead of one per transaction. Fewer rows is always the fastest option. |
| Use Cells or a Heatmap | They show the pattern of many points without drawing each one as a separate shape. |
| Turn off tooltips and selection where they are not needed | Each layer has settings such as Include Tooltip and Selectable. Items that are only there for context do not need them. |
| Prefer circles or library icons to remote images | Each different remote image has to be downloaded. |
| Use Vector tiles for very large boundary sets | Only the shapes in view are loaded. |
| Filter with slicers | Let readers choose a region or period, so that each view loads fewer rows. |
Other limits to know about
| Limit | Value |
|---|---|
| Rows loaded by default | 30,000 |
| Most rows the visual can load | 480,000 |
| Items selected at once (Max Selections) | 5,000 by default, up to 100,000 |
| Uploaded PMTiles file for custom shapes | 25 MB |
Power BI also limits the length of a single text value to 32,766 characters, which matters when you hold WKT or GeoJSON shapes in a column. See Shapes from data.