
Getting Started
This guide walks you through adding your first catalog layer to a Power BI report with Icon Map Pro or Icon Map Slicer.
Before you start
- Add Icon Map Pro or Icon Map Slicer to your report canvas.
- Catalog layers stream from the cloud, so you need an internet connection.
- Basic datasets are free with every license. Standard and premium datasets need a license that includes them. See Access Tiers.
Step 1 - Open the catalog
There are two ways in:
- From the Layer Manager. Select Add a layer, choose Icon Map Catalog, and select Open the Icon Map Catalog. The catalog opens on Find a dataset, and the Layer Manager comes back when you have added the layer.
- From the Format pane. Select the visual, open the Format pane, find the Catalog card and turn on Configure Layers.
From the Format pane, the catalog opens on Catalog layers: everything on your map, top to bottom.
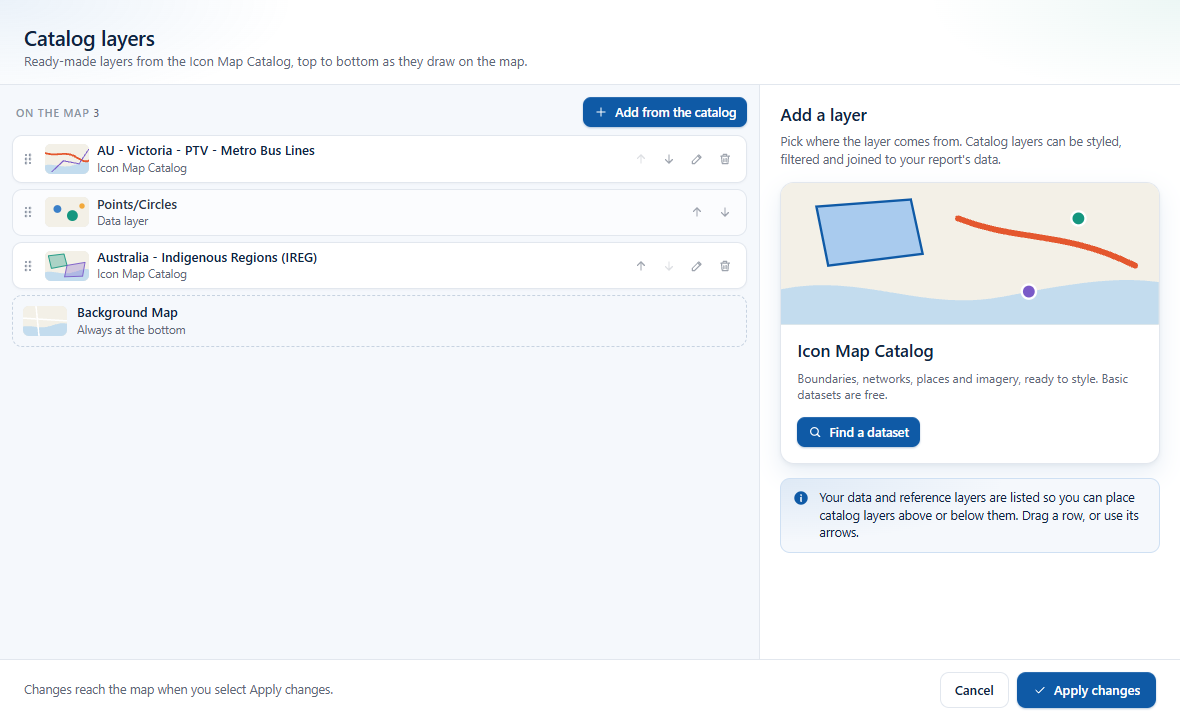
Step 2 - Find a dataset
Select Find a dataset (or Add from the catalog). The Add a layer from the Icon Map Catalog screen has the search on the left and a live preview on the right.
- Choose Keyword search and type a name, place or subject, for example
local authority districtsorFrance departments. Or choose AI search and describe the data you need in your own words. - Narrow the results with Regions and the tier buttons (Basic, Standard, Premium, Commercial).
- Select a result. The preview map shows the dataset, and the details below it show its description, source, license, coverage and what you can do with it.
See Searching for Layers for every option.
Step 3 - Configure the layer
Select Configure layer. The Configure layer screen keeps the preview map on the left and puts the settings on the right, in sections:
- Formatting - fill, outline, legend, extrusion, labels and visibility, depending on the dataset.
- Filters - show only the features you need.
- Data Binding - join the layer to your report's data (optional).
- Information, Resources and Reference Data - what the dataset is, and its downloads.
Every change shows on the preview map straight away. Rename the layer with the pencil next to its name.
See Configuring Layers for the details.
Step 4 - Join it to your data (optional)
To color or filter features from your report's data, put the field that identifies each feature (an ID, code or name) in the visual's Feature Reference field well, then open Data Binding and pick the matching property. The catalog checks your data against the layer and suggests the property that matches. See Data Binding.
Step 5 - Add it to your map
Select Add to map. You are back on Catalog layers with the new layer at the top of the list. (Opened from the Layer Manager, the catalog closes and the Layer Manager comes back.)
You can add up to 20 catalog layers to a visual.
Step 6 - Apply your changes
Drag layers, or use their arrows, to set which draws on top. Then select Apply changes. The catalog closes and the layers draw on your report's map.
Nothing reaches the map until you apply: Cancel closes the catalog without changes.
Next steps
- Searching for Layers - keyword and AI search, regions and tiers.
- Configuring Layers - every styling option.
- Data Binding - connect catalog layers to your data.
- Layer Management - reorder, edit and remove layers.
- Format Pane Settings - settings you can change without opening the catalog.