
Configuring Layers
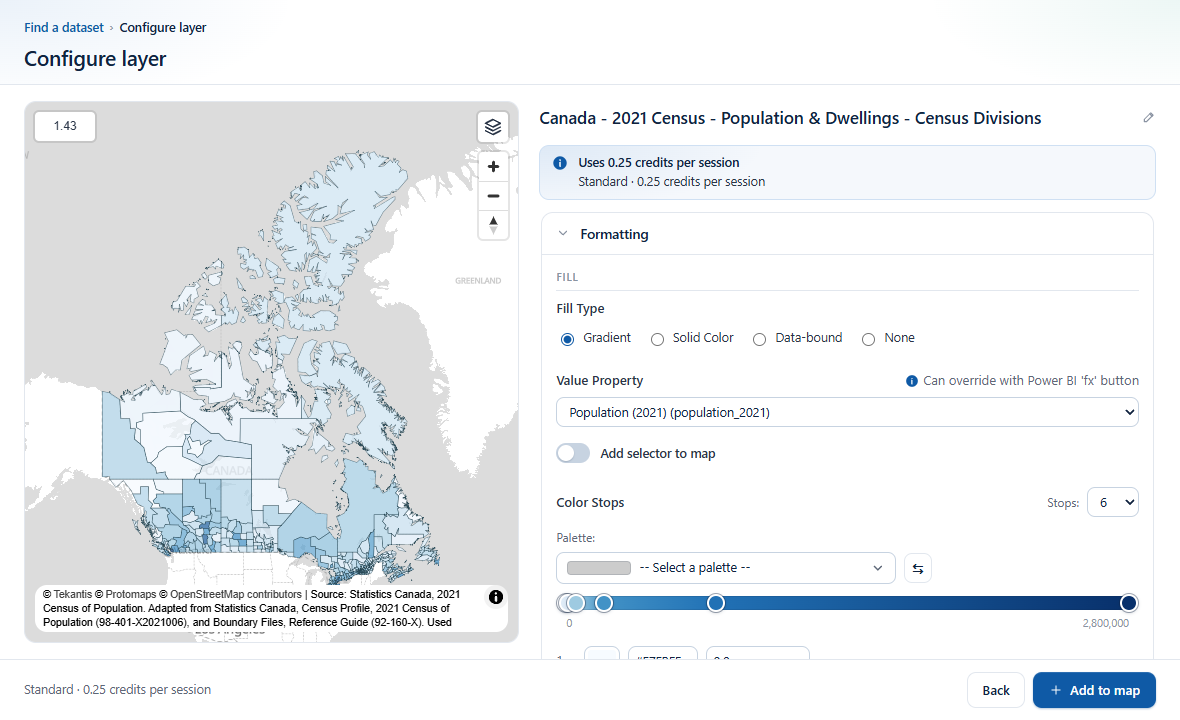
When you select Configure layer for a dataset, the Configure layer screen opens: a live preview map on the left and the layer's settings on the right. Every change shows on the map straight away. The same screen, titled Edit layer, opens when you edit a layer you have added.
The screen
- The preview map shows the layer as it will look. Pan and zoom to check it at different scales; the box in the corner shows the current zoom level, which helps when you set the visibility range. Change the basemap with the layers button.
- The layer's name is at the top of the settings. Select the pencil to rename it.
- The price shows above the settings for a dataset that uses credits, and in the footer.
- Add to map adds the layer (Update layer when you are editing). Back returns to the search; Cancel leaves a layer you are editing as it was.
The settings
The settings are grouped in sections. Select a section's heading to open or close it. Which sections and options appear depends on the dataset's geometry (areas, lines or points) and what it supports.
| Section | What it holds |
|---|---|
| Formatting | Fill, Outline, legend, Extrusion, Lines, Points, Labels and Visibility. |
| Filters | Show only the features you need, by their property values. |
| Data Binding | Join the layer to your report's data. |
| Information | The dataset's description, source, license and attribution. |
| Resources | Downloads and links, such as a sample report or a video. |
| Reference Data | The dataset's property values, as a table you can browse. |
Working with the controls
The drawn controls - the color stops of a gradient, width by zoom level, height stops and the visibility range - can be dragged with a mouse or a finger, and work from the keyboard: Tab to a handle, then use the arrow keys to move it a step, Page Up and Page Down for bigger steps, and Home and End for the ends of the range. Screen readers announce each handle's value.
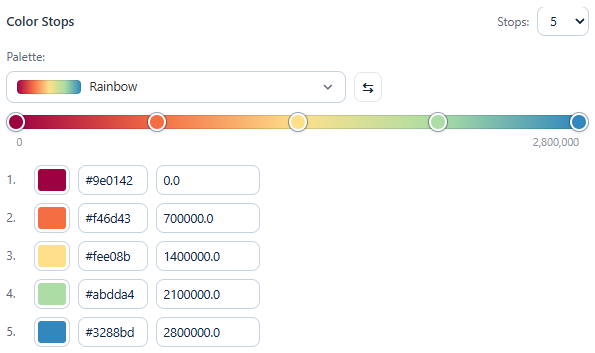
The Palette picker works from the keyboard too: Enter opens it, the arrow keys move through the palettes and Enter picks one.
Ready-made styles and custom layers
Datasets come in two kinds:
- Ready-made styles - one or more designed looks to choose from (for example "Standard", "Signals" or "Max Speed" for a railway dataset). Choose one from the style list; there is nothing else to set.
- Custom - you control the fill, outline, labels, extrusion, lines, points, visibility and filters.
Most boundary and administrative datasets are custom. Some infrastructure and reference datasets use ready-made styles.
Layer groups
Some datasets are made of several variants - for example, a country's boundaries at different levels of detail, or one dataset per city. A Layer Variants section lists them:
- Zoom-based - each variant shows at its own zoom range (coarse boundaries when zoomed out, detailed ones when zoomed in), switching automatically.
- Switchable - select a variant to preview it on the map.
Untick a variant to leave it off your map.