
Release notes
What changed in each version of Icon Map Lite, newest first. Use this page to check whether a fix or feature is in the version you are running.
Which version am I running?
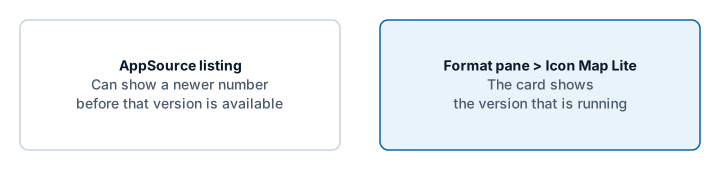
Select the visual and open Format pane > Icon Map Lite, the last card in the pane. It shows the version that is running. The start page of an empty visual shows it too.
Power BI loads the newest version that Microsoft AppSource has published, so a report picks up a new version without any action from you. When a new version is submitted, AppSource can list its number before the visual itself is available, so the number on AppSource may not match the one you are running. The number in the Icon Map Lite card is the one to trust.
1.0.1.4
New in 1.0.1.4
Data labels
- Card labels can carry up to five links, each opening a web page through Power BI in a new browser tab. Switch on the new Links group in the Labels card and give each link an address in Link 1 URL to Link 5 URL, with optional text, a second line and an icon. Each takes conditional formatting. See Links on cards.
- Twelve link styles, from Action List (the default), Action Buttons, Clean Rows, Call to Action, Button Pair, Action Bar, Action Bar, Filled and Tiles to plain Buttons, Outline Buttons, Chips and Text Links. A new Link Format group sets the text color and the button color (each by conditional formatting), text size and weight, corners, hover color, icons, layout, alignment and where the links sit on the card.
- Clicking a link opens it without selecting the item. Links also show on cards that appear on mouse over or when selected, and a card shown on mouse over stays up while the pointer moves onto it.
- In Windows high contrast mode, links are drawn in the high contrast hyperlink color, with every button, row and tile as an outline.
- Keyboard: step to an item with the arrow keys, then Tab reaches each link on its card and Enter or Space opens it. Screen readers announce the links.
- Pointer Gap (px), in Labels > Placement, leaves a space between the tip of a callout tail or pin and the location, so the pointer no longer covers the circle or icon.
- Stem Height (px) now goes from -300 to 300. A negative height hangs the card below its location.
- Accent Color takes conditional formatting on the Card style and on stem pins, so each card's stripe and pin can follow its row. Neon and Pill keep one accent color.
- Accent Width, on the Card style, sets the width of the stripe from 0 to 40 pixels (4 by default), and takes conditional formatting. A stripe wider than 4 pixels moves the text across, so the stripe never covers it.
Shapes (from data)
- Use Z heights, in Shapes (from data) - Configuration and the Layer Manager, draws WKT and GeoJSON with a height at each coordinate at those heights: lines, polygons and points. Off by default. Height units are Meters or Feet. See Shapes at their heights.
- Reads
Z,ZMandMtags, a bare third number,MULTILINESTRING Z, and the third number of GeoJSON positions.Mvalues are ignored. A missing height between two heights on a line is filled in; a line with no height at an end, or a point or polygon missing a height, is drawn flat. - Selection, tooltips, the lasso, the circle, auto zoom and zooming to the selection work where the shapes are drawn. While Use Z heights is on, Linestring Shape offers no Routes and Fill Style offers Solid only.
Controls
- A Home Button control, in Controls, takes the map back to the view it opened with: the extent of the data while Auto Zoom is on, otherwise the default view. See Map controls.
1.0.1.3
New in 1.0.1.3
Layer Manager
- A new Layer Manager dialog shows every layer on the map in drawing order. You can drag layers into a new order, hide them and remove them.
- Add a data layer step by step, from the eight kinds in the "What kind of map are you making?" guide. Shapes (from files) offers the built-in boundaries, with the property to match and an example of the values it holds, or a file you upload.
- Add a reference layer: shapes from a file you upload, up to five, or day and night shading.
- Each layer has an editor for its colors, transparency, sizes, zoom range, labels and tooltips. It writes the same settings as the Format pane. An uploaded reference layer can replace its file, and a Shapes (from files) layer can change its shapes to another built-in set or an uploaded file.
- A Your data panel summarizes the rows the visual received, the fields that are filled in, and whether every row is drawn, with notes from the map when it has something to report.
- When a layer is on but draws nothing, the Layer Manager explains why with example rows grouped by the fields they fill in, suggests a fix, and can give you a DAX measure for drawing two layers from one table.
- A Background map page picks the built-in theme, uploads a custom basemap file, and opens the Basemap Builder. When an upload succeeds, the map switches to Custom.
- Picking a layer in the "What kind of map are you making?" guide also opens that layer's editor in the Layer Manager.
- Circles and Images & icons have a row each when both are on, with its own editor, status, warnings and remove button. Each moves in the drawing order on its own, and the count of layers counts both.
Clusters
- A new Order setting for each Cluster Group field puts its values in order: as in the data (the default), alphabetical, smart (days of the week Monday to Sunday, months January to December, numbers in numeric order), a custom list, by total value, or by value in each cluster. The bars, the donut and pie segments, the legend entries and the color pickers all follow it. See Cluster order.
- The Layer Manager's Circles and Images & icons editors have an Order of section for each Cluster Group field. It lists the values in their order with their colors, and Arrange by hand lets you move them up and down. The Images & icons editor has a Cluster nearby images switch.
Fixes
- A cluster's bars or segments could take the color of another value when the values reached the map in a different order from the one the colors were listed in. Each bar and segment now always has its own value's color.
- Changing one value's color picker could also recolor other values after the data arrived in a different order. Only the picker you change is applied.
Changes to be aware of
- The Layer Manager card is first in the Format pane, with one switch, Open Layer Manager. It replaces the Diagnostics card: Show Data Configuration Summary and its dialog are gone, and Your data takes their place.
- The layer guide's Data configuration summary button is now Open Layer Manager.
- Images are drawn at the Images Z Index (Format pane > Data Layers > Images - Configuration > Z Index, 410 by default), and the setting is shown whether or not images are clustered. In 1.0.1.1 images were drawn at the Circles position, so with the defaults they now draw above Lines (409) as well as Circles (405).
1.0.1.1
Built-in world map
- The built-in world map now covers zoom levels 0 to 3, from world to country scale, and is built from Natural Earth data only. Version 1.0.1.0 covered zoom levels 0 to 5, which made the visual too large to import into the Power BI service from a file. Beyond zoom 3 the map adds no detail. For street-level detail, upload a custom basemap. See The background map.
- City names still follow the report's language.
- A new logo, and an AppSource button of its own on the license page.
Layers
- Routes: a new line shape that draws lines sharing a street side by side, like a transit map. See Routes.
- Cells can count points inside shapes you upload. See Cells: H3 hexagons and grids.
- Data labels on shapes from PMTiles archives.
- Blank text cells now count as empty when a row picks its layer, so tables from CSV files, Excel and Power Query can feed several layers without extra measures. See Combine several layers in one map.
Labels
- Card labels: a choice of where the text sits around the image, a solid fill instead of the frosted background, vertical alignment, and labels that appear only on mouse over or when selected. See Data labels.
- The callout tail follows the label's Position.
- Flow Tree labels at the midpoint sit on their own branch, clear of each other.
Fixes
- Flow arcs and Flow Tree with circles on no longer move the map on every formatting change.
- 3D Arcs: the tooltip stays up along an arc, and clicking an arc no longer counts as a click on the background.
- The visual loads for users whose browser sessions pass through Microsoft Defender for Cloud Apps.
1.0.1.0
The first version of Icon Map Lite: a version of Icon Map built to meet Microsoft's certification requirements.
No network requests
- The visual declares no privileges and makes no network requests. Everything it draws is inside the visual or stored in the report.
Background map
- A world map built into the visual, in six themes and a High contrast theme, or None for a transparent background.
- Place names follow the report's language.
- Switches for the map's labels, boundaries, and land and water features.
- With Windows high contrast on, the map and its controls follow the viewer's high contrast colors.
- Custom basemaps: upload an
.imbasefile for street-level detail of one area. It is stored in the report. The start page, the layer guide and the upload window link to the Basemap Builder. See Custom basemaps (.imbase).
Layers and files
- Upload GeoJSON, TopoJSON, KML, zipped shapefiles, IMDF and PMTiles archives as Shapes (from files) layers and as reference layers.
- Built-in boundaries for Shapes (from files): countries, countries split into their parts, and states and provinces. Each drill-down level can use its own source.
- Lines: the 3D Arcs, Flow arcs and Flow Tree shapes.
- Card data labels: Glass, Dark Glass, Card, Pill, Neon and Halo Text.
- Clusters with colors from a field or a rule, and every cluster category in the legend.
- Text and emoji badges for the Images layer.
- EPSG reprojection on every data layer that has the EPSG setting.
Selection and accessibility
- Selecting on the map filters the report like a slicer, and bookmarks keep the selection.
- Lasso and circle select reach shapes from PMTiles archives.
- Keyboard navigation of the items on the map.
- Clicking a tile in the "What kind of map are you making?" guide turns that layer on.
Licensing
- Licensed per user through Microsoft AppSource. Viewers without a license see a license page, and environments that cannot report licenses show a page that explains Icon Map Lite is not supported there.