
Shapes at their heights (WKT and GeoJSON with Z)
New in 1.0.1.4
With Use Z heights on, the Shapes (from data) layer draws each shape in 3D space, at the height held in each of its coordinates. An aircraft's track climbs out of the airport, a pipeline stays level at its height, and an airspace sector floats at its floor.
What you need
The same fields as Shapes from data: an ID and the shape in Image / WKT / GeoJSON. The difference is in the text: each coordinate carries a third number, its height.
| ID | Image / WKT / GeoJSON |
|---|---|
| BA117 | LINESTRING Z (-0.4543 51.4700 25, -0.5200 51.4780 600, -0.6400 51.4950 1500) |
| Pipeline 7 | LINESTRING (-3.21 55.86 240, -3.18 55.86 240, -3.15 55.87 240) |
| Sector 3 | POLYGON Z ((-1.2 51.6 2000, -0.9 51.6 2000, -0.9 51.4 2000, -1.2 51.4 2000, -1.2 51.6 2000)) |
| Waypoint | {"type":"Point","coordinates":[-0.19,51.15,3000]} |
Turn it on
- Add the Shapes (from data) layer as usual. See Add the layer.
- In Format pane > Data Layers > Shapes (from data) - Configuration, switch on Use Z heights.
- Set Height units to Meters or Feet.
- Tilt the map to see the heights. See View, zoom and projection.
The same two settings are in the Layer Manager: select the Shapes (from data) row. See Edit, reorder and remove layers.
Use Z heights is off by default, so a report whose text happens to carry heights keeps drawing its shapes flat until you turn it on. Rows without heights are drawn flat as before, so one layer can hold both.
Heights in WKT and GeoJSON
WKT
The height is the third number of each coordinate. Any of these forms works:
| Form | Example |
|---|---|
A Z tag |
LINESTRING Z (-0.45 51.47 25, -0.52 51.48 600) |
A ZM tag |
LINESTRING ZM (-0.45 51.47 25 0, -0.52 51.48 600 60). The fourth number (M, a measure) is read and ignored. |
| Three numbers with no tag | LINESTRING (-0.45 51.47 25, -0.52 51.48 600) |
| The tag joined to the type | LINESTRINGZ (...) |
POINT, MULTIPOINT, LINESTRING, MULTILINESTRING, POLYGON, MULTIPOLYGON and GEOMETRYCOLLECTION all take heights. While Use Z heights is on, MULTILINESTRING Z text, which the flat layer cannot read, is read too. A geometry tagged M only has no heights.
GeoJSON
GeoJSON has heights built in. The GeoJSON standard (RFC 7946) allows a third number in each position, the altitude: [longitude, latitude, altitude]. Geometries and Features both work, as for the flat layer.
{"type":"LineString","coordinates":[[-0.4543,51.47,25],[-0.52,51.478,600],[-0.64,51.495,1500]]}
Units and coordinate systems
Heights are in Height units: Meters or Feet. Flight data often gives altitudes in feet. With an EPSG code set, longitude and latitude are converted and the heights are kept as they are.
Every height is measured from sea level. Icon Map Lite has no 3D terrain, so the ground is at 0.
Missing heights
Not every coordinate needs a height. In WKT, a coordinate with two numbers has no height. In GeoJSON, a position with two numbers has none.
- In a line, a missing height between two coordinates that have one is filled in, in proportion to the distance along the line. A track with a height at every tenth point is still drawn as a smooth climb.
- At either end of a line, a missing height leaves the whole line flat on the map, because there is nothing to fill it from on that side.
- In a point or a polygon, every coordinate needs a height. If one is missing, the shape is drawn flat.
- In a collection, the members that have their heights are drawn at them and the rest are drawn flat.
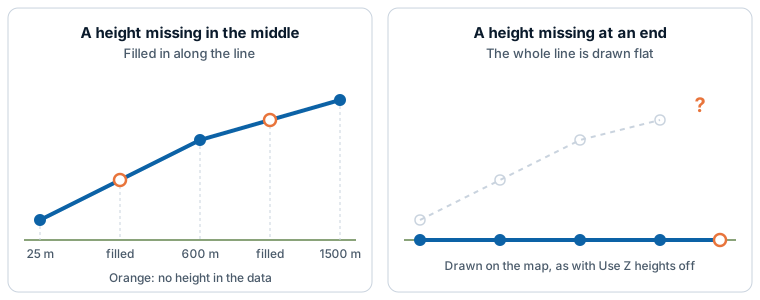
How the shapes are drawn
A row drawn at its heights uses the layer's own settings, including their conditional formatting:
| Part | Settings that apply |
|---|---|
| Lines and polygon outlines | Line Color, Line Transparency, Line Width, Line Blur, and Color Type with Gradient Color 1 and Gradient Color 2. |
| Polygon fills | Fill Color and Fill Transparency. A polygon whose corners are at different heights is drawn sloping. |
| Points | A circle of Circle Size, in the fill color with the line color around it. |
| All shapes | Minimum Zoom and Maximum Zoom. |
While Use Z heights is on, some options are not offered or do not apply to the rows drawn at their heights:
- Linestring Shape does not offer Routes, and Fill Style offers Solid only.
- A line drawn at its heights runs straight between its points: Smoothed and Bezier apply to flat lines.
- Line symbols, the images at the start and end of a line, polygon extrusion and data labels are drawn for flat shapes only.
- Points drawn at their heights are circles, whatever Show Points As is set to.
Shapes are drawn on the flat map and on the globe. On the globe, shapes on the far side are hidden.
Selection, tooltips and zoom
- Selection. Click a line, polygon or point where it is drawn, in the air, to select its row and filter the rest of the report page. The lasso, the circle and Select Intersecting Items select shapes where they are drawn on screen. See Select and filter with the map.
- Tooltips. Pointing at a shape shows the fields in Tooltips.
- Zoom. Auto zoom, zooming to the selection and the Home button frame the shapes at their heights, so a track that climbs to cruise altitude stays on screen.
- Drawing order. The shapes keep the layer's Z Index place, and move with the Shapes (from data) row in the Layer Manager.
Settings
These are in Format pane > Data Layers > Shapes (from data) - Configuration. They apply to the whole layer and do not take conditional formatting.
| Setting | What it does | Default |
|---|---|---|
| Use Z heights | Draws shapes whose WKT or GeoJSON has a height at each coordinate at those heights. Shapes without heights are drawn as before. | Off |
| Height units | Meters or Feet. Shown when Use Z heights is on. | Meters |
Every other setting is described in Shapes from data (WKT and GeoJSON).
Tips
- A shape is flat. Check the ends of a line: both need a height. Check that Use Z heights is on.
- The shapes are far too high or too low. Check Height units. Altitudes in feet read as meters draw over three times too high.
- Shapes (from files) are drawn on the ground.