
Being able to visualise our properties makes any kind of decision-making or analysis infinitely easier.
The Challenge
The Arch Company already held mapping information across its estate, including detailed outline data for many of its rental spaces. The opportunity was to make more of this information directly accessible through the business's core Power BI reporting and create a more interactive, portfolio-wide view. However Power BI's default maps and Azure Maps did not offer the level of functionality the team wanted.
The business wanted to complement the expertise of its property managers with a consistent visual tool that could provide a broader view across the estate. Detailed property outlines were particularly important: while Excel sheets can show where a space is, a map outline gives a much clearer sense of its size, shape and relationship to neighbouring spaces.
The technical challenge was to migrate and standardise detailed spatial information from a large collection of long-standing CAD drawings so it could be used reliably within Power BI. The drawings reflected the history and scale of the estate and had been maintained over many years by different surveyors and teams.
Because the drawings had been created and updated at different times, their structures and naming conventions varied. Turning that rich source information into a consistent portfolio-wide dataset required a technical solution that could identify property boundaries, connect labels to the correct spaces and prepare the information for use in Power BI at scale.
The Solution
The team came across Icon Map while looking for a more flexible way to map the portfolio in Power BI. It allowed them to display interactive outlines for properties where polygon data was available, with dots marking the locations of those still to be mapped, all within Power BI.
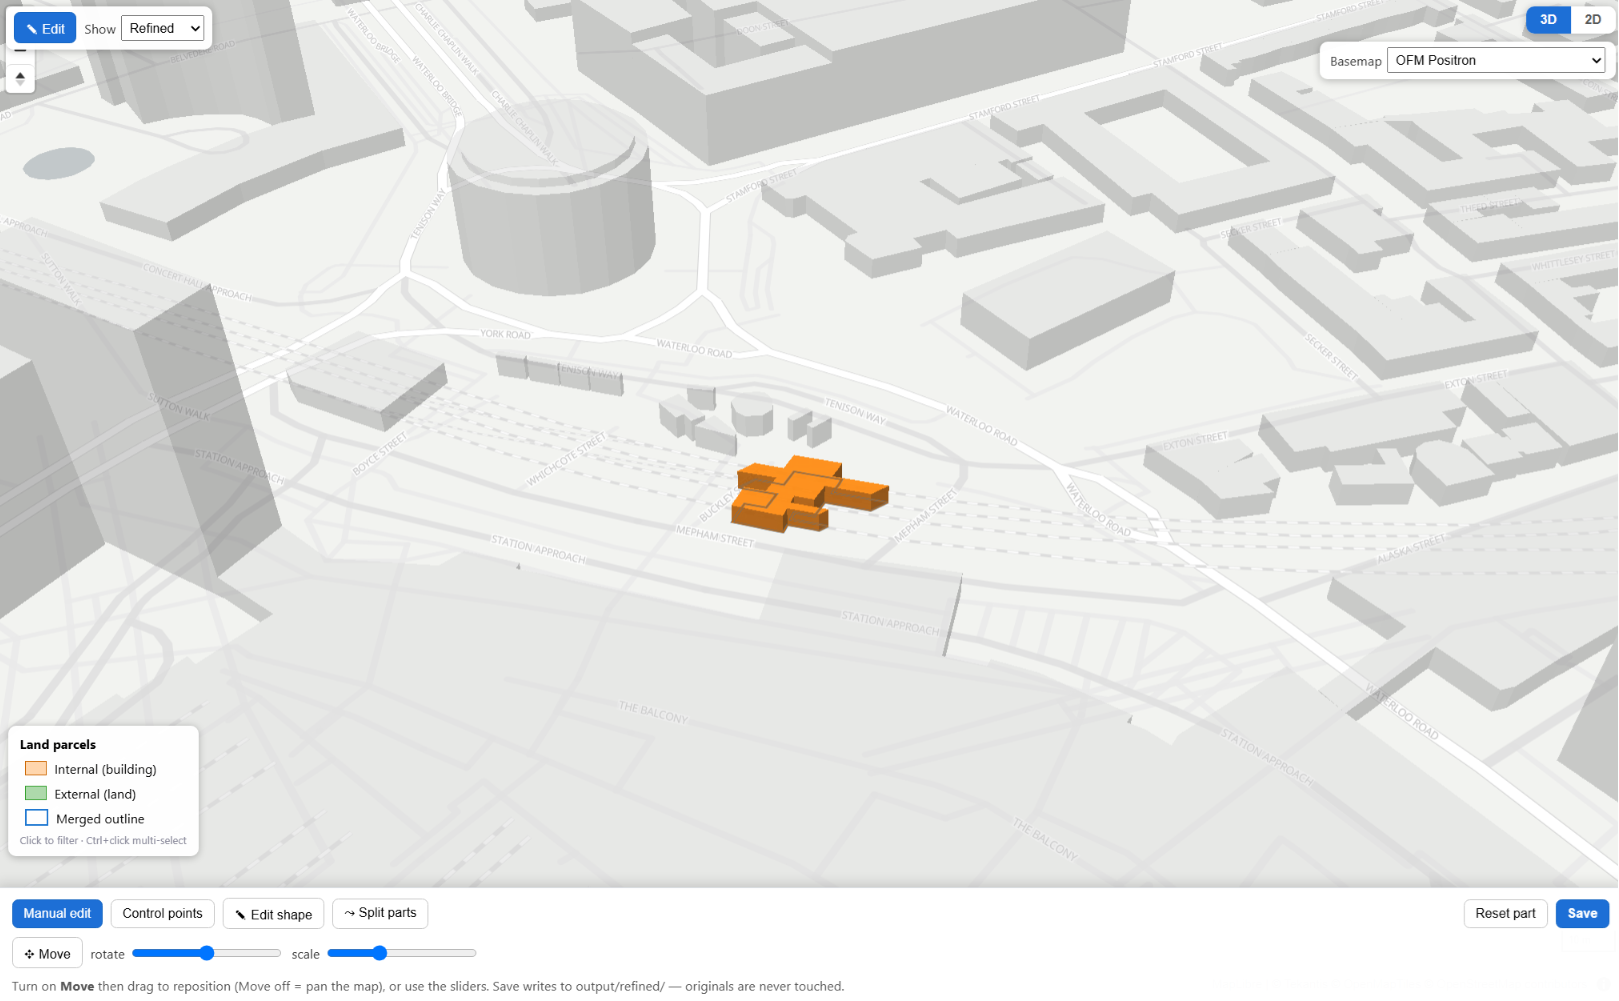
To extend the mapping coverage, the Tekantis team worked with The Arch Company and developed rules to identify property boundaries across the CAD drawings, distinguish individual arch spaces from surrounding land and associate text labels with the correct outlines.
Rather than correcting each of the approximately 550 CAD drawings individually, they could identify property boundaries even where layers were missing or incorrectly labelled, distinguish individual arch spaces from surrounding land, and associate text labels with the correct property outlines.
These rules were packaged into an automated process capable of converting the drawings in batches and producing GeoJSON and WKT geometry ready for use in Power BI.
The result was a repeatable process for converting a large and complex collection of CAD drawings into consistent, usable property data. The work has since been developed into a more general-purpose, AI-assisted CAD processing tool that can be adapted to similar projects where organisations need to extract spatial information from existing drawings.
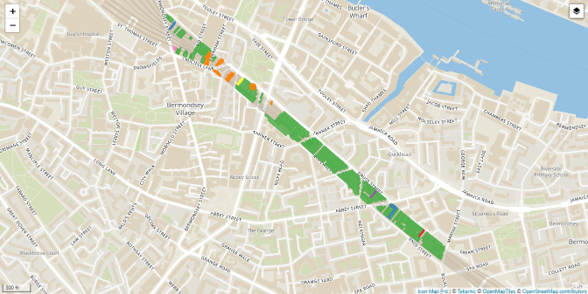
The difference is particularly clear when looking at the railway arches themselves, many of which sit in long, continuous runs. Where the map had once shown a mixture of shapes and dots, it now displays clear stretches of arches, giving the team a much clearer picture of the properties it manages.
The Results
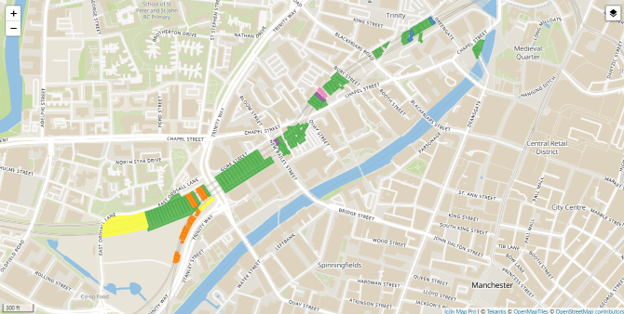
Building on The Arch Company's existing mapping, the project has increased the proportion of rental spaces shown with accurate outlines in Power BI to approximately 98%. The enhanced map makes it much easier for teams to navigate the portfolio and access the information they need. If someone wants to see every vacant space in Elephant and Castle, for example, they can simply zoom into the area and colour-code the spaces to suit their analysis.
The interactive map makes detailed property information immediately accessible to business users and helps teams look beyond individual locations to make better-informed decisions about the wider portfolio. It also strengthens the value of The Arch Company's core Power BI reporting by bringing spatial and operational information together in one place. Aidan is keen to explore more of what Icon Map can do, as he explains:
"We've been able to do everything that we want to so far, and we've probably hardly scratched the surface of the capabilities."
Aidan Jones, Business Modelling Analyst, The Arch Company
What's Next
The Arch Company has already started a new phase of the project with Tekantis, this time focusing on its undemised land, including rights of way and common areas. The next phase will bring this detailed information into the same Power BI environment, extending the joined-up view of the estate.
Bringing this land onto the map will allow the team to view rental spaces and undemised land together, giving The Arch Company an even more comprehensive and accessible view of the estate it owns and manages.