

It's day 9 of the 30 Day Map Challenge, and today's theme is urban or rural.
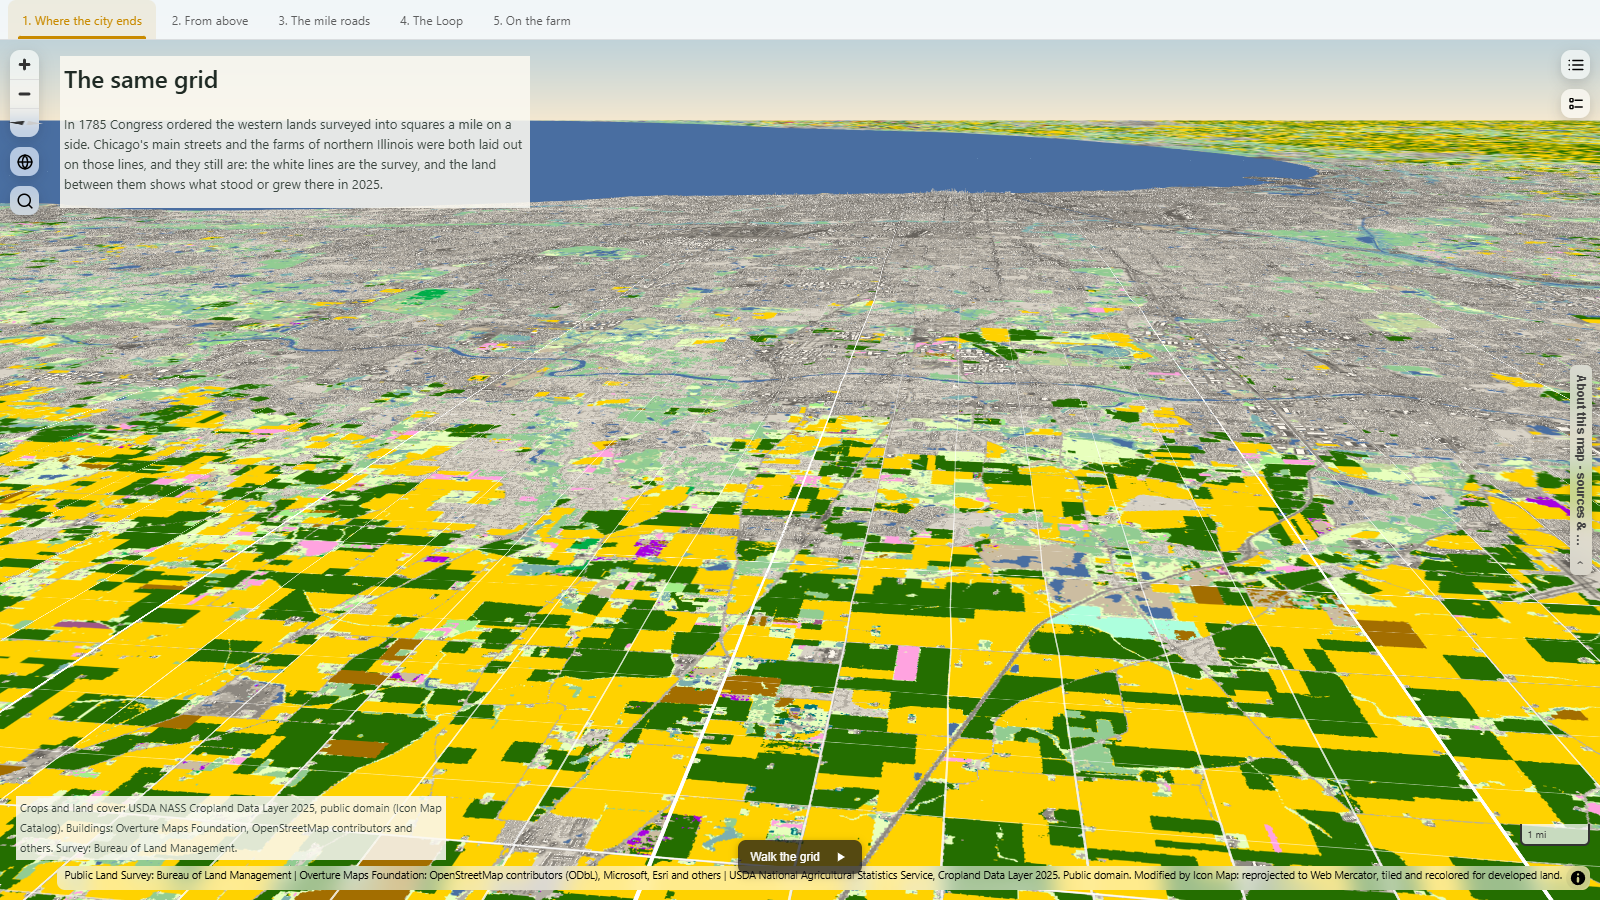
Rather than choose one, I wanted to show that in the American Midwest the city and the countryside are laid out on exactly the same lines. In 1785 Congress ordered the western lands to be surveyed into townships six miles square, each divided into 36 sections a mile on a side. Northern Illinois was surveyed that way, and both Chicago and the farms around it were built on top of it.
So this map draws the survey's section and township lines in white over what stood or grew on the land in 2025: crops and land cover from USDA on the ground, and about 3.7 million buildings standing at their heights, from the Loop out to the fields west of DeKalb.
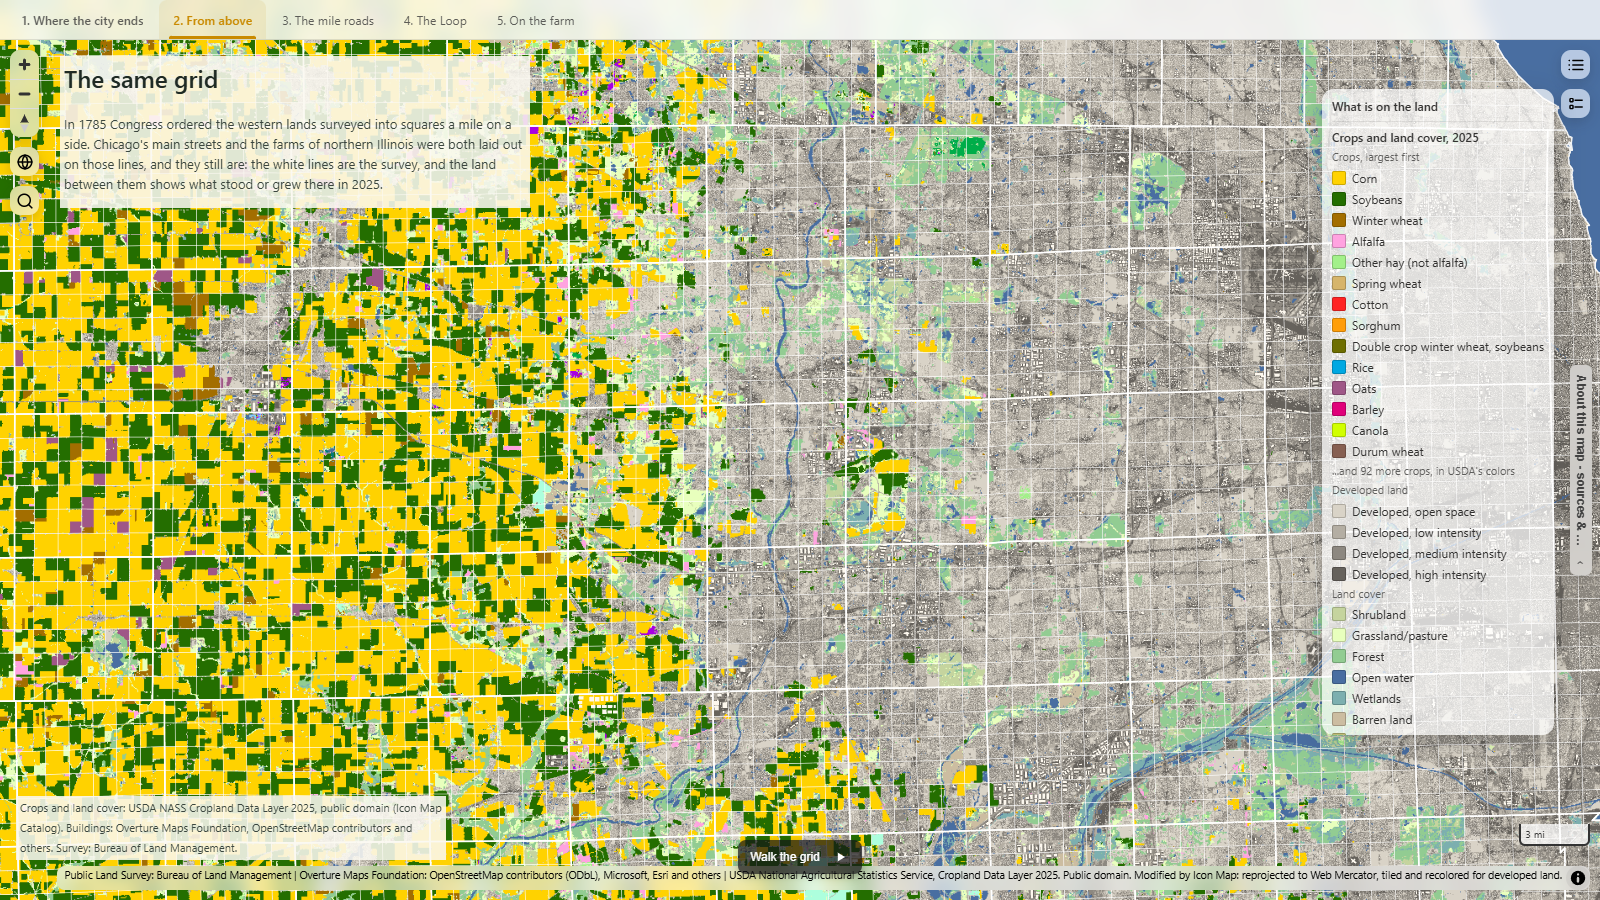
From above it's easy to see. To the west the squares are filled with corn in yellow and soybeans in green, and to the east the same squares are filled with houses. Many of Chicago's main streets, like North Avenue, Fullerton, Chicago Avenue, Halsted and Ashland, sit on section lines, which is why so many of the city's big roads are a mile apart. Not every street follows the grid though: the diagonal avenues are older trails that were there before the survey.
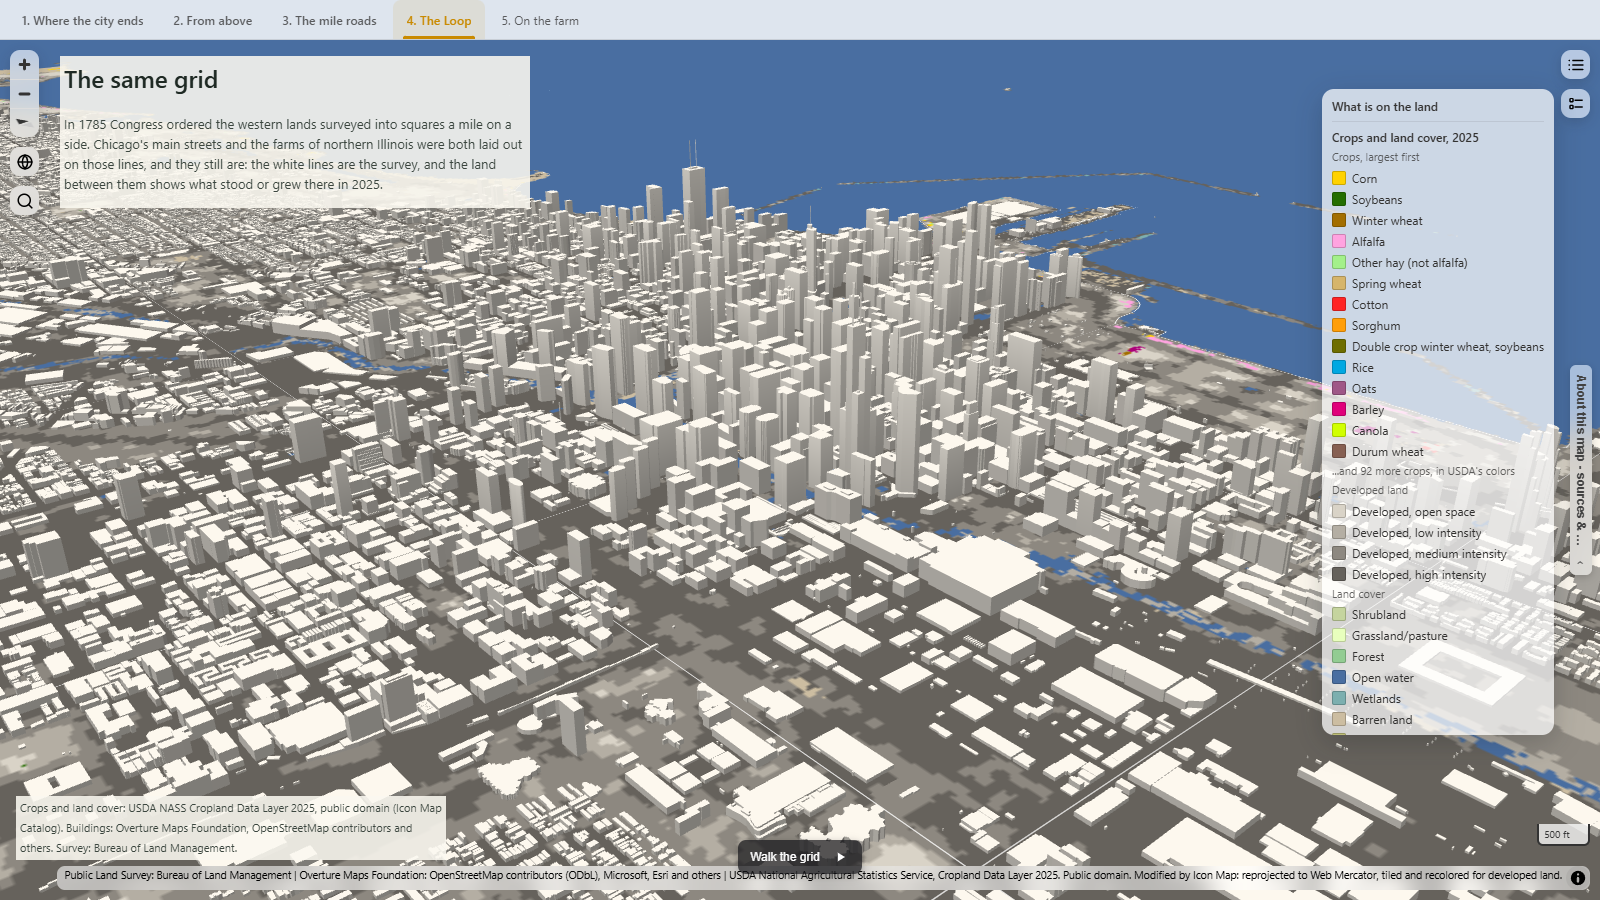
In the Loop the grid gets its tallest, with Willis Tower reaching 442 metres at the roof and 527 metres at the top of its antennas. Out near Sycamore, the same lines become field edges and country roads.
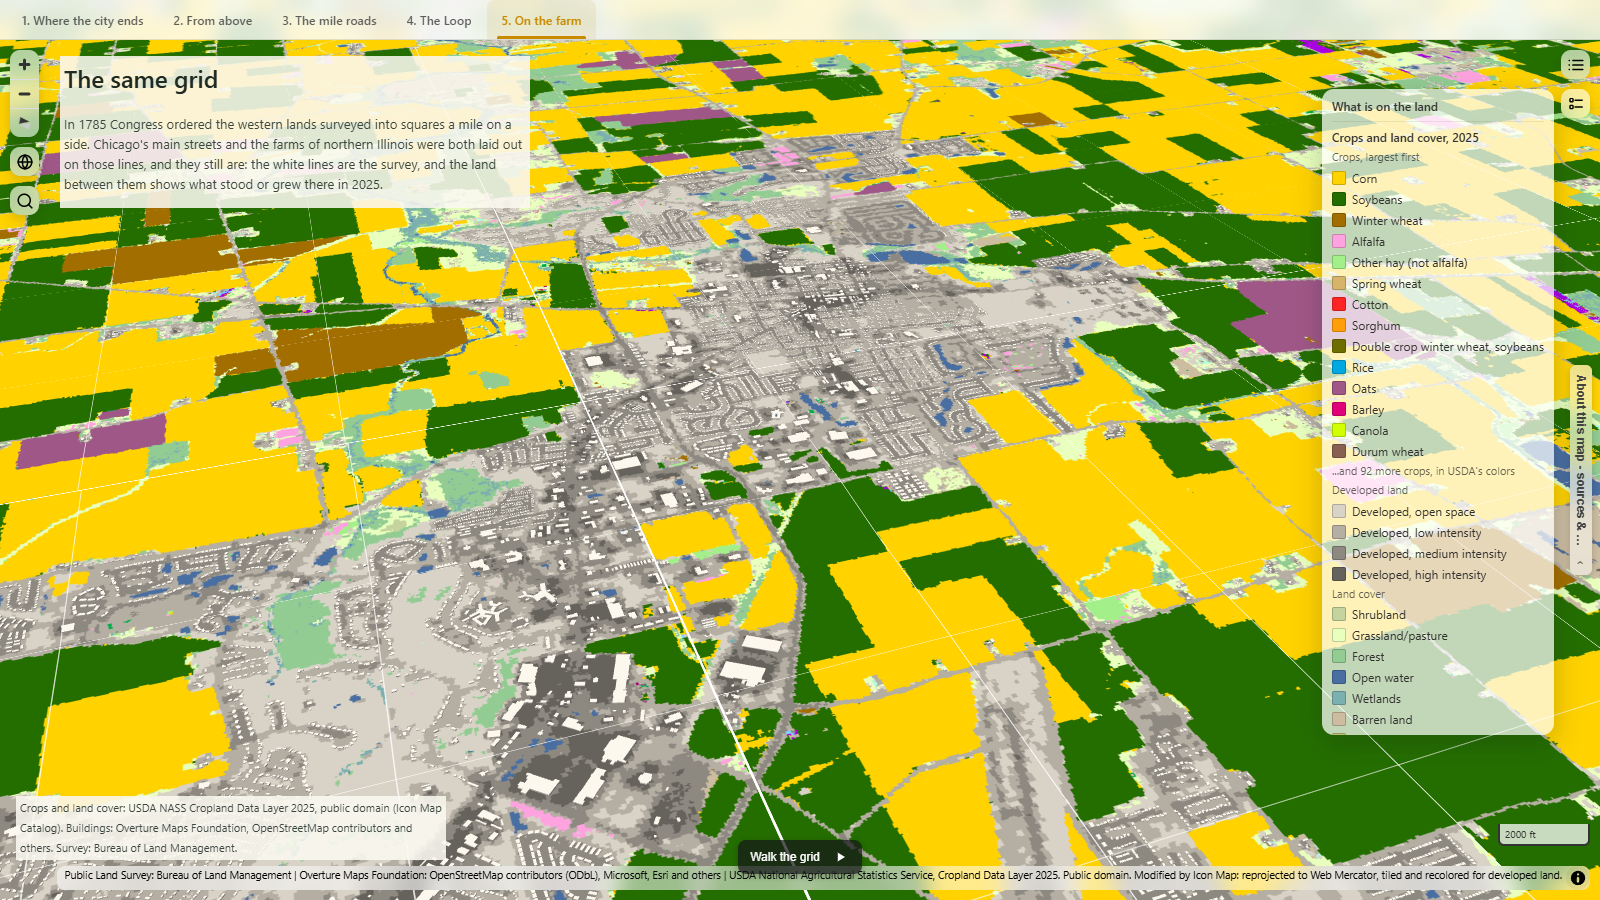
Use the tabs along the top of the map to move between the five views, or press Walk the grid at the bottom for a guided tour.
How did I build it?
The crops come straight from the Icon Map Catalog, where USDA's Cropland Data Layer for 2025 is now available as a ready-made layer covering the lower 48 states. I built the rest of the map using Icon Map's MCP service: the buildings are cut from Overture Maps into a vector tileset and extruded to their heights, keeping the separate parts of buildings so towers like Willis Tower keep their steps, and the survey lines come from the Bureau of Land Management. Both tilesets are hosted on OneLake.
How accurate is it?
The Cropland Data Layer is classified from satellite imagery, not surveyed field by field. USDA reports an overall accuracy of 75% for 2025 across row crops and annual fruit and vegetables, and 92% for corn. The developed land comes from the USGS National Land Cover Database. USDA draws all four developed classes in the same grey, so I've shaded them from light to dark to show how built up each area is.
Most buildings have a height in the data, but around 14% don't and are drawn at a default 5 metres. The survey lines are drawn as the BLM maps them; real sections are rarely exactly a mile square, as the surveyors corrected the grid as they went.
Sources
Crops and land cover: USDA National Agricultural Statistics Service, Cropland Data Layer 2025. Public domain. Reprojected, tiled and recoloured for developed land by Icon Map, in the Icon Map Catalog.
Buildings: Overture Maps Foundation, release 2026-10-21, including data from © OpenStreetMap contributors (available under the Open Database License), Microsoft, Esri and others.
Survey sections and townships: Bureau of Land Management, Public Land Survey System.
Chicago's streets and the survey: Encyclopedia of Chicago and Chicago Public Library.