

It's day 3 of the 30 Day Map Challenge, and today's theme is polygons.
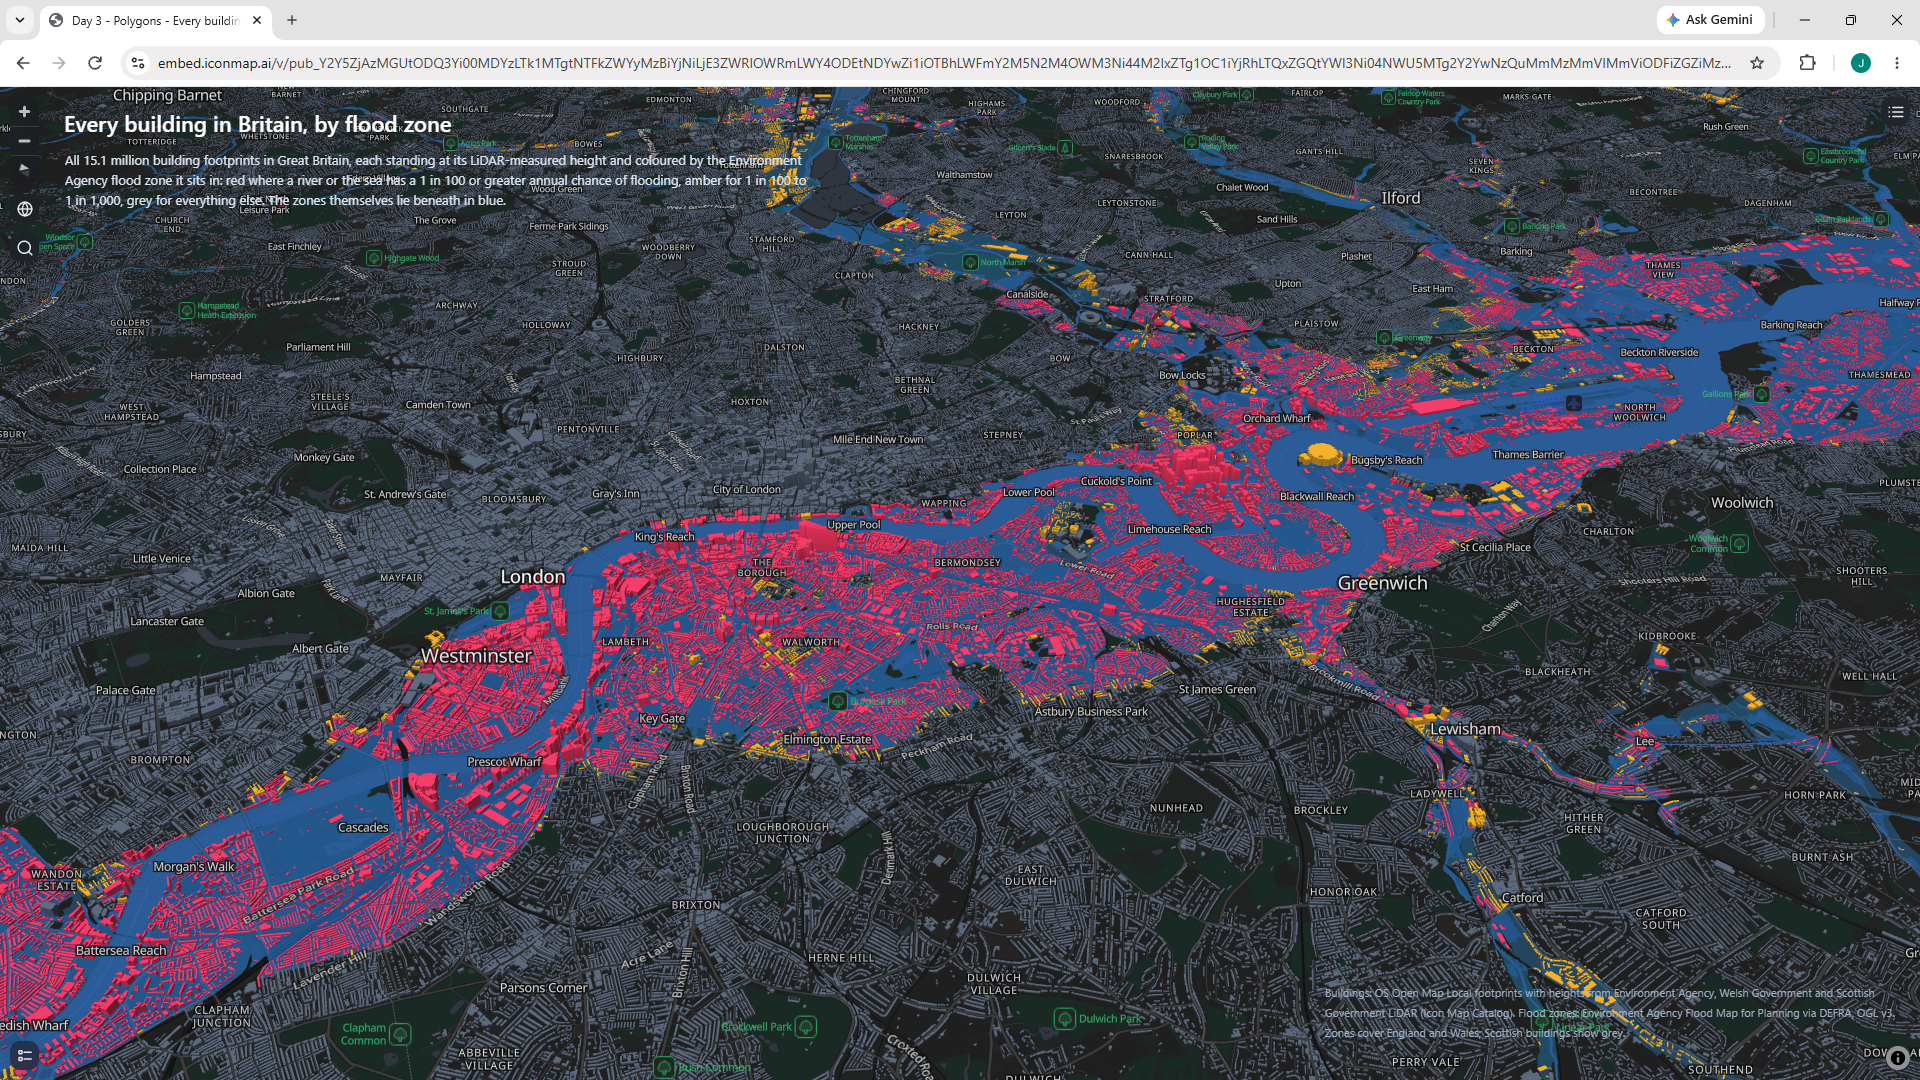
For this challenge, I've 2 polygon layers, both from Icon Map Catalog.
The first is Environment Agency data showing the risk of flooding from rivers or the sea. Over this I've drawn every building in Britain using open data from Ordnance Survey. These buildings have bene coloured red or yellow depending on which flood risk area they fall in. They're extruded in 3D using height data generated from DEFRA lidar data. All of this work is already done inside the catalog layer through, so it's just a question of picking the formatting options.
Here's the live map to play with: